. 2024 Apr 8;7(1):426.
doi: 10.1038/s42003-024-06140-6.

Targeting TRIP13 in favorable histology Wilms tumor with nuclear export inhibitors synergizes with doxorubicin

Affiliations

Targeting TRIP13 in favorable histology Wilms tumor with nuclear export inhibitors synergizes with doxorubicin

Karuna Mittal et al. Commun Biol. .

Abstract

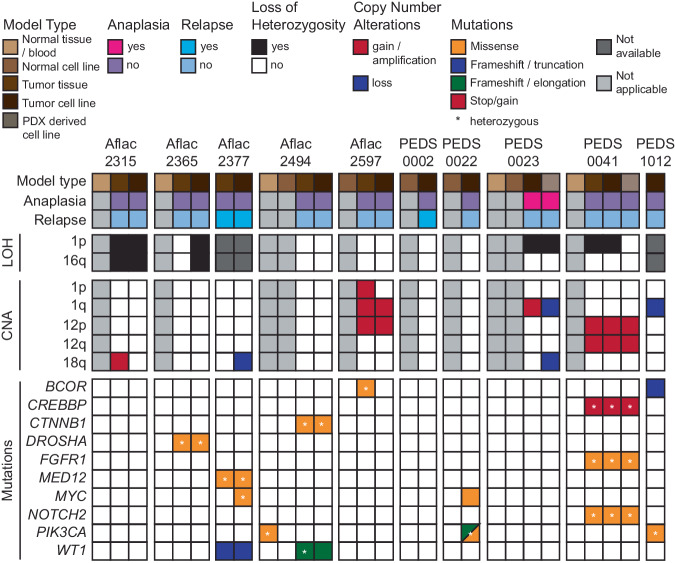
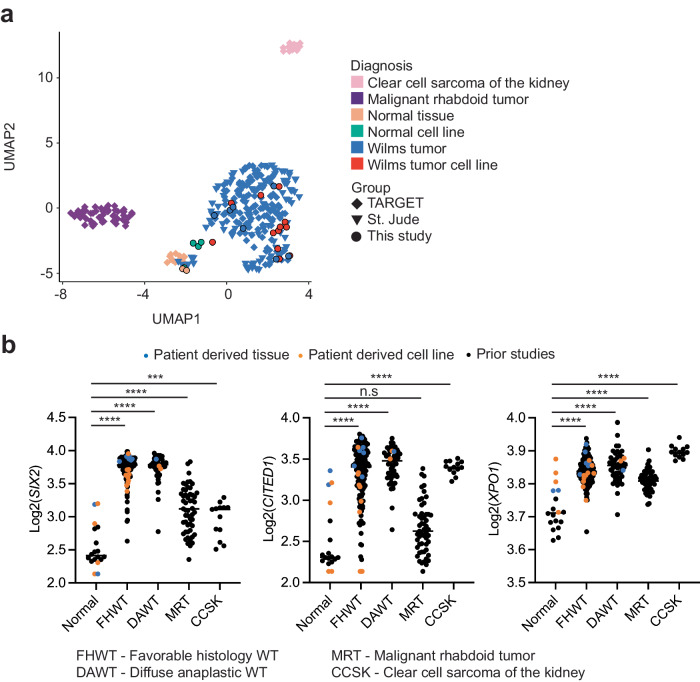
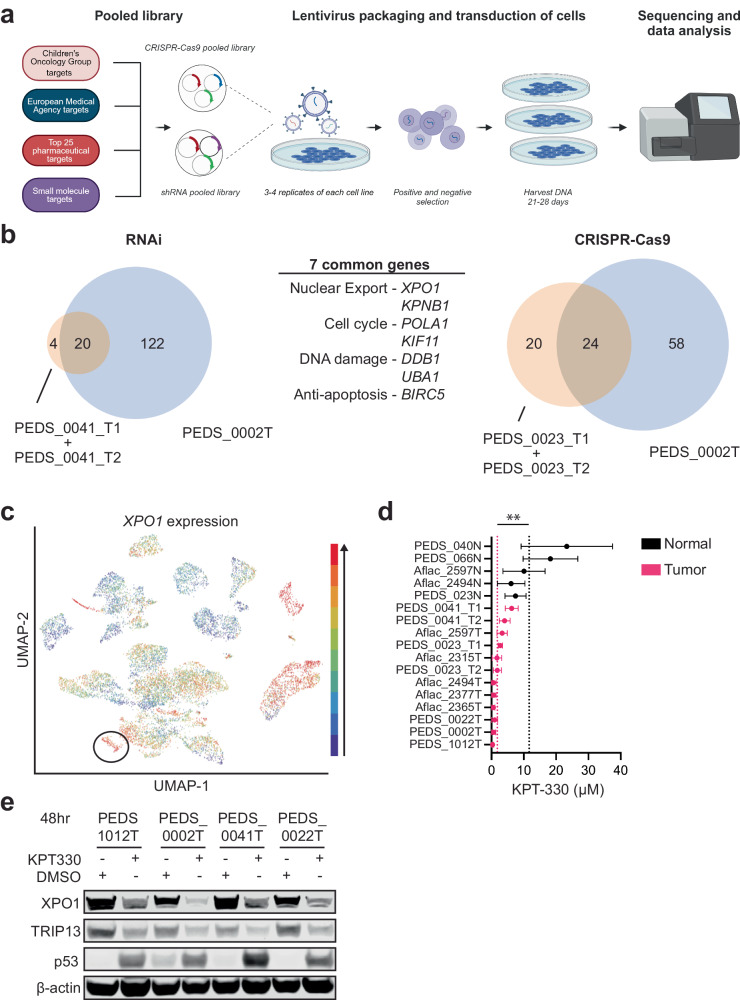
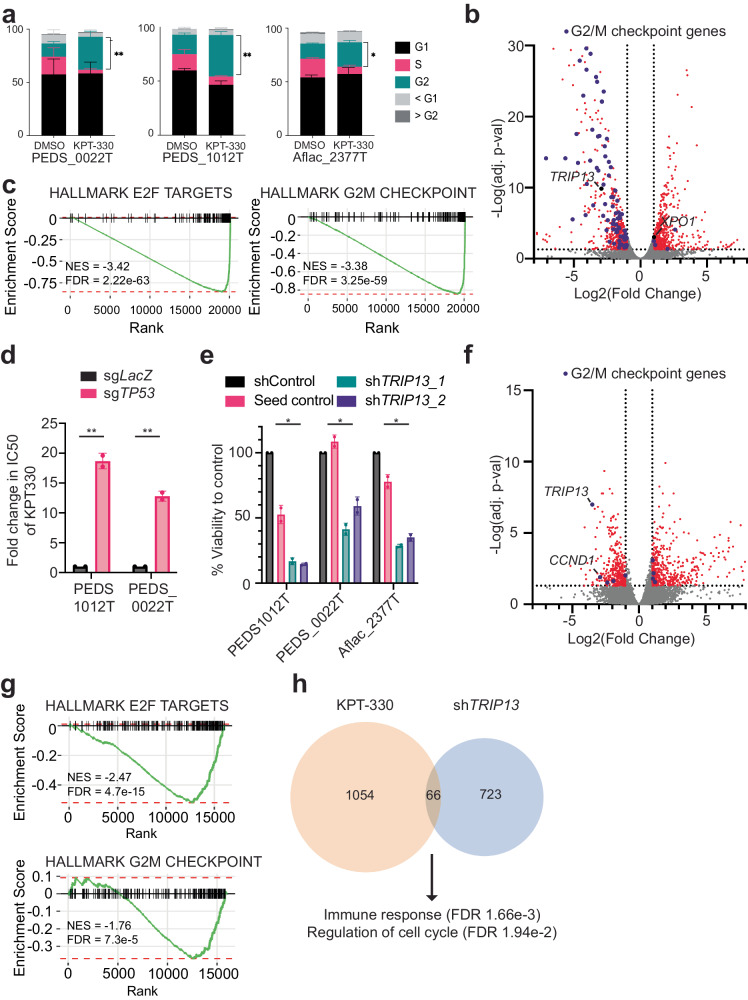
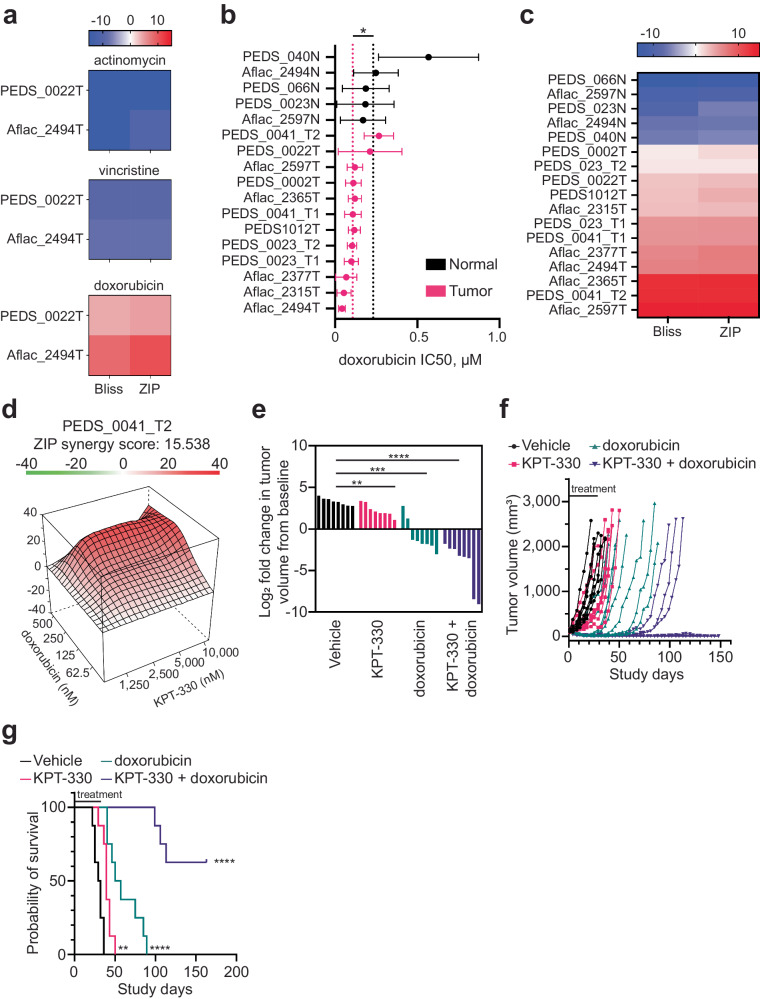
Wilms tumor (WT) is the most common renal malignancy of childhood. Despite improvements in the overall survival, relapse occurs in ~15% of patients with favorable histology WT (FHWT). Half of these patients will succumb to their disease. Identifying novel targeted therapies remains challenging in part due to the lack of faithful preclinical in vitro models. Here we establish twelve patient-derived WT cell lines and demonstrate that these models faithfully recapitulate WT biology using genomic and transcriptomic techniques. We then perform loss-of-function screens to identify the nuclear export gene, XPO1, as a vulnerability. We find that the FDA approved XPO1 inhibitor, KPT-330, suppresses TRIP13 expression, which is required for survival. We further identify synergy between KPT-330 and doxorubicin, a chemotherapy used in high-risk FHWT. Taken together, we identify XPO1 inhibition with KPT-330 as a potential therapeutic option to treat FHWTs and in combination with doxorubicin, leads to durable remissions in vivo.


Conflict of interest statement

The authors declare the following competing financial interests. K.M. is currently employed at PreludeDx. A.L.C. is currently an employee of AstraZeneca. G.C. is currently an employee of Johnson & Johnson. D.M.W. is currently an employee of Merck and has research support from Daiichi Sankyo, Abcuro, Verastem, Secura, and is on the Advisory Board or has equity in Ajax, Travera, AstraZeneca, Bantam. K.S. receives grant funding from Novartis and KronosBio, consults for and has stock options in Auron Therapeutics and has served as an advisor for KronosBio and AstraZeneca. D.E.R. receives research funding from members of the Functional Genomics Consortium (Abbvie, BMS, Jannsen, Merck, Vir), and is a director of Addgene, Inc. W.C.H. is a consultant for ThermoFisher, Solasta Ventures, MPM Capital, KSQ Therapeutics, Tyra Biosciences, Jubilant Therapeutics, RAPPTA Therapeutics, Function Oncology, Frontier Medicines, Hexagon Biosciences, Serinus Biosciences, Kestral Therapeutics and Calyx. The remaining authors declare no competing interests.

Figures

Fig. 1
Fig. 1. Overview of the genomic analysis of Wilms tumor samples.
Co-mutation plot representing the clinicopathological information (top panel), loss of heterozygosity and copy number analyses (middle two panels), and mutations (bottom panel) in the matched WT cell lines, PDX-derived cell lines, patient tumors, and normal cell lines and tissues where applicable. Each column represents a particular sample.
Fig. 2
Fig. 2. Overview of the transcriptomic analysis of Wilms tumor samples.
a Two-dimensional representation of RNA-seq data using uniform manifold approximation and projection (UMAP) demonstrates high concordance between TARGET (diamond, n = 205) and St. Jude primary WT (triangles, n = 80) and samples in this study (circles, n = 25). Normal tissue samples, clear cell sarcoma of the kidney, and malignant rhabdoid tumor all clustered separately. b Dot plots of normalized read counts representing the higher expression of commonly dysregulated genes (SIX2, CITED1, and XPO1) in WT in the TARGET (n = 205) and St. Jude (n = 53) datasets and this study (n = 25) with known sub-diagnosis. Blue and orange dots are samples included in this study. Black bars indicate the mean of each group.
Fig. 3
Fig. 3. XPO1 is a potential therapeutic target in Wilms tumor cells.
a Schematic outlining the methodology of CRISPR-Cas9 and RNAi functional screens. Created with BioRender.com. b RNAi suppression in three cell lines (patient-derived PEDS_0041_T1 and PDX-derived PEDS_0041_T2 cell lines are grouped together) identified 20 common genes which were critical for the survival of WT cells. CRISPR-Cas9 screens identified 24 common genes in three cell lines (patient-derived PEDS_0023_T1 and PDX-derived PEDS_0023T_T2 cell lines are grouped together), which were critical for the survival of WT cells. Seven genes overlapped between the RNAi and CRISPR-Cas9 loss-of-function screens. These seven genes can be categorized under their role in nuclear export, cell cycle, DNA damage, and apoptosis. c UCSC Treehouse transcriptional data from 12,719 samples showing expression of XPO1 in all tumor types with WT samples circled in black. Blue to red colors signify expression levels with red being the highest among this cohort. d Forest plot representing the mean IC50 of KPT-330 in the panel of WT cell lines and normal cells (ending with N). SD shown from at least two biological replicates. **P value < 0.005 from a Student’s two-tailed unpaired t test. e Immunoblots depicting the decrease in total protein levels of XPO1 and TRIP13 upon treatment with KPT-330. Data shown are representative of two biological replicates.
Fig. 4
Fig. 4. XPO1 inhibition leads to decreased viability through TRIP13 and p53 axis.
a KPT-330 and DMSO treated PEDS_0022T, PEDS1012T, and Aflac_2377 cells were subjected to cell cycle analysis following flow cytometry. Stacked bar graph representing the proportion of cells across phases of the cell cycle in at least biological replicates and 50k cells counted. Error bars represent mean ± SD. *P value < 0.05, **P value < 0.005 from a Student’s two-tailed unpaired t test. b Volcano plot representing differential gene expression between the KPT-330 and DMSO treated PEDS_0041_T1 cell line. Scattered points represent genes: the x axis is the fold change for KPT-330 vs. DMSO treated PEDS_0041_T1 cells and the y axis is the P values. Purple dots represent genes in the Hallmark G2/M Checkpoint gene set. c Gene set enrichment analysis (GSEA) enrichment score curves for the E2F and G2M hallmark pathways in the PEDS_0041_T1 cells treated with KPT-330. The green curve denotes the NES (normalized enrichment score) curve, the running sum of the weighted enrichment score in GSEA. d Deletion of TP53 significantly increased the IC50 of KPT-330 in PEDS1012T and PEDS_0022T. The fold change is based on comparison to a LacZ non-targeting control and based on biological duplicates. Error bars represent mean ± SD, **P value < 0.005 from a Student’s unpaired two-sided t test. e Change in viability using shTRIP13_1 and shTRIP13_2 across FHWT cell lines as compared to shControl and seed control (to shTRIP13_2). Error bars represent mean ± SD. *P value <0.05 from a Student’s unpaired two-sided t test. f Volcano plot showing the distribution of significant genes up or downregulated following shTRIP13. RNA-seq was performed on Aflac_2377T and PEDS_0041_T1 cell lines with shTRIP13 as compared to shControl. Biological replicates performed. The x axis is the fold change for shTRIP13 vs. shControl cells and the y axis is the adjusted P values. TRIP13 is downregulated along with CCND1. g Gene set enrichment analysis (GSEA) enrichment score curves for the E2F and G2M hallmark pathways following suppression with shTRIP13. h Number of commonly upregulated and downregulated genes seen in both KPT-330 treated or shTRIP13 treated cells. Pathways and significance of overlapping genes obtained from over-representation test.
Fig. 5
Fig. 5. Combination of doxorubicin and KPT-330 is synergistic in vitro and in vivo.
a Heatmap of synergy scores from Bliss and ZIP drug–drug interaction models between KPT-330 with vincristine, actinomycin, or doxorubicin in two FHWT cell lines. Range blue (antagonistic <−10) to red (synergy >10). Representative of at least two biological replicates for each cell line. b Mean IC50s for WT cell lines treated with doxorubicin as compared to normal kidney cells. X axis is µM. SD shown from at least two biological replicates. *P value < 0.05 from a Student’s two-sided unpaired t test. c Heatmap showing synergy scores from Bliss and ZIP drug–drug interaction models in WT with KPT-330 and doxorubicin. Range blue (antagonistic <−10) to red (synergy >10). Representative of at least two biological replicates for each cell line. d Representative 3D landscape image of the synergy score for CCLF_PEDS_0041_T2 cells treated with doxorubicin (62.5–500 nM) and KPT-330 (1.25–10 μM). e CCLF_PEDS_0041 tumor fragments were placed subcutaneously into the hind flank of NSG (NOD-SCID IL2Rgamma null) female mice. The tumor xenografts were treated with vehicle, doxorubicin, KPT-330 or the combination of doxorubicin and KPT-330 for 28 days. Log fold change of tumor volumes at day 22 were calculated as compared to time of treatment (average 114.3 mm3). **P value < 0.005, ***P value < 0.0005, ****P value <0.00005 from a Student’s unpaired two-sided t test. f Line graph depicting the tumor volume across the study days for each mouse in different treatment groups. Tumor growth was monitored until they met endpoint or the study was terminated at day 150. g Kaplan–Meier survival curves representing the probability of overall survival in the patient-derived xenografts (n = 8 per treatment group) treated with the vehicle, KPT-330, doxorubicin, and KPT-330 + doxorubicin. **P value <0.005, ****P value <0.00005.

References

    1. Nakata K, et al. Incidence of childhood renal tumours: an international population-based study. Int. J. Cancer. 2020;147:3313–3327. doi: 10.1002/ijc.33147. - DOI - PMC - PubMed
    1. Smith MA, Altekruse SF, Adamson PC, Reaman GH, Seibel NL. Declining childhood and adolescent cancer mortality. Cancer. 2014;120:2497–2506. doi: 10.1002/cncr.28748. - DOI - PMC - PubMed
    1. Spreafico F, et al. Wilms tumour. Nat. Rev. Dis. Primers. 2021;7:75. doi: 10.1038/s41572-021-00308-8. - DOI - PubMed
    1. Axt J, et al. Race disparities in Wilms tumor incidence and biology. J. Surg. Res. 2011;170:112–119. doi: 10.1016/j.jss.2011.03.011. - DOI - PMC - PubMed
    1. Siegel RL, Miller KD, Fuchs HE, Jemal A. Cancer statistics, 2021. CA Cancer J. Clin. 2021;71:7–33. doi: 10.3322/caac.21654. - DOI - PubMed

Publication types

MeSH terms