. 2024 May;629(8013):919-926.
doi: 10.1038/s41586-024-07205-6. Epub 2024 Apr 8.

Concurrent inhibition of oncogenic and wild-type RAS-GTP for cancer therapy

Affiliations

Concurrent inhibition of oncogenic and wild-type RAS-GTP for cancer therapy

Matthew Holderfield et al. Nature. 2024 May.

Abstract

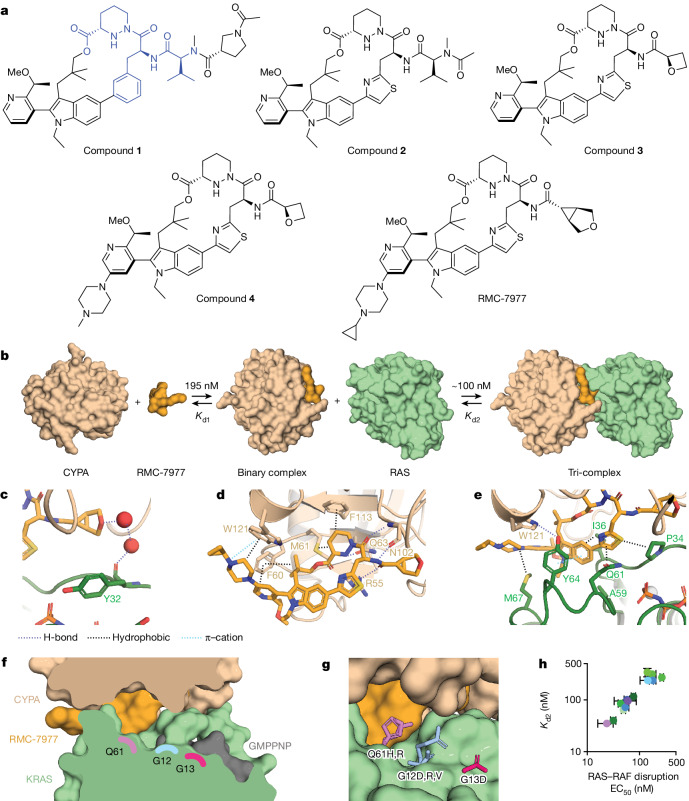
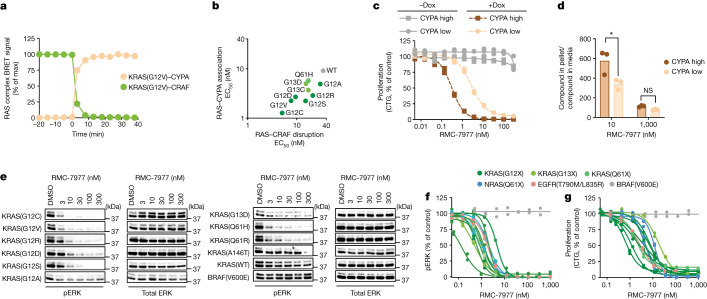
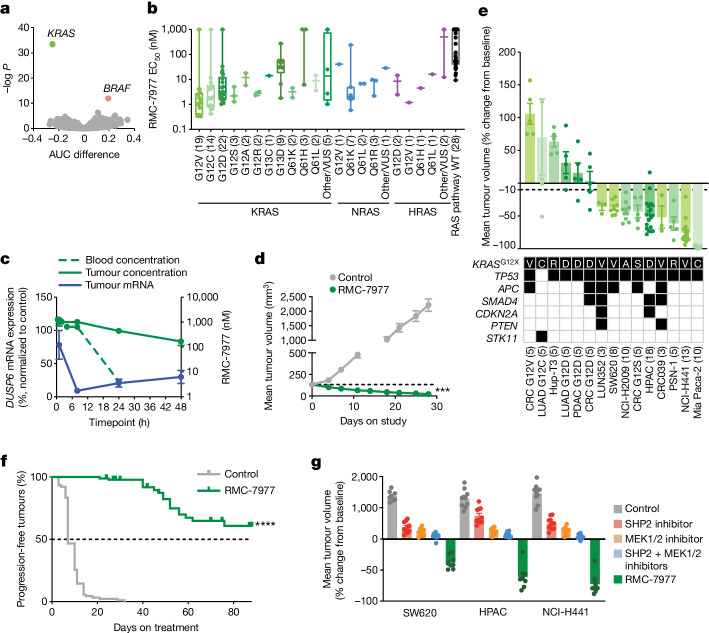
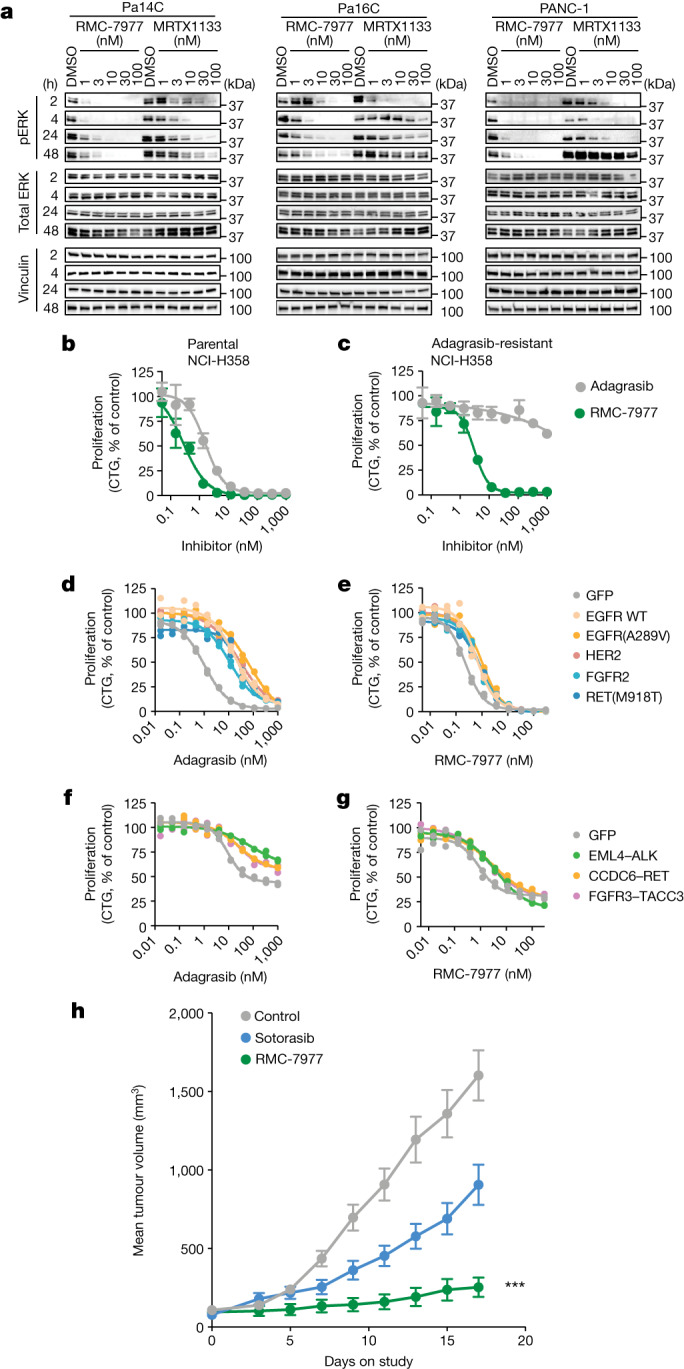
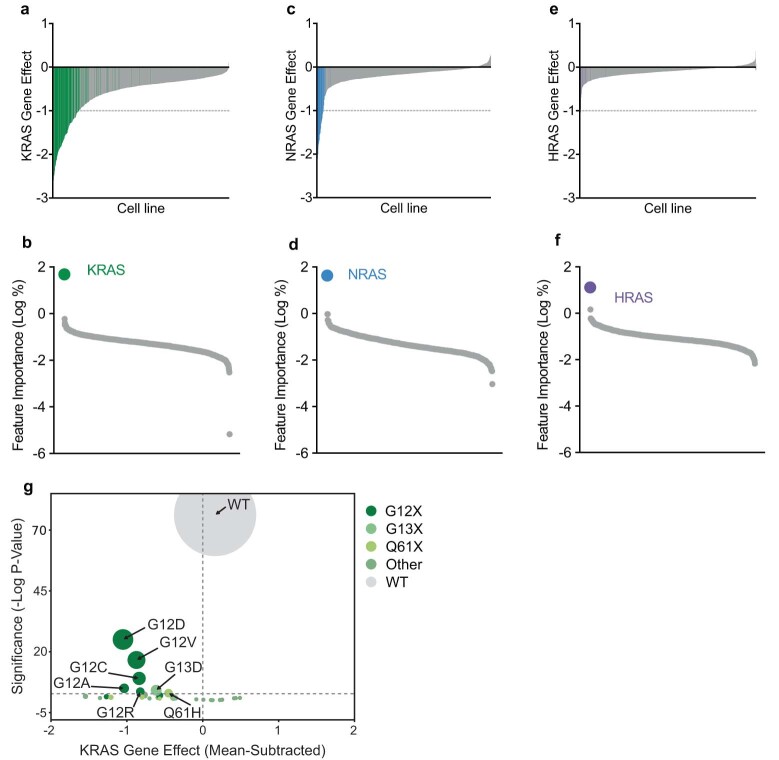
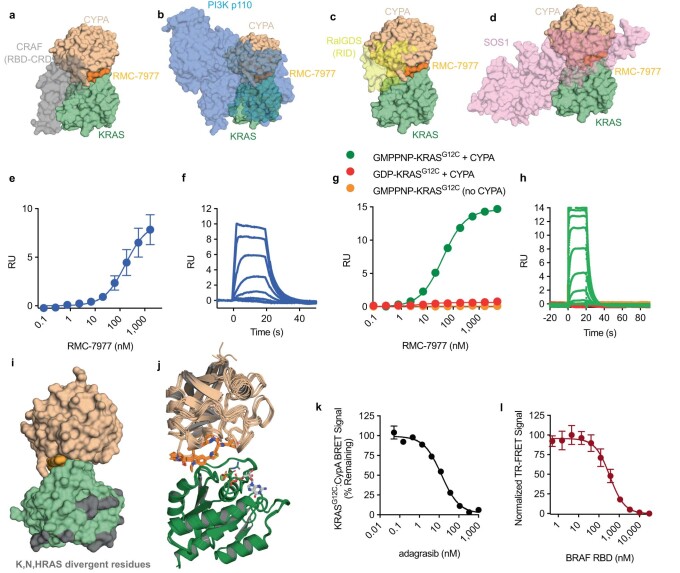
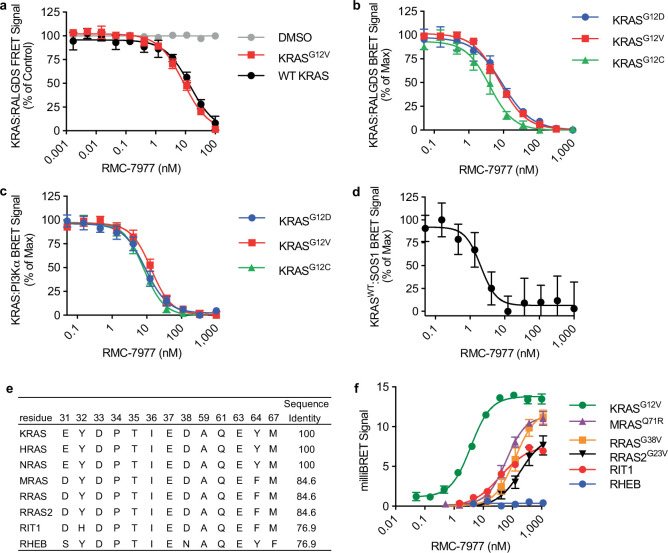
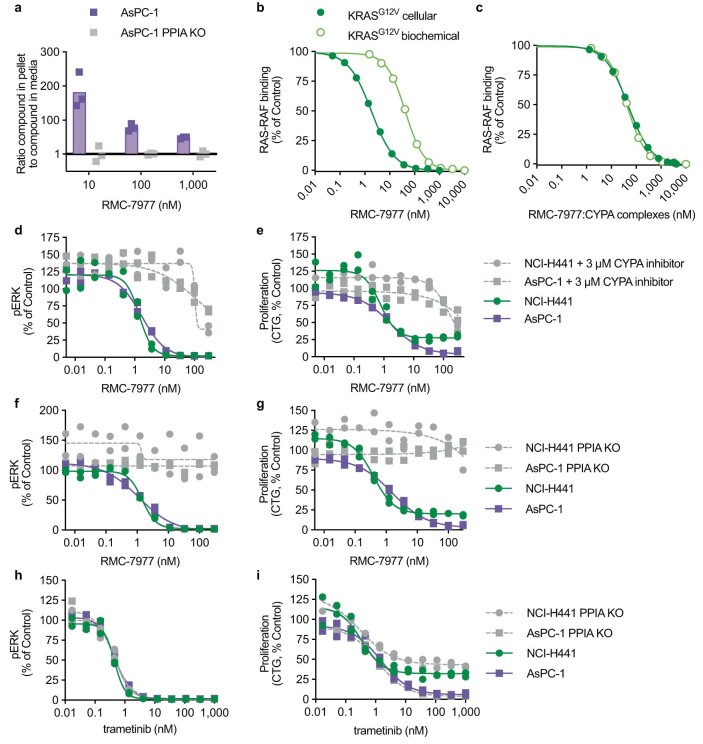
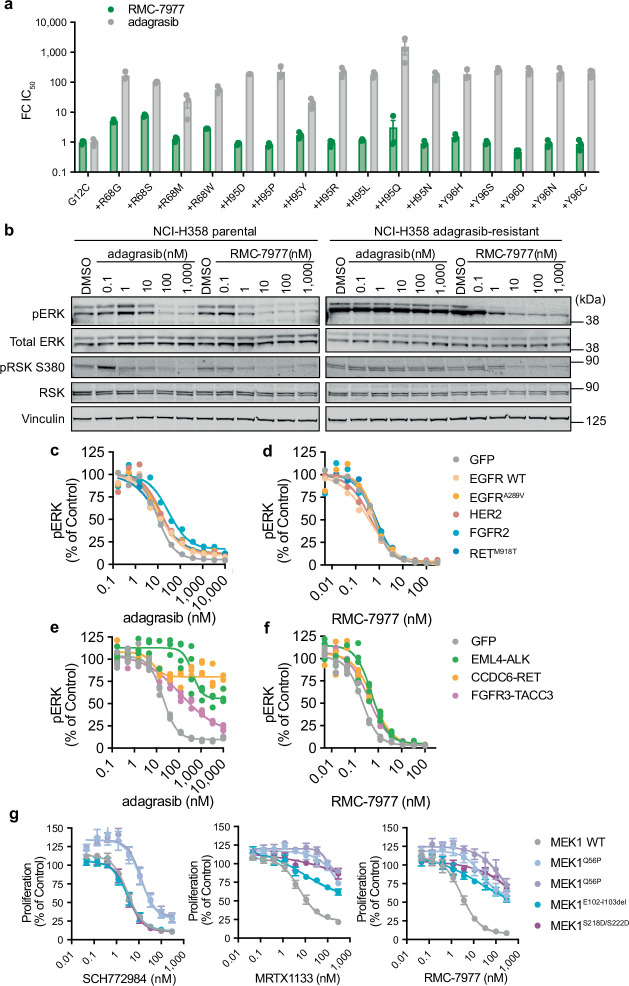
RAS oncogenes (collectively NRAS, HRAS and especially KRAS) are among the most frequently mutated genes in cancer, with common driver mutations occurring at codons 12, 13 and 611. Small molecule inhibitors of the KRAS(G12C) oncoprotein have demonstrated clinical efficacy in patients with multiple cancer types and have led to regulatory approvals for the treatment of non-small cell lung cancer2,3. Nevertheless, KRASG12C mutations account for only around 15% of KRAS-mutated cancers4,5, and there are no approved KRAS inhibitors for the majority of patients with tumours containing other common KRAS mutations. Here we describe RMC-7977, a reversible, tri-complex RAS inhibitor with broad-spectrum activity for the active state of both mutant and wild-type KRAS, NRAS and HRAS variants (a RAS(ON) multi-selective inhibitor). Preclinically, RMC-7977 demonstrated potent activity against RAS-addicted tumours carrying various RAS genotypes, particularly against cancer models with KRAS codon 12 mutations (KRASG12X). Treatment with RMC-7977 led to tumour regression and was well tolerated in diverse RAS-addicted preclinical cancer models. Additionally, RMC-7977 inhibited the growth of KRASG12C cancer models that are resistant to KRAS(G12C) inhibitors owing to restoration of RAS pathway signalling. Thus, RAS(ON) multi-selective inhibitors can target multiple oncogenic and wild-type RAS isoforms and have the potential to treat a wide range of RAS-addicted cancers with high unmet clinical need. A related RAS(ON) multi-selective inhibitor, RMC-6236, is currently under clinical evaluation in patients with KRAS-mutant solid tumours (ClinicalTrials.gov identifier: NCT05379985).


Conflict of interest statement

P.L. reports grants to his institution from Amgen, Mirati, Revolution Medicines, Boehringer Ingelheim and Virtec Pharmaceuticals. P.L. reports consulting fees or honoraria from Black Diamond Therapeutics, AmMax, OrbiMed, PAQ-Tx, Repare Therapeutics, Boehringer Ingelheim and Revolution Medicines, as well as membership on the Scientific Advisory Board of Frontier Medicines, Ikena, Biotheryx and PAQ-Tx (consulting fees and equity in each). A.J.A. has consulted for Anji Pharmaceuticals, Affini-T Therapeutics, Arrakis Therapeutics, AstraZeneca, Boehringer Ingelheim, Oncorus, Merck & Co., Mirati Therapeutics, Nimbus Therapeutics, Plexium, Revolution Medicines, Reactive Biosciences, Riva Therapeutics, Servier Pharmaceuticals, Syros Pharmaceuticals, T-knife Therapeutics, Third Rock Ventures, and Ventus Therapeutics. A.J.A. holds equity in Riva Therapeutics. C.J.D. has consulted or been an advisory board member for SKY Therapeutics, Deciphera Pharmaceuticals, Kestral Therapeutics, Mirati Therapeutics, Reactive Biosciences, Revere Pharmaceuticals, Revolution Medicines, SHY Therapeutics and Sanofi. C.A. has received research fees from Revolution Medicines, Aelin Therapeutics, Verastem, Roche and Boehringer Ingelheim. The other authors declare no competing interests.

Figures

Fig. 1
Fig. 1. RMC-7977 inhibits the active state of multiple RAS variants.
a, Compound structures. The CYPA-binding motif of compound 1 is highlighted in blue. b, Schematic of tri-complex formation showing reversible binding of RMC-7977 to CYPA (Kd1) and of the binary complex to RAS (Kd2). c, A through-water hydrogen bonding network is formed between the ether of RMC-7977 and the carbonyl of RAS Y32 (PDB ID: 8TBM). d, CYPA–RMC-7977 binding showing hydrogen bonds, involving R55, the piperazic acid moiety, F113, M61, the geminal dimethyl group, the pyridine and F60. The basic nitrogen of the piperazine forms a cation–π interaction with W121. e, Oriented by the hydrogen bond to CYPA W121, RAS Y64 forms π-stacking interactions with the pyridine and indole groups. Apolar sidechains on both SWI and SWII form hydrophobic interactions with RMC-7977. f, The tri-complex binding mode creates an open groove between CYPA, KRAS and RMC-7977 along the Q61–G12–G13 axis. g, This groove can accommodate the bulky sidechains found in oncogenic mutants, with residues Q61, G12 and G13 measuring 3.5, 7.5, and 9.7 Å, respectively, from RMC-7977 (PDB IDs: 8TBF, 8TBH, 8TBL and 8TBM). h, Correlation between Kd2 (determined by surface plasmon resonance (SPR)) and EC50 for disruption of RAS–RAF binding in vitro for wild-type and oncogenic RAS mutant proteins. Data are mean ± s.d. of independent experiments (KRAS variants (green): wild-type (WT) KRAS, n = 4; KRAS(G12C), KRAS(G12D), KRAS(G12R), KRAS(G12V), KRAS(G13D), n = 6; NRAS variants (blue): NRAS(WT), NRAS(Q61L), n = 4; NRAS(Q61K), NRAS(Q61R), n = 6; HRAS variants (purple): HRAS(WT), n = 5; HRAS(G13R), n = 6; slope = 0.99, 95% confidence interval: 0.8–1.2, R2 = 0.99; values also shown in Extended Data Tables 1–3). Source Data
Fig. 2
Fig. 2. RAS inhibition is CYPA-dependent and active against multiple RAS variants.
a,b, Formation of KRAS–CYPA complexes and disruption of the KRAS(G12V)–CRAF interaction in U2OS cells as a time course after 50 nM RMC-7977 treatment, expressed as % of the maximum (max) signal (a), and correlation between potency of RAS–RAF inhibition and formation of the tri-complex for multiple KRAS variants (R2 = 0.7) (b). Data points are single nano-BRET measurements representative of three independent experiments. c, Proliferation (measured by CellTiter-Glo (CTG) assay) of NCI-H358 cells with doxycycline (Dox)-inducible expression of low or high CYPA levels treated with RMC-7977 for 120 h. Data points show biological duplicates normalized to vehicle control. Representative data from one of three independent experiments. d, Liquid chromatography–mass spectrometry measurements of the ratio of RMC-7977 concentration in CYPA-high and CYPA-low NCI-H358 cells to the concentration in the medium with 1 h compound treatment. Bars depict the mean of biological triplicates from one of two replicate experiments (P = 0.012, one-way analysis of variance (ANOVA) with post hoc Tukey’s test). e, Western blots of isogenic MEF cells expressing the indicated KRAS variant or BRAF(V600E) and treated with RMC-7977 or DMSO for 24 h. Data are representative of three independent experiments. f,g, pERK (AlphaLISA) (f) and proliferation (CTG assay) (g) levels of human cancer cell lines with G12 (Capan-1, SW620, AsPC-1, HPAC, NCI-H358, PSN1 and HUPT3), G13 (HCT 116) or Q61 (Hs 766T) mutant KRAS; Q61-mutant NRAS (SK-MEL-30 and KU1919); mutant EGFR (NCI-H1975); or BRAFV600E (A375), treated with RMC-7977 for 4 h. Data points show biological duplicates normalized to vehicle control from 1 of 2–26 independent experiments. Source Data
Fig. 3
Fig. 3. RMC-7977 is broadly active in RAS-addicted cancer models.
a, Relationship between the area under the curve (AUC) difference (see Supplementary Methods) and negative log-transformed P value (two-sided Wilcoxon test) between cell lines by genotype. Points represent mutated genes. Negative AUC indicates sensitivity; positive AUC indicates resistance. b, RMC-7977 EC50 according to KRAS genotype. Each dot represents a cell line. The centre line is the median, box limits represent first and third quartiles and whiskers depict the range. The number of cell lines in each group is indicated in parentheses. VUS, variants of unknown significance. c, Blood and tumour concentrations of RMC-7977 (green) and DUSP6 mRNA (blue) for NCI-H441 xenograft tumours following one oral dose of 10 mg kg−1 RMC-7977. Data are mean ± s.e.m. of three biological replicates. d, Mice bearing NCI-H441 CDX tumours treated with 10 mg kg−1 RMC-7977 orally once daily for 28 days. ***Adjusted P value = 0.0002; two-way ANOVA (n = 8 mice per group) with multiple comparison Dunnett’s test. The dashed line shows the initial average tumour volume. Data are mean ± s.e.m. for eight mice per group. e, KRAS(G12X) xenograft models treated with RMC-7977 (10 mg kg−1 by oral administration) for 4–6 weeks. Data are mean ± s.e.m. of 3–18 mice per group. One data point for LUAD G12C is beyond the axis range. Shaded boxes in the table indicate gene variants. f, Kaplan–Meier analysis of time to tumour size doubling (n = 90 mice per group) of KRASG12X mutant models treated with 10 mg kg−1 RMC-7977 orally once daily. g, CDX models treated with vehicle control, SHP2 inhibitor (20 mg kg−1 RMC-4550 orally every 2 days), MEK inhibitor (2.5 mg kg−1 cobimetinib orally once daily), combined SHP2 and MEK inhibitors (20 mg kg−1 RMC-4550 orally every 2 days and 2.5 mg kg−1 cobimetinib orally once daily), or 10 mg kg−1 RMC-7977 orally once daily. NCI-H441 (KRASG12V, NSCLC) and HPAC (KRASG12D, PDAC) models were treated for 21 days. SW620 (KRASG12V, CRC) was treated for 28 days. Data are mean ± s.e.m.; n = 8 mice per group for control and RMC-7977, and n = 10 mice per group for RMC-4550, cobimetinib, and RMC-4550 + cobimetinib. Source Data
Fig. 4
Fig. 4. RMC-7977 can overcome resistance to mutant-selective KRAS inhibition.
a, Western blots showing the time course of RAS signalling in KRASG12D PDAC cell lines treated with RMC-7977, MRTX1133 or DMSO control. Total ERK and vinculin were used as loading controls. Data are representative of two similar experiments. b,c, Parental NCI-H358 cells (KRASG12C, NSCLC) (b) and adagrasib-resistant NCI-H358 cells with a secondary NRASQ61K mutation (c) were treated with adagrasib or RMC-7977 for 5 days and proliferation was measured by CTG assay. d,e, NCI-H358 (KRASG12C, NSCLC) cells expressing exogenous RTK DNA constructs as indicated (GFP control, wild-type EGFR, EGFR(A289V), HER2, FGFR2 or RET(M918T)) were treated with adagrasib (d) or RMC-7977 (e) for 120 h, and proliferation was measured by CTG assay. f,g, MIA PaCa-2 (KRASG12C, PDAC) cells expressing exogenous RTK fusion DNA constructs as indicated (GFP control, EML4–ALK, CCDC6–RET or FGFR3–TACC3) were treated with adagrasib (f) or RMC-7977 (g) for 120 h, and proliferation was measured by CTG assay. dg, Biological duplicates normalized to vehicle control are shown from one of 2–5 independent experiments. h, Patient-derived xenograft model established from a patient with KRASG12C NSCLC who developed resistance after sotorasib. Mice were treated with vehicle (n = 7), sotorasib (50 mg kg−1 orally once daily; n = 7), or RMC-7977 (10 mg kg−1 orally once daily; n = 10). Tumour volumes were assessed for 17 days after treatment started. ***Adjusted P value = 0.0001 for RMC-7977 versus control group; repeated measures two-way ANOVA adjusted based on multiple comparison via Dunnett’s test on the final tumour measurement. Data are mean ± s.e.m. n refers to the number of mice in each group. Source Data
Extended Data Fig. 1
Extended Data Fig. 1. Relationship between RAS gene effect and RAS mutation.
a,c,e, Barplots ordered by KRAS (a), NRAS (c), or HRAS (e) CHRONOS score (CRISPR knockout gene effect from https://depmap.org). Each bar represents a cell line. KRAS, NRAS or HRAS mutant cells colored green, blue, or purple respectively. b,d,f, Gene mutation features from trained Random Forest regression model mapping gene mutation status to gene effect. Datapoints represent mutated genes, ordered by importance for the gene effect in each plot. Y-axis indicates the genetic feature importance for KRAS (b), NRAS (d), or HRAS (f) gene effect (see Methods). g, Mean KRAS Chronos score for each KRAS genotype is shown, with the mean effect score across all cell lines subtracted. P-values were calculated by a two-sided Wilcoxon rank sums test comparing the distribution of genotype effect to the distribution of effect scores outside of that genotype (Bonferonni-corrected p-value of 0.05/31 = 0.0016 indicated by a gray horizontal line, 31 KRAS genotypes tested, point size is proportional to sample size of each genotype, see methods). Source Data
Extended Data Fig. 2
Extended Data Fig. 2. RMC-7977 biophysical and structural characterization.
a,b,c,d, Superimposition of the CYPA:RMC-7977:KRAS wild-type (WT) tri-complex structure (PDB: 8TBF) with KRAS:CRAF RBD-CRD complex (a, PDB: 6XI7), HRAS:PIK3 CD (b, PDB: 1HE8), HRAS:RALGDS (c, PDB: 1LFD), or KRAS:SOS1 REM-CDC25 (d, PDB: 1XD2). Note steric clashes caused by CYPA occupying the Switch I and II motif of KRAS. e,f, Steady state (e) and kinetic sensorgram (f) of RMC-7977 and CYPA binding measured by SPR response units (RU). g,h, Steady state (g) and kinetic sensorgram (h) of RMC-7977 binding to KRASG12C measured by SPR. Measurements taken in the presence or absence of CYPA, and GMPPNP or GDP nucleotides. e,g, Datapoints represent mean ±s.d. of 3 biological replicates. i, RAS interacts with CYPA and RMC-7977 through the conserved effector lobe. Isoform divergent residues are distal from the site of interaction, allowing pan-isoform inhibition. j, Alignment of wild-type HRAS, wild-type NRAS, and KRASG12X (A, C, D, R, S, V) mutant tri-complexes shows functionally identical binding modes to the CYPA:RMC-7977 binary complex. 12th position mutant sidechains shown as sticks (PDB: 8TBF, 8TBG, 8TBH, 8TBI, 8TBJ, 8TBK, 8TBL, 8TBM, 8TBN). k, Tri-complex formation assay (KRASG12C:RMC-7977:CYPA binding in U2OS cells) in the presence of 100 nM RMC-7977 and the indicated concentration of adagrasib, normalized to the expected min. (100 nM RMC-7977, no adagrasib) and max. (0 nM RMC-7977, no adagrasib) BRET signal. Cells were treated with inhibitor for 4 h. Datapoints represent mean ±s.d. of 6 biological replicates. l, Time resolved-FRET between recombinant KRASG12V and CYPA in the presence of RMC-7977 (50 nM of each) treated with the indicated concentrations of recombinant BRAF RBD, normalized as % of DMSO (EC50 = 357 nM, 95% CI = 270-505 nM). n = 3 biological replicates, plotted as mean ±s.d. normalized to control. Source Data
Extended Data Fig. 3
Extended Data Fig. 3. RAS effector inhibition and tri-complex selectivity.
a, Recombinant KRAS and the RALGDS RID treated with the indicated concentrations of RMC-7977 and CYPA (KRASG12V IC50 = 8 nM, WT KRAS IC50 = 14 nM, points represent mean ±s.d. of 4 replicates) b,c,d, Cellular nano-BRET assays for multiple RAS-binding proteins, including full length RALGDS (b), full length PI3Kα (c) binding to KRAS G12C, G12D, and G12V, and the catalytic domain of SOS1 (d) binding to KRAS WT. U2OS cells were treated with RMC-7977 for 1 h. Points represent mean ±s.d. of 6 replicates e, Sequence identity analysis of related GTP-ase proteins using KRAS residues positioned within 4 angstroms of RMC-7977 in the tri-complex co-structures as a reference sequence. f, Cellular miliBRET signal between CYPA and 5 different small GTPase proteins with moderate to high homology to the KRAS tri-complex interface (RIT1, MRAS, RRAS, RRAS2, and Rheb) treated with RMC-7977. MRAS, RRAS and RRAS2 oncogenic mutants used to induce the active, GTP-bound state. Points represent mean ±s.d. of 6 biological replicates. Source Data
Extended Data Fig. 4
Extended Data Fig. 4. Cellular concentration of CYPA determines the cellular concentration of binary complex.
a, Ratio of RMC-7977 concentration in cells to concentration in media following exposure of parental or PPIA KO AsPC-1 cells to indicated concentrations of RMC-7977 for 1 h as determined by LC/MS bioanalysis. Bars represent mean of the 3 biological replicates shown from one experiment. b, RMC-7977 concentration response for biochemical (points are the mean of biological duplicates from one of 6 independent experiments) and cellular (3 independent experiments) nano-BRET KRASG12V-RAF disruption. Data shown are representative of independent replicates. c, same data as b, with calculated concentration of active binary complexes. Correction is based on equation 1: binary complex=CYPAcellRMC7977unboundKD1+RMC7977unbound. This calculation assumes the extracellular volume is much greater than the intracellular volume and that the concentration of unbound RMC-7977 ([RMC-7977]unbound) equilibrates between intracellular and extracellular space. A value of 5 µM was used for the cellular CYPA concentration ([CYPA]cell). No adjustment was applied to the biochemical data because under experimental conditions >99% of RMC-7977 is bound to CYPA. d-i, pERK levels (MSD) (d,f,h) and cell proliferation (CTG) (e,g,i) in AsPC-1 and NCI-H441 cells treated with RMC-7977 or trametinib for 4 h. RMC-7977 co-treatment with a CYPA inhibitor (d,e) or PPIA KO (f,g) rescued pERK and proliferation in RMC-7977 treated cells, but did not affect response to trametinib (h,i). Representative data from one of 2 (NCI-H441) or 3 (AsPC-1) independent experiments are shown. Source Data
Extended Data Fig. 5
Extended Data Fig. 5. CYPA is required for cellular activity.
a, Cellular CYPA protein levels determined by parallel reaction monitoring (PRM) mass spectrometry in NCI-H358 cells harboring doxycycline-inducible expression of low or high CYPA in the absence or presence of doxycycline (0.1 µg/ml) for 120 h. Bars indicate the mean of 3 biological replicates per group from one experiment. b, pERK levels (MSD) of CYPA high and CYPA low cells treated with RMC-7977 in the absence or presence of doxycycline (0.1 µg/ml) for 120 h. Datapoints show biological duplicates normalized to vehicle control. Representative data shown from one of 3 independent experiments. c, Cellular CYPA protein concentration in a panel of cell lines determined by PRM. Data 2 stable isotope labeled peptide standards (SIS) was averaged for each replicate. Intracellular µM concentration estimated assuming cell volume of 2 pl. Bars indicate the mean of biological duplicates. d, CYPA protein expression in cells (green bars) and corresponding xenograft tumours (blue bars) determined by PRM. 5 SIS peptides were used and data averaged for each biological replicate. Bars indicate the mean of biological duplicates for HPAC cells and triplicates for all others. e, PRISM screen, RMC-7977 sensitivity (AUC) by PPIA gene expression (RPKM). Each dot represents a cell line (n = 606). Two-sided Pearson correlation = −0.10 (p = 0.011). Source Data
Extended Data Fig. 6
Extended Data Fig. 6. Inhibition of RAS signal transduction pathways.
a, Western blots of isogenic RAS-less MEF cell lines harboring an exogenous, wild-type (WT) or mutant KRAS, or BRAFV600E transgene, treated with indicated concentrations of trametinib or DMSO control for 24 h. Data shown are representative of 3 independent experiments. b,c, Western blots of KRAS mutated cell lines treated with RMC-7977 at indicated concentrations for 4 h (b), or treated with RMC-7977 (100 nM) or DMSO control for indicated time points. c, Data shown are representative of 2 independent experiments. Source Data
Extended Data Fig. 7
Extended Data Fig. 7. RMC-7977 sensitivity by genotype.
a,b, AUC difference (x-axis) and significance (y-axis, two-sided Wilcoxon) between cell lines by genotype. Each point represents a mutated gene. Negative AUC implies increased sensitivity. NRAS correlation shown in (a) was only evident when KRAS mutants were removed, likely due to the disproportionately larger number of KRAS mutant cell lines. The dataset in (b) excluded both KRAS and NRAS mutants. A small sampling of only 22 HRAS mutants with RMC-7977 activity data was insufficient to determine a statistically significant correlation with HRAS dependence. c, PRISM data highlighting BRAF Class I mutations are strongly activating monomers; Class II mutations are moderately activating dimers; Class III are kinase impaired; NC are BRAF mutated but have not been classified as I, II, or III; KRAS, NRAS, or HRAS co-mutation status indicated as with + or - for each group (c). RMC-7977 EC50 (CTG) shown as a function of mutated KRAS codon (d). KRAS gene effect (CHRONOS score from http://depmap.org) plotted as a function KRAS genotype. Dotted lines indicate no proliferation effect and inhibition of cell growth (0 and −1 respectively) (e). RMC-7977 EC50 (CTG) shown as a function of RAS pathway activating mutation. Median EC50: RTKMUT/fusion (6.14 nM), METAMP (6.61 nM), NF1LOF (32.5 nM), PTPN11MUT (7.95 nM), BRAFMUT Other (75.4 nM), BRAFV600E ( > 1 µM), RAS pathway wild-type (WT) (71.5 nM). RAS pathway WT represents cell lines without KRAS, NRAS, HRAS, BRAF or the aforementioned genetic alterations (f). c,d,e,f, Points represent cell lines; centre line is the median; box limits depict quartiles; whiskers represent range (n = 3-862 cell lines per genotype). Source Data
Extended Data Fig. 8
Extended Data Fig. 8. RMC-7977 PKPD, tumour volumes, and body weights of tumour bearing mice.
a, Pharmacokinetic (PK) relationship to pharmacodynamic (PD) marker (DUSP6) levels. RMC-7977 tumour concentrations and percentage of DUSP6 inhibition in tumour following single oral administration in NCI-H441 (KRASG12V, NSCLC) tumour bearing BALB/c nude mice. All datapoints shown, n = 3 per dose and timepoint. EC50 = 130 nM and an EC90 = 1,450 nM depicted by horizontal dotted lines, with a maximal level of inhibition near 100% relative to control. b, Table of blood and tumour PK parameters of RMC-7977 following single oral administration of RMC-7977 in NCI-H441 tumour bearing BALB/c nude mice. Whole blood and tumour concentrations of RMC-7977 were determined using liquid chromatography-tandem mass spectrometry (LC-MS/MS). PK parameters were calculated by non-compartmental analysis (Phoenix WinNonlin). c, Percent tumour volume change and percent body weight change of tumour bearing BALB/c nude mice following repeated oral administration of either vehicle control or RMC-7977 at 10 mg/kg. Treatments were administered daily for 7 days per week except for CRC G12V, LUAD G12D, CRC G12S, LUAD G12C, and PDAC G12D, which were all treated once daily for 5 days of treatment followed by 2 days of treatment cessation every week. Tolerability defined as body weight loss <20%. n = 3–28 mice per group, datapoints represent mean ±s.e.m. normalized to initial (day 0, depicted as a horizontal dotted line) measurements. Source Data
Extended Data Fig. 9
Extended Data Fig. 9. T cell response in both naïve and tumour-bearing immunocompetent mice treated with RMC-7977.
a,b, C57BL/6 J mice were vaccinated with 1×10⁶ OVA peptide (SIINFEKL)-pulsed BMDCs on day 0 and day 8. Mice were treated with 25 mg/kg RMC-7977 or vehicle PO daily starting one day before vaccination (day −1). Mice were euthanized on day 15 after treatment start, and spleens were harvested and assessed for frequency of antigen specific (H-2Kb SIINFEKL tetramer positive) CD8 + T cells by flow cytometry (a) and for IFNγ production by ELISpot. Quantification shown in (b). Each bar represents mean ±s.e.m; each dot represents an individual mouse. n = 3-4 mice/group; ns=not significant (unpaired two-sided Student’s t test). c,d,e, Levels of immune cells, CD8 + T cells, and tumour antigen (AH1) specific CD8 + T cells in murine colon carcinoma CT26 syngeneic tumours, engineered to express KRASG12C, at 24 h post 4 days of treatment with RMC-7977 at 25 mg/kg PO QD shown as percentage of Live (c), CD45+ (d), and CD8+ cells (e), n = 4 mice per group, bars represent mean ± s.e.m, * p = 0.0286; ** p = 0.0079; **** p = 0.000006 by unpaired two-sided Student’s t test. Source Data
Extended Data Fig. 10
Extended Data Fig. 10. RASMULTI inhibition overcomes G12C inhibitor resistance mechanisms.
a, Cellular nano-BRET assay showing fold-change IC50 of disrupting the KRAS:CRAF interaction in U2O2 cells expressing KRASG12C alone or with the indicated secondary mutation in the SWII domain and treated with RMC-7977 or adagrasib for 4 h. Bars represent mean of n = 3 biological replicates ±s.e.m. b, Western blots of parental NCI-H358 (KRASG12C, NSCLC) and an adagrasib resistant clone of NCI-H358 cells with a secondary NRASQ61K mutation. Cells were treated with adagrasib or RMC-7977 for 4 h. c,d, pERK levels (MSD) in NCI-H358 (KRASG12C, NSCLC) cells expressing exogenous RTK DNA constructs indicated by color (GFP control, EGFRWT EGFRA289V, HER2, FGFR2, or RETM918T, treated with adagrasib (c) or RMC-7977 (d) for 24 h. e,f, pERK levels (MSD) in MIA PaCa-2 (KRASG12C, PDAC) cells expressing exogenous RTK fusion DNA constructs indicated by color (GFP control, EML4-ALK, CDC6-RET, FGFR3-TACC3), treated with adagrasib (e), or RMC-7977 (f) for 24 h. n = 2–4 biological replicates per group, normalized to control. Data shown are representative of independent experiments (NCI-H358 n = 3, MIA PaCa-2: n = 2). g, Pa16C (KRASG12D, PDAC) cells expressing exogenous MEK1 mutant DNA constructs were treated with the indicated inhibitors for 120 h, and proliferation was measured by Calcein AM. n = 3–5 biological replicates from a single experiment, datapoints represent mean ± s.e.m normalized to control. Source Data

Comment in

  • New route to target RAS.
    Villanueva MT. Villanueva MT. Nat Rev Drug Discov. 2024 Jun;23(6):418. doi: 10.1038/d41573-024-00082-8. Nat Rev Drug Discov. 2024. PMID: 38730259 No abstract available.

References

    1. Simanshu DK, Nissley DV, McCormick F. RAS proteins and their regulators in human disease. Cell. 2017;170:17–33. doi: 10.1016/j.cell.2017.06.009. - DOI - PMC - PubMed
    1. Cox AD, Fesik SW, Kimmelman AC, Luo J, Der CJ. Drugging the undruggable RAS: mission possible? Nat. Rev. Drug Discov. 2014;13:828–851. doi: 10.1038/nrd4389. - DOI - PMC - PubMed
    1. Moore AR, Rosenberg SC, McCormick F, Malek S. RAS-targeted therapies: is the undruggable drugged? Nat. Rev. Drug. Discov. 2020;19:533–552. doi: 10.1038/s41573-020-0068-6. - DOI - PMC - PubMed
    1. Lee, J. K. et al. Comprehensive pan-cancer genomic landscape of KRAS altered cancers and real-world outcomes in solid tumors. npj Precis. Oncol.6, 91 (2022). - PMC - PubMed
    1. Malumbres M, Barbacid M. RAS oncogenes: the first 30 years. Nat. Rev. Cancer. 2003;3:459–465. doi: 10.1038/nrc1097. - DOI - PubMed

MeSH terms

Associated data