. 2024 Aug;31(8):1189-1197.
doi: 10.1038/s41594-024-01263-0. Epub 2024 Apr 8.

Structure of adenylyl cyclase 5 in complex with Gβγ offers insights into ADCY5-related dyskinesia

Affiliations

Structure of adenylyl cyclase 5 in complex with Gβγ offers insights into ADCY5-related dyskinesia

Yu-Chen Yen et al. Nat Struct Mol Biol. 2024 Aug.

Abstract

The nine different membrane-anchored adenylyl cyclase isoforms (AC1-9) in mammals are stimulated by the heterotrimeric G protein, Gαs, but their response to Gβγ regulation is isoform specific. In the present study, we report cryo-electron microscope structures of ligand-free AC5 in complex with Gβγ and a dimeric form of AC5 that could be involved in its regulation. Gβγ binds to a coiled-coil domain that links the AC transmembrane region to its catalytic core as well as to a region (C1b) that is known to be a hub for isoform-specific regulation. We confirmed the Gβγ interaction with both purified proteins and cell-based assays. Gain-of-function mutations in AC5 associated with human familial dyskinesia are located at the interface of AC5 with Gβγ and show reduced conditional activation by Gβγ, emphasizing the importance of the observed interaction for motor function in humans. We propose a molecular mechanism wherein Gβγ either prevents dimerization of AC5 or allosterically modulates the coiled-coil domain, and hence the catalytic core. As our mechanistic understanding of how individual AC isoforms are uniquely regulated is limited, studies such as this may provide new avenues for isoform-specific drug development.


Conflict of interest statement

Competing interests

The authors declare that they have no competing interests.

Figures

Extended Data Extended Data Figure 1.
Extended Data Extended Data Figure 1.. Purification and characterization of AC5.
(A) AC5 was purified using anti-FLAG M2 affinity resin and analyzed by Coomassie blue stained SDS-PAGE. The AC activity of purified AC5 was determined in the presence of 10 mM MgCl2, 0.5 mM ATP at the indicated concentrations of (B) forskolin or (C) Gαs·GTPγS. The data shown are the mean ± SD (n=3).
Extended Data Fig 2.
Extended Data Fig 2.. Activation of AC5 by Gβγ and purification of an AC5–Gβγ complex.
(A) AC activity of purified AC5 was determined in the presence of 10 mM MgCl2 and 0.5 mM ATP with or without 250 nM Gαs·GTPγS, in the absence (formula image) or presence (formula image) of 400 nM Gβ1γ2. Data presented are the mean ± SD. (B) The AC5–Gβγ complex was purified using anti-FLAG M2 affinity resin and injected onto a Superose 6 Increase 3.2/300 column equilibrated with 50 mM HEPES pH 8, 100 mM NaCl, 10 mM MgCl2, and 0.01 % LMNG. Peak fractions highlighted in pink were pooled, concentrated, and (C) analyzed by SDS-PAGE (note that Gγ2 runs off the gel).
Extended Data Figure 3.
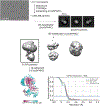
Extended Data Figure 3.. Cryo-EM data processing workflow and resolution analysis of the AC5–Gβγ complex.
The workflow, including a representative micrograph, 2D class averages (box size = 256 Å, mask = 180 Å), local resolution map, and Fourier shell correlation (FSC) curves calculated from two independent reconstructions by CryoSPARC. The nominal resolution of the resulting map, as defined by the 0.143 cutoff, is indicated by the horizontal blue line.
Extended Data Figure 4.
Extended Data Figure 4.. Binding mode of the AC5–Gβγ complex predicted by AlphaFold Multimer and comparison with other Gβγ complexes.
(A) The docked model of AC5–Gβγ complex determined in this study (left, PDB entry 8SL3) and that predicted by AlphaFold Multimer (right). For comparison, some other Gβγ complexes are shown, including (B) Gα (PDB entry 1GOT), (C) GRK2 (PDB entry 6U7C), and (D) Prex-1 (PDB entry 6PCV) in complex with Gβγ. The red highlighted region in each structure contacts the central core “hotspot” of Gβ close to or centered at Trp99.
Extended Data Figure 5.
Extended Data Figure 5.. Purified AC5 and Gβγ variants used in this study.
The purity of AC5 and Gβγ variants was assessed using Coomassie blue stained SDS-PAGE (Gγ at 7.5 kDa runs off the gel).
Extended Data Figure 6.
Extended Data Figure 6.. Cryo-EM analysis of various AC5 samples described in this manuscript.
Representative micrographs and 2D class averages are shown for each sample. Note that homodimers (yellow boxes) are only observed in GDN regardless of activation status.
Extended Data Figure 7.
Extended Data Figure 7.. Sample preparation and cryo-EM data processing workflow of the AC5–Gβγ–Gαs complex.
A presumptive AC5–Gβγ–Gαs complex was purified using Anti-FLAG antibody pulldown and analyzed by SDS-PAGE with Coomassie blue staining (top left). Cryo-EM data processing workflow includes a representative micrograph, 2D class averages (box size = 324 Å, mask = 200 Å for AC5–Gβγ on the left and 180 Å for dimeric AC5 on the right), and reconstructed 3D models. The dataset reveals two distinct populations, with one corresponding to the AC5–Gβγ monomer (bottom left) and the other an AC5 dimer containing density corresponding to Gαs subunits (bottom right). Below the dimeric AC5 map, the central slice is displayed in two directions. Note that the 3×4 array of TM helices line up in the slice on the right into three vertical lines in each subunit, consistent with the above cartoon. The scale bar of the heat map indicates arbitrary units of density obtained from the particle images.
Extended Data Figure 8.
Extended Data Figure 8.. Characterization of Purified AC5 in LMNG and GDN micelles.
(A) Coomassie blue stained SDS-PAGE showing purified AC5 reconstituted in either LMNG or GDN. (B) AC activity (mean ± SD) of purified AC5 reconstituted in LMNG (formula image) or GDN (formula image) was determined in the presence of 10 mM MgCl2 and 0.5 mM ATP. (C) Gαs and (D) Gβγ dose-response curve for AC5 reconstituted in LMNG (formula image) or GDN (formula image). AC5 activity was determined in the presence of 10 mM MgCl2, 0.5 mM ATP at the indicated Gαs concentration or 100 nM Gαs·GTPγS at the indicated Gβγ concentrations, with data presented as mean ± SD (n=3).
Extended Data Figure 9.
Extended Data Figure 9.. Sequence alignment of the C1b region.
Residue similarities are colored according to the BLOSUM62 score. Secondary structures of the primary sequence for the AC5 structure here are displayed on top, and the AlphaFold2 predicted model for the C1b region in AC5 is shown at the bottom as a reference for the named helices. The predicted “PFAHL” Gβγ binding site in AC2 is highlighted in an orange box. Residues modelled in contact with Gβγ in the AC5–Gβγ complex (PDB entry 8SL3) are drawn in red color.
Extended Data Figure 10.
Extended Data Figure 10.. Comparison of mAC structural features.
(A) Domain architecture of mAC isoforms. (B) Sequence alignment of the N-α3 helix among mAC isoforms, with secondary structure from AC5 indicated above. (C) Comparison of a predicted binding pocket in the extracellular domain of AC5 and AC8, with the residues predicted to form the binding pocket highlighted in red in both the cartoon (left) and surface (middle) representations. Additionally, the electrostatic potential is shown (right), highlighting the negatively charged surface of the extracellular domain. (D) Superposition of AC5 (PDB entry 8SL3) and AC9 (PDB entry 6R3Q), revealing similar organization of the 12 TM helices (with the extracellular domain of AC5 removed for clarity, left) but subtle differences in the coiled-coil domain (right). (E) Overlay of AC5 (PDB entry 8SL3) and AC9 (PDB entry 6R3Q) suggests the potential simultaneous binding of Gαs and Gβγ to the catalytic core. (F) AlphaFold multimer prediction of the AC5–Gαs–Gβγ complex. The C1b-α2 helix is highlighted in red in both (E) and (F).
Figure 1.
Figure 1.. Characterization of AC5 and its complex with Gβγ.
(A) Schematic of a typical mAC. TM: transmembrane domain; C1a, C1b, C2a, C2b: cytosolic domains; PM: plasma membrane. C2b is only 7 residues long in AC5. (B) Activation of AC5 by Gβγ. AC activity of purified AC5 was determined in the presence of 10 mM MgCl2, 0.5 mM ATP, and 100 nM Gαs·GTPγS at the indicated Gβγ concentrations. Data are the mean ± SD from three independent experiments. (C) AC activity of purified AC5 was determined in the presence of 10 mM MgCl2, 0.5 mM ATP with or without 400 nM Gβγ at the indicated Gαs concentrations. Data shown are the mean ± SD from three independent experiments. (D) Map and (E) corresponding atomic model for the AC5–Gβγ complex. Density for the catalytic core is however uninterpretable, indicating that it is not fixed relative to the coiled-coil domain. The O-methylcysteine and geranylgeranyl group at the C-terminus of Gγ, and predicted disulfide bonds in the extracellular domain are depicted as spheres, although there is no significant density for these modifications in the reconstruction. (F) Elements of the N-terminal domain. Density for the N-α3 helix and the linker between N-α2 and N-α3 is clearly visible. The N-α2 helix density merges with the micellar boundary, consistent with the presence of a high probability palmitoylation site at Cys208 (red sphere). (G) Region of C1b wrapping around the micellar surface with the side chains of Phe740, Leu741, and Ser754 shown as spheres. Density is shown as blue mesh in panels F and G. (H) Sequence alignment of the linker between C1b-α5 and C1b-α6, with residues Phe740 and Leu741 in AC5 highlighted in red.
Figure 2.
Figure 2.. The AC5–Gβγ interface.
(A) EM model of the AC5–Gβγ complex, with AC5 shown mostly in orange and the first modeled amino acid (residue 205) highlighted by a green sphere. The coiled-coil and C1b domains, which are the primary regions of AC5 involved in Gβγ binding, are colored magenta and red, respectively. Gβ and Gγ are shown in cyan and green, respectively. (B) The binding of C1b-α2 in AC5 to the core of Gβ (left panel), and the potential interactions between H6 in the coiled-coil domain (magenta) and C1b-α2 (red) in AC5 with hotspot residues in Gβ (right panel). A black dashed line indicates a putative hydrogen bond. (C) The interaction of H12 in the coiled-coil domain (magenta, left panel) and C1b-α4 (red, right panel) in AC5 with Gβ. The residues involved in binding are represented in sticks and colored based on atom types. A red dashed line indicates a potential ionic interaction. (D) Sequence alignment of Gβγ interacting regions in the coiled-coil domain and C1b-α4 in human mACs. The residues involved in binding in AC5–Gβγ complex are highlighted with red boxes.
Figure 3.
Figure 3.. The C1b-α2 and H121023–1034 regions in AC5 strongly contribute to Gβγ-mediated AC5 activation.
(A) Specific activity of AC5 and AC5Δ687–708 under basal conditions and after forskoloin or Gαs stimulation. (B) Gβγ dose-response curves for AC5 and AC5Δ687–708. (C) AC activity of AC5 and AC5Δ687–708 in HEK-ΔAC3/6 membranes in the presence of 10 mM MgCl2, 100 μM ATP, and 30 nM Gαs·GTPγS at the indicated Gβγ concentrations. Data presented are the mean ± SD from at least three independent experiments. (D) Specific activity of AC5 and AC5H12swap under basal conditions and after Gαs stimulation. (E) Gβγ dose-response curves for AC5+Gβγ, AC5H12swap+Gβγ, and AC5+GβR52Eγ. (F) Specific activity of AC5 and AC5Δ1–226 under basal conditions and after Gαs stimulation. (G) Gβγ dose-response curve for AC5 and AC5Δ1–226. In (A), (D) and (F), AC5 activity (mean ± SD) was measured in the presence of 10 mM MgCl2, 0.5 mM ATP with either 50 μM forskolin or 250 nM Gαs·GTPγS. Statistical significance was assessed using an unpaired Welch’s t-test (two-sided) across at least four (n=4 for (A) and (F), n=6 for (D)) independent experiments. In (B), (E) and (G), the Gβγ dose-response curves were determined in the presence of 10 mM MgCl2, 0.5 mM ATP, and 100 nM Gαs·GTPγS at the indicated Gβγ concentrations, with data presented as mean ± SD from at least two separate experiments composed of duplicates.
Figure 4.
Figure 4.. Location of disease associated AC5 mutations and impaired responses to Gβγ of those associated with familial dyskinesia.
(A) Cartoon representation of the AC5-Gβγ complex. Somatic mutations identified in AC5 linked to disease are depicted as spheres at their Cα positions. AC5 SNPs that were examined in this study are shown in red. The somatic mutations located at (B) coiled-coil domain, (C) C1b, and (D) catalytic core (from a AlphaFold2 model) are indicated with spheres. (E) Gβγ dose-response curves for AC5 variants in HEK-ΔAC3/6 cell membranes. AC assays were in the presence of 10 mM MgCl2, 100 μM ATP, and 30 nM Gαs·GTPγS at the indicated Gβγ concentrations. Data shown are mean ± SD from at least three independent experiments.
Figure 5.
Figure 5.. Homodimerization of AC5 could be linked to regulation by Gβγ.
(A) Representative 2D class averages (top panel, box size = 324 Å, mask = 180 Å) and the corresponding views of the 3D reconstructed model (bottom panel). The intermonomer distance between the coiled-coil domain is indicated by double arrows. AC5 is depicted in cartoon representation, and the regions involved in the dimer interface are highlighted in red in the bottom middle panel. The dimerization interface seems mediated by the α5-α6 linker in C1b and the α1-α2 loop in C2a, as shown in (B) and (C), respectively.
Figure 6.
Figure 6.. Proposed model for Gβγ-mediated AC5 activation.
Our study suggests that AC5 can exist in a monomer-dimer equlibrilum, with Gβγ exhibiting a preference for the monomer. Our biochemical data further indicates that the C1b domain contains an autoinhibitory element. We propose that Gβγ binding to C1b, AC5 is released from its autoinhibitory state, which may correspond to the homodimer, making it ready for catalysis. Domains outlined with dashes indicate that they are poorly ordered or unstructured in currently available structures.

References

    1. Krupinski J et al. Adenylyl cyclase amino acid sequence: possible channel- or transporter-like structure. Science 244, 1558–64 (1989). - PubMed
    1. Baldwin TA, Li Y, Brand CS, Watts VJ & Dessauer CW Insights into the Regulatory Properties of Human Adenylyl Cyclase Type 9. Mol Pharmacol 95, 349–360 (2019). - PMC - PubMed
    1. Ostrom KF et al. Physiological roles of mammalian transmembrane adenylyl cyclase isoforms. Physiol Rev 102, 815–857 (2022). - PMC - PubMed
    1. Crossthwaite AJ et al. The cytosolic domains of Ca2+-sensitive adenylyl cyclases dictate their targeting to plasma membrane lipid rafts. J Biol Chem 280, 6380–91 (2005). - PubMed
    1. Gu C & Cooper DM Calmodulin-binding sites on adenylyl cyclase type VIII. J Biol Chem 274, 8012–21 (1999). - PubMed

Methods-only references

    1. Morales-Perez CL, Noviello CM & Hibbs RE Manipulation of Subunit Stoichiometry in Heteromeric Membrane Proteins. Structure 24, 797–805 (2016). - PMC - PubMed
    1. Lee E, Linder ME & Gilman AG Expression of G-protein alpha subunits in Escherichia coli. Methods Enzymol 237, 146–64 (1994). - PubMed
    1. Brand CS, Hocker HJ, Gorfe AA, Cavasotto CN & Dessauer CW Isoform selectivity of adenylyl cyclase inhibitors: characterization of known and novel compounds. J Pharmacol Exp Ther 347, 265–75 (2013). - PMC - PubMed
    1. Dessauer CW Kinetic analysis of the action of P-site analogs. Methods Enzymol 345, 112–26 (2002). - PubMed
    1. Punjani A, Rubinstein JL, Fleet DJ & Brubaker MA cryoSPARC: algorithms for rapid unsupervised cryo-EM structure determination. Nat Methods 14, 290–296 (2017). - PubMed

MeSH terms

Substances

LinkOut - more resources