. 2024 May;43(9):1870-1897.
doi: 10.1038/s44318-024-00097-2. Epub 2024 Apr 8.

Yeast TLDc domain proteins regulate assembly state and subcellular localization of the V-ATPase

Affiliations

Yeast TLDc domain proteins regulate assembly state and subcellular localization of the V-ATPase

Samira Klössel et al. EMBO J. 2024 May.

Abstract

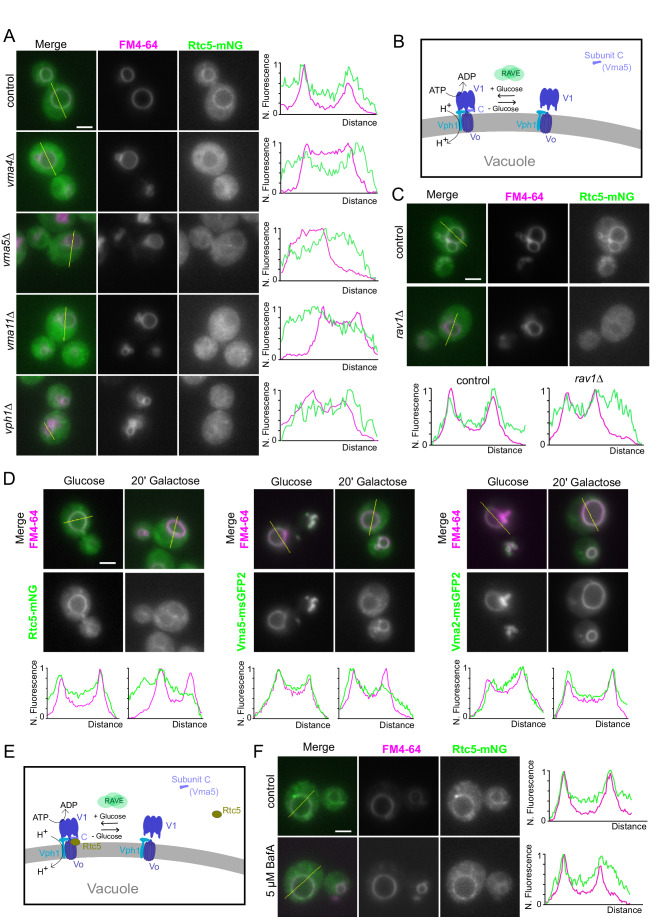
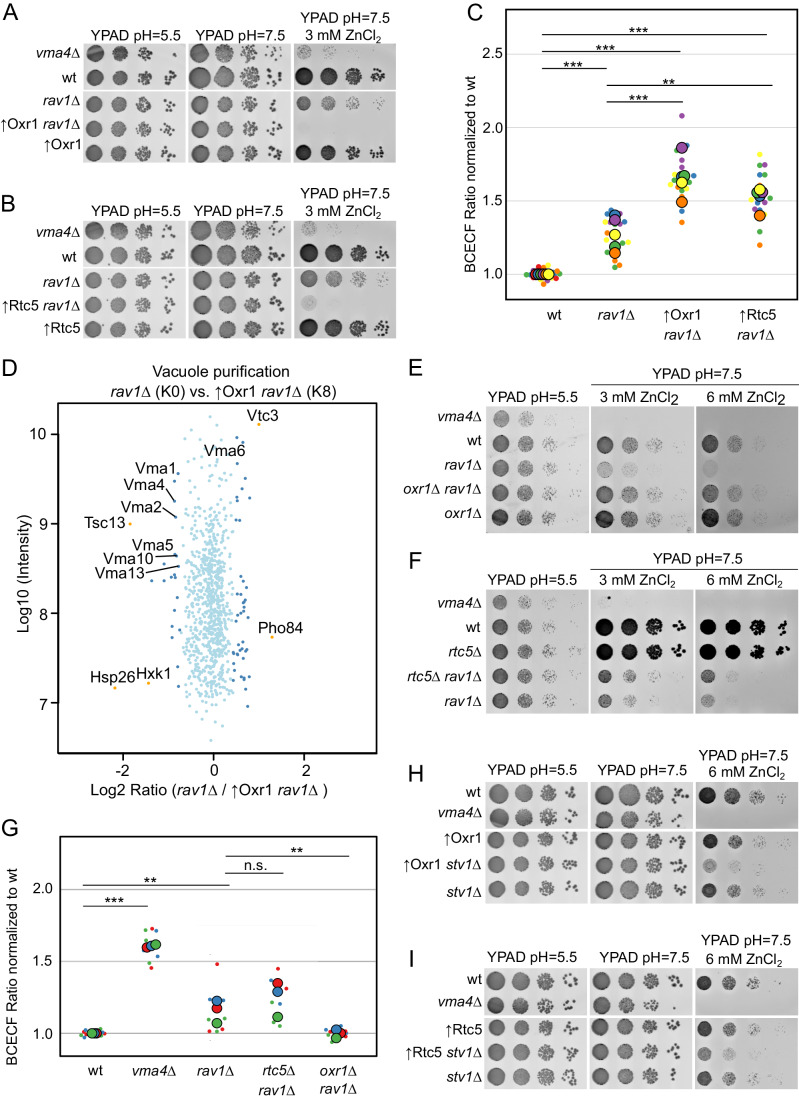
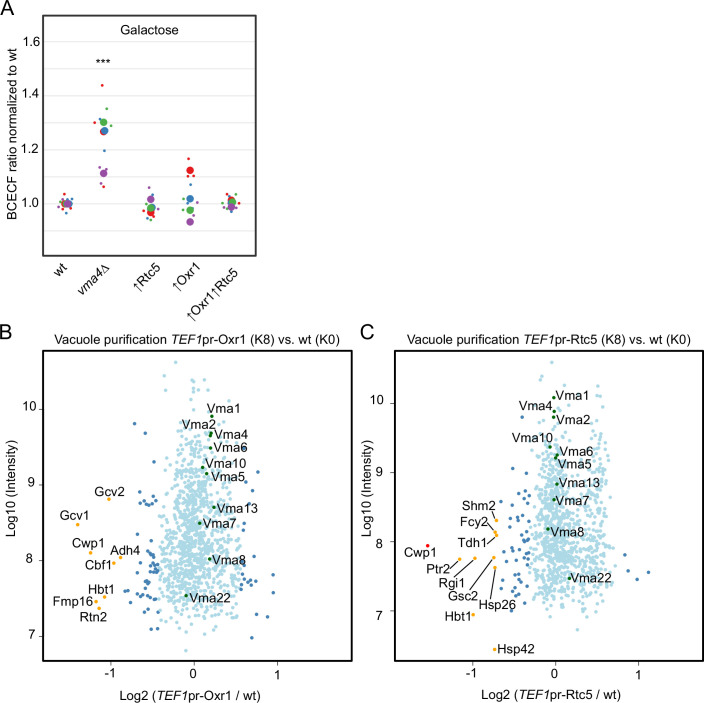
Yeast vacuoles perform crucial cellular functions as acidic degradative organelles, storage compartments, and signaling hubs. These functions are mediated by important protein complexes, including the vacuolar-type H+-ATPase (V-ATPase), responsible for organelle acidification. To gain a more detailed understanding of vacuole function, we performed cross-linking mass spectrometry on isolated vacuoles, detecting many known as well as novel protein-protein interactions. Among these, we identified the uncharacterized TLDc-domain-containing protein Rtc5 as a novel interactor of the V-ATPase. We further analyzed the influence of Rtc5 and of Oxr1, the only other yeast TLDc-domain-containing protein, on V-ATPase function. We find that both Rtc5 and Oxr1 promote the disassembly of the vacuolar V-ATPase in vivo, counteracting the role of the RAVE complex, a V-ATPase assembly chaperone. Furthermore, Oxr1 is necessary for the retention of a Golgi-specific subunit of the V-ATPase in this compartment. Collectively, our results shed light on the in vivo roles of yeast TLDc-domain proteins as regulators of the V-ATPase, highlighting the multifaceted regulation of this crucial protein complex.

Keywords: Cross-linking Mass Spectrometry; TLDc; V-ATPase; Vacuole.


Conflict of interest statement

The authors declare no competing interests.

Figures

Figure 1
Figure 1. A XL-MS-based vacuole interactome.
(A) Schematic representation of vacuolar XL-MS workflow. (B) XL-MS-based vacuolar interactome; selected PPIs corresponding to known vacuolar protein complexes are shown. All PPIs are listed in Dataset EV1. (C, D) Cross-link mapping onto available high-resolution structures of selected vacuolar protein complexes, including HOPS, AP-3, PI3K complex II (shown in C), EGO, SEA, and TORC1 (shown in Appendix Fig. S1). Cross-links are shown in red dashed lines. The cross-link distances were measured between Cα-Cα of the two linked lysines, using the measuring function of Pymol v.2.5.2. The graph in (D) shows the distance distribution of the mapped cross-links. The allowed maximum distance restraint for the DSBSO cross-linker is considered 35 Å.
Figure 2
Figure 2. Rtc5 is a novel interactor of the V-ATPase.
(A) XL-based interactions of V-ATPase subunits with Rtc5. (B) Diagram of the structure of the V-ATPase, with the different subunits labeled. The subunits found cross-linked to Rtc5 are shown in the same color in panels (A) and (B). Adapted from BioRender.com. Retrieved from https://app.biorender.com/biorender-templates. (C, D) SILAC-based GFP-Trap pull down of Vma2–msGFP2 (C) or Vph1-GFP (D) and mass spectrometry analysis. Light isotope-labeled control cells and heavy isotope-labeled cells expressing Vma2–msGFP2 or Vph1-GFP were used. The Log10 of protein intensity is plotted against the Log2 of the normalized heavy/light SILAC ratio. The dots represent proteins with significant enrichment based on a two-group, two-tailed Student´s t-test. (P < 0.05) are colored dark blue; other detected proteins are shown in light blue. The names of V-ATPase subunits and known interacting proteins are shown in purple, Rtc5 is colored in yellow. Other proteins enriched with P value <0.01 are labeled in black. (E) Model of Rtc5 bound to the V-ATPase. The model was created by docking with HADDOCK, the Alphafold-generated model of Rtc5, and the available V-ATPase structure, with the detected cross-links as restraints. The model shown is the one in best agreement with the cross-link data. The subunits of the V-ATPase are shown in the same color as in the diagram in panel (B) and Rtc5 is shown in yellow. Cross-links that fall below the 35 Å range are shown as red lines, while the crosslinks above this distance are shown as green lines. (F) Distance distribution of the 16 cross-links detected between Rtc5 and the V-ATPase when mapped onto the structure shown in panel (E). 35 Å are considered as the allowed maximum distance restraint of the DSBSO cross-linker.
Figure 3
Figure 3. Rtc5 localizes to the vacuole membrane dependent on an assembled V-ATPase.
(A) Fluorescence microscopy analysis of the subcellular localization of Rtc5-mNeonGreen (Rtc5-mNG) in a control strain or strains lacking different subunits of the V-ATPase: Vma4, Vma5, Vma11, or Vph1. The vacuolar membrane is stained with FM4-64. The line profiles to the right show the normalized fluorescence of the FM4-64 staining and the mNeonGreen signal of Rtc5 along the yellow lines shown in the merged images. The scale bar represents 2 µm. (B) Diagram representing the regulatory mechanism of disassembly of the V-ATPase upon glucose depletion. In conditions of high glucose availability, the V1–VO complex assembles and is active. When glucose is limited, subunit C (Vma5) is released from the vacuole membrane to the cytosol, the interaction between the two domains is weakened, and the complex becomes inactive. The re-assembly of the complex upon glucose becoming available again is aided by a specialized chaperone called the RAVE complex, the main subunit of which is the protein Rav1. (C, D) Fluorescence microscopy analysis of the subcellular localization of Rtc5-mNeonGreen to the vacuole membrane in conditions of V-ATPase disassembly. In (C), the disassembly of the V-ATPase is caused by disrupting the RAVE complex with the deletion of RAV1. In (D), cells were shifted to galactose for 20 min. The localization to the vacuole membrane is evidenced by line profile analysis along the lines shown in yellow in the merged images, like in panel (A). The scale bars represent 2 µm. (E) Updated model of V-ATPase disassembly, including that under low-glucose conditions, both subunit C and Rtc5 are released into the cytosol. (F) Fluorescence microscopy analysis of the subcellular localization of Rtc5-mNeonGreen to the vacuole membrane in conditions of V-ATPase inhibition by 30 min of treatment with the V-ATPase inhibitor Bafilomycin A1 (5 µM). Localization to the vacuole membrane is evidenced by line profile analysis along the lines shown in yellow in the merged images. The scale bars represent 2 µm. Source data are available online for this figure.
Figure 4
Figure 4. Rtc5 depends on N-myristoylation to localize to the vacuole membrane.
(A) Fluorescence microscopy analysis of the localization of Rtc5 under the expression of the strong constitutiveTEF1 promoter when tagged C- or N-terminally with msGFP2. The vacuolar membrane is stained with endocytosed FM4-64. The line profiles to the right show the normalized fluorescence intensity of Rtc5 tagged with msGFP2 and FM4-64 along the yellow lines in the merged images. The scale bar represents 2 μm. (B) Cells expressing Rtc5-msGFP2 under the control of the strong constitutive TEF1 promoter were labeled with azido-myristate (+) or mock-treated (−). A click chemistry-based conjugation of the azido-myristate with alkyne-biotin was performed in the lysates, and myristoylated proteins were pulled down using a streptavidin matrix. The immunoblot (IB) was performed with a primary antibody against GFP. An additional repetition of this experiment is shown in Appendix Fig. S2A. (C) Analysis of membrane association of Rtc5 and the Rtc5(G2A) mutant. A subcellular fractionation was performed using lysates from strains expressing C-terminally msGFP2 tagged Rtc5 or the Rtc5(G2A) mutant. Pgk1 is shown as a cytosolic marker protein, and Vam3 as an integral membrane protein marker. Next to each membrane, the protein recognized by the primary antibody used for the immunoblot is indicated (IB). Two additional repetitions of this experiment are shown in Appendix Fig. S2B,C. (D) Fluorescence microscopy analysis of strains expressing C-terminally mNeonGreen (mNG) tagged Rtc5 and the Rtc5(G2A) mutant. The vacuole membranes are stained with endocytosed FM4-64. Localization to the vacuole membrane is evidenced by line profile analysis across the organelle, along the yellow lines shown in the merged image. The scale bar represents 2 µm. Source data are available online for this figure.
Figure 5
Figure 5. Rtc5 and Oxr1 are not necessary for V-ATPase function, and their deletion results in higher V-ATPase assembly in vivo.
(A) Diagram of the domain organization of the two yeast TLDc domain-containing proteins, Oxr1 and Rtc5, together with two human proteins with a similar domain organization. S. cerevisiae Rtc5 and H. sapiens Meak7 are N-myristoylated proteins, which contain an N-terminal EF-hand-like domain and a C-terminal TLDc domain. S. cerevisiae Oxr1 and the splice variant Oxr1-C of H. sapiens consist mainly of just their TLDc domains. (B) A wt strain or strains lacking VMA4, OXR1 or RTC5, or both OXR1 and RTC5 were spotted as serial dilutions on media containing glucose with pH = 5.5, pH = 7.5, or pH = 7.5 and 3 mM ZnCl2, 10 mM ZnCl2, or 150 mM CaCl2. (C) Analysis of vacuolar acidity via BCECF staining in a wt strain, a strain lacking VMA4, OXR1, RTC5, or both RTC5 and OXR1. The experiments were performed with cultures grown in a medium containing glucose and pH = 5.5. For each strain, at least three independent experiments were performed, each containing three biological replicates. For each sample, the fluorescence emission of BCECF at 538 nm was measured when excited at 440 nm or 485 nm, and a ratio between these two values was calculated. The ratio was normalized to the average value for the wt strain in that experiment. The different colors in the graph indicate independent experiments, the smaller dots are biological replicates, and the larger circles represent the averages of each independent experiment. Statistical analysis was performed with a one-way ANOVA and a Tukey post hoc test. The vma4Δ strain was significantly different from the wt strain (***P value <0.001), all other strains are not significantly different from the wt strain (P value >0.05). (D, E) SILAC-based vacuole proteomics of cells lacking either OXR1 (D) or RTC5 (E) compared with the wt strain. Log10 of the detected protein intensities are plotted against Log2 of the heavy/light SILAC ratios. Significant outliers based on a two-group, two-tailed Student´s t-test are color-coded in red (P value <1e − 14), orange (P value <0.0001), or dark blue (P value <0.05); other identified proteins are shown in light blue. Corresponding experiments performed by switching the heavy and light labeling of the strains are shown in Appendix Fig. S3 A,B. (F, G) Cells in which Subunit C (Vma5) was tagged with msGFP2 were grown in a glucose-containing medium and imaged in the presence of glucose or after shifting them for 20 min to a medium containing galactose as the sole carbon source. The scale bar represents 2 μm. The distribution of Vma5 between the two compartments was quantified by using a ratio between the mean fluorescence intensity in a line along the vacuole membrane and the average of the mean fluorescence intensity in three circular regions in the cytosol. The different colors in the graph indicate independent experiments. The smaller circles represent individual cells, and the bigger circles represent the average for each independent experiment. Statistical comparison was performed using a one-way ANOVA and a Tukey post hoc test among the experimental means within each condition (glucose or galactose, n.s not significant P value >0.05; ***P value <0.001). Source data are available online for this figure.
Figure 6
Figure 6. Overexpression of Rtc5 or Oxr1 results in mild defects in vacuole acidification and less localization of Vma5 to the vacuole.
(A) A wt strain, a strain lacking VMA4, or strains overexpressing Rtc5, Oxr1, or both under the control of the strong constitutive TEF1 promoter were spotted as serial dilutions on glucose media of the indicated pH, with or without the addition of divalent cations as indicated in the figure. (B) Analysis of vacuolar acidity via BCECF staining in a wt strain, a strain lacking VMA4, and strains overexpressing either Rtc5, Oxr1, or both under the control of the strong constitutive TEF1 promoter. The experiments were performed with cultures grown in a medium containing glucose and pH = 5.5. For each strain, at least three independent experiments were performed, each containing three biological replicates. For each sample, the fluorescence emission of BCECF at 538 nm was measured when excited at 440 or 485 nm, and a ratio between these two values was calculated. The ratio was normalized to the average value for the wt strain in that experiment. The different colors in the graph indicate independent experiments, the smaller dots are biological replicates, and the larger circles represent the averages of each independent experiment. Statistical analysis was performed with a one-way ANOVA and a Tukey post hoc test. The vma4Δ strain was significantly different from the wt strain (***P value <0.001), all other strains are not significantly different from the wt strain (P value >0.05). (C) A wt strain, a strain lacking VMA4, or strains overexpressing Rtc5, Oxr1, or both under the control of the strong constitutive TEF1 promoter were spotted as serial dilutions on galactose media of the indicated pH, with or without the addition of divalent cations as indicated in the Figure. (D, E). Cells in which Subunit C (Vma5) was tagged with msGFP2 were grown in glucose-containing medium and imaged in this same medium or after shifting them for 20 min to a medium containing galactose as the sole carbon source. The distribution of Vma5 between the two compartments was quantified by using a ratio between the mean fluorescence intensity in a line along the vacuole membrane and the average of the mean fluorescence intensity in three circular regions in the cytosol. The different colors in the graph indicate independent experiments. The smaller circles represent individual cells, and the bigger circles represent the average for each independent experiment. Statistical comparison was performed using a one-way ANOVA and a Tukey post hoc test among the experimental means (***P value <0.001; n.s. not significant P value >0.05). The scale bar represents 2 µm. Source data are available online for this figure.
Figure 7
Figure 7. Rtc5 and Oxr1 counteract the function of the RAVE complex.
(A, B) Isogenic strains with the indicated modifications in the genome were spotted as serial dilutions in media with pH = 5.5, 7.5, or 7.5 and containing 3 mM ZnCl2. (C) Analysis of vacuolar acidity via BCECF staining in a wt strain, a strain lacking RAV1, and strains lacking RAV1 and overexpressing either Rtc5 or Oxr1 under the control of the strong constitutive TEF1 promoter. Five independent experiments were performed, each containing three biological replicates. For each experiment, the BCECF ratio was normalized to the average value of the wt strain in that experiment. The different colors in the graph indicate independent experiments, the smaller dots are biological replicates, and the larger circles represent the averages of each independent experiment. Statistical analysis was performed with a one-way ANOVA and a Tukey post hoc test (***P value <0.001; **P value <0.01; ***P value <0.001). (D) SILAC-based vacuole proteomics of rav1Δ compared to rav1Δ cells that overexpress Oxr1. Log10 of the detected protein intensities are plotted against Log2 of the heavy/light SILAC ratios. Significant outliers based on a two-group, two-tailed Student´s t-test are color-coded in red (P value <1e − 14), orange (P value <0.0001), or dark blue (P value <0.05); other identified proteins are shown in light blue. The same experiment but switching the heavy and light labeling of the strains is shown in Appendix Fig. S5A. (E, F) Isogenic strains with the indicated genomic modifications were spotted as serial dilutions on media with pH = 5.5, or pH = 7.5 with 3 mM and 6 mM ZnCl2. (G) Analysis of vacuolar acidity via BCECF staining in a wt strain, a strain lacking RAV1, and strains lacking RAV1 and lacking in addition either RTC5 or OXR1. Three independent experiments were performed, each containing three biological replicates. For each experiment, the BCECF ratio was normalized to the average value of the wt strain in that experiment. The different colors in the graph indicate independent experiments, the smaller dots are biological replicates, and the larger circles represent the averages of each independent experiment. Statistical analysis was performed with a one-way ANOVA and a Tukey post hoc test (n.s not significant P value >0.05, **P value <0.01, ***P value <0.001). (H, I) Isogenic strains with the indicated genomic modifications were spotted as serial dilutions on media with pH = 5.5, pH = 7.5, or pH = 7.5 with the addition of 6 mM ZnCl2. Source data are available online for this figure.
Figure 8
Figure 8. Oxr1 is required for the retention of Stv1 in pre-vacuolar compartments.
(AC) Fluorescence microscopy analysis of the subcellular localization of Stv1 in the absence of Oxr1 and Rtc5. Cells expressing C-terminally mNeonGreen tagged Stv1 (Stv1-mNG) in a control strain and in OXR1 and RTC5 deletion strains were imaged live by fluorescence microscopy. Sec7 was C-terminally tagged with 2xmKate2 (Sec7-2xmK2) as a late-Golgi marker, and Pfa3 was tagged with the HaloTag (Pfa3-HT) and stained with JFX650 as a vacuole membrane marker. Panel (A) shows representative images, and the scale bar represents 2 µm. Panels (B) and (C) show a co-localization analysis of Stv1-mNG with Pfa3-HT (B) or Sec7-2xmK2 (C) using Mander´s coefficients M1 and M2 for the overlap of the two signals. Each circle represents a single cell, the squares represent the average of each of three independent experiments, and the diamonds the overall average with error bars representing standard deviation. The statistical comparison was performed by a one-way ANOVA among the means for each experiment, followed by a Tukey post hoc test. The comparisons shown in the graph are between control and oxr1Δ cells (***P value <0.001, **P value <0.01), the difference between wt and rtc5Δ cells was non-significant in all cases (P value >0.05). (D, E) Analysis of the intensity of Stv1-mNG signal in late-Golgi compartments (D) or in whole cells (E). Analysis of the intensity of Stv1-mNG in the same experiment shown in panel (A). The mean intensity of the Stv1-mNG signal was measured in regions of interest (ROIs) representing the whole cell in an equatorial plane or in 3D ROIs representing late-Golgi compartments defined as structures positive for Sec7-2xmK2 signals. Each colored circle represents a single cell, and each black circle represents the mean of each of the three independent experiments. Statistical comparisons were performed by a one-way ANOVA among the means for each experiment, followed by a Tukey post hoc test (*P value <0.05; n.s. not significant P value >0.05). (F, G) Fluorescence microscopy analysis of Stv1(1–452)-mNG localization in a control strain and in a strain lacking OXR1, together with Pfa3-HT as a vacuole membrane marker. Panel (F) shows representative images, with a scale bar representing 2 µm. Panel G shows co-localization analysis using Mander´s M1 and M2 coefficients as described for panels (B) and (C). The statistical comparison was performed by a one-way ANOVA among the means for each experiment, followed by a Tukey post hoc test (***P value <0.001) (H) A wt strain, a VMA4 deletion strain, VPH1 and OXR1 deletion strains and a VPH1 OXR1 double deletion strain were spotted as serial dilutions on high-pH media with and without 3 mM ZnCl2 and 150 mM CaCl2. Source data are available online for this figure.
Figure 9
Figure 9. Diagram summarizing the in vivo localization and function of Rtc5 and Oxr1 with respect to the V-ATPase.
Rtc5 localizes to the vacuole membrane based on its N-terminal myristoylation and interaction with the assembled V-ATPase complex. Both Oxr1 and Rtc5 favor the disassembly of the V-ATPase, counteracting the role of the RAVE complex. Finally, Oxr1 is necessary for the retention of Stv1-containing V-ATPases in the late-Golgi or endosomal compartments.
Figure EV1
Figure EV1. Alphafold model of Rtc5 and growth phenotypes of rtc5Δ and oxr1Δ strains in medium containing galactose as the carbon source.
(A) Comparison of the AlphaFold model generated for Rtc5 with the available structure of Oxr1, the only two TLDc domain-containing proteins of Saccharomyces cerevisiae. (B) A wt strain or strains lacking VMA4, OXR1 or RTC5, or both OXR1 and RTC5 were spotted as serial dilutions on media containing galactose as the carbon source with pH = 5.5, pH = 7.5, or pH = 7.5 and 6 mM ZnCl2. (C) Analysis of vacuolar acidity via BCECF staining in a wt strain, a strain lacking VMA4, OXR1, RTC5, or both RTC5 and OXR1. The experiments were performed with cultures grown in a medium containing galactose and pH = 5.5. For each strain, at least three independent experiments were performed, each containing three biological replicates. For each sample, the fluorescence emission of BCECF at 538 nm was measured when excited at 440 or 485 nm, and a ratio between these two values was calculated. The ratio was normalized to the average value for the wt strain in that experiment. The different colors in the graph indicate independent experiments, the smaller dots are biological replicates and the larger circles represent the averages of each independent experiment. Statistical analysis was performed with a one-way ANOVA and a Tukey post hoc test. The vma4Δ strain was significantly different from the wt strain (***P value <0.001), all other strains are not significantly different from the wt strain (P value >0.05).
Figure EV2
Figure EV2. Vacuolar acidity when grown in galactose and vacuolar proteomics of strains overexpressing Rtc5 or Oxr1.
(A) Analysis of vacuolar acidity via BCECF staining in a wt strain, a strain lacking VMA4, overexpressing Oxr1, Rtc5, or both Rtc5 and Oxr1. The experiments were performed with cultures grown in a medium containing galactose and pH = 5.5. Four independent experiments were performed, each containing three biological replicates. For each sample, the fluorescence emission of BCECF at 538 nm was measured when excited at 440 or 485 nm, and a ratio between these two values was calculated. The ratio was normalized to the average value for the wt strain in that experiment. The different colors in the graph indicate independent experiments, the smaller dots are biological replicates, and the larger circles represent the averages of each independent experiment. Statistical analysis was performed with a one-way ANOVA and a Tukey post hoc test. The vma4Δ strain was significantly different from the wt strain (***P value <0.001), all other strains are not significantly different from the wt strain (P value >0.05). (B, C) SILAC-based vacuole proteomics of cells overexpressing either Oxr1 (B) or Rtc5 (C) compared with the wt strain. Log10 of the detected protein intensities are plotted against Log2 of the heavy/light SILAC ratios. Significant outliers are color-coded in red (P <1e − 14), orange (P < 0.0001), or dark blue (P < 0.05); other identified proteins are shown in light blue. V-ATPase subunits are labeled and shown as green dots. Statistical comparison is based on a two-group, two-tailed Student´s t-test. In panel C the range chosen for the X-axis excludes the dot representing Rtc5, so that the individual dots are clearly visible. This protein showed a Log2 (normalized H/L ratio) of 4.109945 and a Log10 (intensity) 9.433689846.
Figure EV3
Figure EV3. C-terminally tagged Rtc5 and Stv1 are functional, C-terminally tagged Oxr1 is not.
(A, B) Rct5-mNeonGreen and Rtc5-msGFP2 are functional. Serial dilutions of strains with the indicated genotypes were spotted on YPAD media pH = 5.5 or YPAD media pH = 7.5 containing 3 mM ZnCl2. (C) Oxr1-2xmNeonGreen is not functional. Serial dilutions of strains with the indicated genotypes were spotted on YPAD media pH = 5.5 or YPAD media pH = 7.5 containing 3 mM ZnCl2. (D) Oxr1-msGFP2 is not functional. Serial dilutions of strains with the indicated genotypes were spotted on YPAD media pH = 5.5 or YPAD media pH = 7.5 containing 3 mM ZnCl2. (E) Oxr1-2xmNeonGreen shows a cytosolic localization. Fluorescence microscopy images of cells expressing Oxr1-2xmNeonGreen (2xmNG) and endocytosed FM4-64 as a vacuolar marker. The scale bar represents 2 µm. (F) Overexpressed Oxr1-msGFP2 shows a cytosolic localization. Fluorescence microscopy images of cells expressing Oxr1-msGFP2 under the control of the strong constitutive TEF1 promoter and endocytosed FM4-64 as a vacuolar marker. The scale bar represents 2 µm. (G) Stv1-mNeonGreen is functional. Strains with the indicated genotypes were spotted as seriated dilutions in YPAD medium pH=5.5 and YPAD medium pH = 7.5 containing either 100 mM CaCl2 or 3 mM ZnCl2.
Figure EV4
Figure EV4. The localization of cargo proteins of the Retromer pathway is not affected by deletion of OXR1.
(A, B) The abundance of Retromer cargo proteins in the vacuole is not affected by the deletion of OXR1. The experiment in (A) is the same experiment as in Appendix Fig. S3A and the experiment in panel (B) is the same experiment as the one in Fig. 5D. SILAC-based vacuole proteomics of cells lacking OXR1 compared with the wt strain. Log10 of the detected protein intensities are plotted against Log2 of the heavy/light SILAC ratios. Significant outliers are color-coded in red (P value <1e − 14), orange (P value <0.0001), or dark blue (P value <0.05); other identified proteins are shown in light blue. Statistical comparison is based on a two-group, two-tailed Student´s t-test. Retromer cargo proteins were labeled and the dots are shown in green. (C, D) Retromer cargo proteins do not re-localize to the vacuole in strains lacking OXR1. Fluorescence microscopy analysis of Vps10-GFP or Kex2-GFP and vacuole lumen stained with CMAC, in wt cells, cells lacking the Retromer complex subunit VPS26 or strains lacking OXR1. The scale bar represents 2 µm.

Similar articles

Cited by

References

    1. Addinall SG, Downey M, Yu M, Zubko MK, Dewar J, Leake A, Hallinan J, Shaw O, James K, Wilkinson DJ, et al. A genomewide suppressor and enhancer analysis of cdc13-1 reveals varied cellular processes influencing telomere capping in Saccharomyces cerevisiae. Genetics. 2008;180:2251–2266. doi: 10.1534/genetics.108.092577. - DOI - PMC - PubMed
    1. Alam H, Williams TW, Dumas KJ, Guo C, Yoshina S, Mitani S, Hu PJ. EAK-7 controls development and life span by regulating nuclear DAF-16/FoxO activity. Cell Metab. 2010;12:30–41. doi: 10.1016/j.cmet.2010.05.004. - DOI - PMC - PubMed
    1. Banerjee S, Kane PM. Direct interaction of the Golgi V-ATPase a-subunit isoform with PI(4)P drives localization of Golgi V-ATPases in yeast. Mol Biol Cell. 2017;28:2518–2530. doi: 10.1091/mbc.e17-05-0316. - DOI - PMC - PubMed
    1. Banerjee S, Kane PM. Regulation of V-ATPase activity and organelle pH by phosphatidylinositol phosphate lipids. Front Cell Dev Biol. 2020;8:510. doi: 10.3389/fcell.2020.00510. - DOI - PMC - PubMed
    1. Binda M, Péli-Gulli MP, Bonfils G, Panchaud N, Urban J, Sturgill TW, Loewith R, De Virgilio C (2009) The Vam6 GEF controls TORC1 by activating the EGO complex. Mol Cell 35:563–573 - PubMed

Publication types

MeSH terms

Substances