. 2024 May;25(5):902-915.
doi: 10.1038/s41590-024-01803-2. Epub 2024 Apr 8.

TCF1-LEF1 co-expression identifies a multipotent progenitor cell (TH2-MPP) across human allergic diseases

Affiliations

TCF1-LEF1 co-expression identifies a multipotent progenitor cell (TH2-MPP) across human allergic diseases

Radomir Kratchmarov et al. Nat Immunol. 2024 May.

Abstract

Repetitive exposure to antigen in chronic infection and cancer drives T cell exhaustion, limiting adaptive immunity. In contrast, aberrant, sustained T cell responses can persist over decades in human allergic disease. To understand these divergent outcomes, we employed bioinformatic, immunophenotyping and functional approaches with human diseased tissues, identifying an abundant population of type 2 helper T (TH2) cells with co-expression of TCF7 and LEF1, and features of chronic activation. These cells, which we termed TH2-multipotent progenitors (TH2-MPP) could self-renew and differentiate into cytokine-producing effector cells, regulatory T (Treg) cells and follicular helper T (TFH) cells. Single-cell T-cell-receptor lineage tracing confirmed lineage relationships between TH2-MPP, TH2 effectors, Treg cells and TFH cells. TH2-MPP persisted despite in vivo IL-4 receptor blockade, while thymic stromal lymphopoietin (TSLP) drove selective expansion of progenitor cells and rendered them insensitive to glucocorticoid-induced apoptosis in vitro. Together, our data identify TH2-MPP as an aberrant T cell population with the potential to sustain type 2 inflammation and support the paradigm that chronic T cell responses can be coordinated over time by progenitor cells.


Figures

Extended Data Fig. 1:
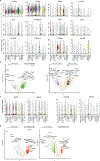
Extended Data Fig. 1:. Transcriptomic characterization of key GATA3-expressing lymphocytes.
a, Violin plots showing expression level of key genes used to annotate UMAP clusters. b, Volcano plot of differentially expressed genes between peTh2/Th2A and ILC2 (left) and between γδ T cell clusters (right). Highlighted transcripts have absolute β > 1 and adjusted p-value <0.05. c, Violin plots showing expression level of key TRM-associated transcripts. d, Volcano plot of differentially expressed genes between TFH and Memory-like (left) and peTh2/Th2A and Memory-like clusters (right). Highlighted transcripts have absolute β > 1 and adjusted p-value <0.05.
Extended Data Fig. 2:
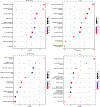
Extended Data Fig. 2:. Gene Set Enrichment Analysis of GATA3-expressing αβ T cell clusters.
Pseudobulk analysis was performed to identify marker transcripts differentiating each cluster from the integrated scRNAseq atlas dataset using a linear mixed model and controlling for dataset as random effect. Gene set enrichment analysis was then performed for each cluster based on biological process annotations. The top 10 pathways based on p-value and GeneRatio (count of genes in the core enrichment / total count of genes in this pathway) with a positive enrichment score and an adjusted p < 0.05 are displayed.
Extended Data Fig. 3:
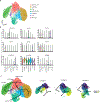
Extended Data Fig. 3:. Pseudotime differentiation trajectories of memory-like cluster.
a, UMAP of αβ T cells from the tissue atlas (Fig. 1) after re-clustering. b, Violin plots of key transcripts used to annotate clusters. c, Upper: Trajectories inferred by Slingshot algorithm superimposed on UMAP. Lower: Four distinct lineages with cells from each lineage colored by pseudotime.
Extended Data Fig. 4:
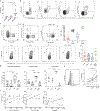
Extended Data Fig. 4:. Transcription factor, cytokine, and surface marker expression profiles of GATA3+ T cell subsets in nasal polyps.
a, Quantification of GATA3+ T cells in healthy nasal mucosa, chronic rhinosinusitis without nasal polyps (CRSsNP), and chronic rhinosinusitis with nasal polyps (CRSwNP). b, Identification of Th2 by CRTh2, GATA3, IL4, IL5, and IL13 expression. c, Representative staining and quantification of IL4, IFNg, IL17, and CD38 for identification of T helper subsets. d, Quantification of TCF1+/LEF1+ cell frequency in T helper subsets from indicated diseases. e, Left: Representative histogram of FOXO1 expression by CD8+ T cells, GATA3-CD4+ T cells, and GATA3+CD4+ T cells in nasal polyps. Right: quantification of FOXO1 MFI for indicated subsets. f, Correlation of blood absolute eosinophil count (left), total serum IgE (middle), and nasal eosinophil cationic protein (ECP) (right) with TCF1/LEF1 co-expression by nasal polyp Th2 cells. p<0.05. Pearson correlation coefficient. For all plots, ****p<0.0001. ***p<0.001. **p<0.01. *p<0.05. One-way ANOVA with Holm-Sidak correction for multiple comparisons.
Extended Data Fig. 5:
Extended Data Fig. 5:. Expression of pathogenic effector markers, inhibitory receptors associated with exhaustion, and transcription factors by Th2 in nasal polyps.
a, TRM marker expression by nasal polyp T cells. Left: Representative plots of CD69 and CD103 expression by total CD4+ and CD8+ T cells. Middle: Quantification of indicated subsets by CD69 and CD103 expression. Right: Frequencies of CD103 expression by indicated subsets of GATA3+CD4+ T cells. b, Expression of surface activation and inhibitory receptors by GATA3+CD4+ T cell subsets. c, Expression of peTh2/Th2A markers by GATA3+CD4+ T cell subsets. d, Expression of TCF1 and LEF1 by GATA3+CD4+ T cell subsets. All panels: ****p<0.0001. ***p<0.001. **p<0.01. *p<0.05. n.s. not significant. One-way ANOVA with Tukey’s correction for multiple comparisons.
Extended Data Fig. 6:
Extended Data Fig. 6:. scRNAseq identifies distinct T cell clusters in human nasal polyps and paired peripheral blood.
a, Representative gating strategy for sorting indicated subsets for scRNAseq. P1: ILCs (CD45+CD127+ lin−), P2: CD8+ T cells, P3: CRTh2+ Th2, P4: CCR4-CRTh2-CD4+, P5: CCR4+CXCR3− Th2. b, Expression of GATA3 and CCR4 by CD4+ T cells in nasal polyps. Plot is representative of 3 independent tissue donors. c, UMAP of nasal polyp lymphocytes split by donor. d, Heatmap of top 20 differentially expressed genes for each cluster with >0.5 log2 fold change and padjusted <0.05 cutoffs, Right column: key genes used to annotate clusters highlighted. e, Violin plots of expression level of indicated genes used to annotate UMAP clusters. f, Violin plots of key subset-defining surface markers detected by DNA-barcoded antibody labeling. g, Violin plot of SLC2A3, SLC16A3, ACSL4, and FFAR3 transcript expression by nasal polyp lymphocytes.
Extended Data Fig. 7:
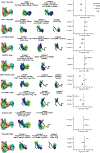
Extended Data Fig. 7:. Iterative expansion index analysis for nasal polyp T cell clusters.
Left: Iterative pseudotime lineage tracing for each specified origin node. Right: Average expansion indices +/− SEM for clones with overlap between each specified root node and the specified lineages. Positive values indicate clonal expansion in the putative effector cluster relative to root node; negative values indicate clonal expansion in the root cluster. Size of dots are scaled relative to the number of clones in that lineage. ** p<0.01. n.s. not significant. One sample Wilcoxon test.
Extended Data Fig. 8:
Extended Data Fig. 8:. scTCRseq analysis of lymphocytes in atopic dermatitis.
a, UMAP of integrated TCR-expressing T cells in atopic dermatitis. b, Dot Plot of lineage-defining transcripts used to identify clusters. c, Left: FeaturePlot of GATA3 expression. Right: Joint Density function plot of indicated transcripts used to identify putative progenitor and effector clusters. d, Circos plot of clonal overlap between each cluster. Each overlapping clone is connected by a line, with heavier line weights indicative of more overlapping clones. e, Upper Left: Pseudotime lineages with Th2-MPP cluster as starting node projected onto UMAP space. Right: UMAP space split by lineage, with cells from each lineage colored by pseudotime. Lower left: Average expansion indices +/− SEM for clones with overlap between Th2-MPP and the specified lineages. Positive values indicate clonal expansion in the putative effector cluster relative to Th2-MPP; negative values indicate clonal expansion in the Th2-MPP cluster. Size of dots are scaled relative to the number of clones in that lineage. ****p<0.0001. **p<0.01. n.s. not significant. One sample Wilcoxon test.
Extended Data Fig. 9:
Extended Data Fig. 9:. Iterative expansion index analysis for atopic dermatitis T cell clusters.
Left: Iterative pseudotime lineage tracing for each specified origin node. Right: Average expansion indices +/− SEM for clones with overlap between each specified root node and the specified lineages. Positive values indicate clonal expansion in the putative effector cluster relative to root node; negative values indicate clonal expansion in the root cluster. Size of dots are scaled relative to the number of clones in that lineage. ** p<0.01. n.s. not significant. One sample Wilcoxon test.
Extended Data Fig. 10:
Extended Data Fig. 10:. Modeling Th2 heterogeneity, differentiation, and persistence.
a, Expression of IFNγ and IL-13 in Th1 and Th2 cultures at day 7 of differentiation. Results are representative of 4 independent donors. b, Expression of IL-13 and IL-4 at day 7, day 14, and day 21 of culture. c, Expression of CD38 and CD69 versus cell division by Th2 cells at day 4 of differentiation. d, Left: Representative plots of GATA3 and PPARγ expression. Right: Representative histograms of CD49d expression by CD27+CRTh2−, CRTh2+CD161−, and CRTh2+CD161+ subsets. e, In vitro sorting strategy: Representative histogram of TCF1 expression by CD27+CRTh2− progenitor cells and CD27− effector Th2 cells in vitro. f, Differentiation of TCF1lo cells requires TCR stimulation. CD27+CRTh2− progenitor cells were sorted, labeled with CTV, and cultured for additional 7 days with (right) or without (left) TCR stimulation. Upper: Expression of TCF1 versus cell division (TCF1lo cells denoted by gate). Lower: Expression of CD27 versus cell division (CD27lo cells denoted by gate). g, Upper: Steady state expression of IL13 in CD27hi and CD27lo subsets. Lower: Steady state expression of TCF1 and LEF1 in Th2-MPP. (a-g) Results are representative of 3 independent donors. h, Proliferative capacity of Th2-MPP and peTh2/Th2A cells. Representative plots of GATA3 versus cell division. i, Sorting strategy for isolation of Th2-MPP for Treg and TFH cell fate analysis. j, Left: Expression of TCF1 and LEF1 following Th2-MPP differentiation. Right: Expression of cell fate markers CRTh2, CD161, FOXP3, and PD-1 by TCF1 and LEF1 hi/lo subsets. k, Expression of TSLP and IL33 by basal epithelial cells from patients with CRSwNP or CRSsNP. **p<0.01 Unpaired T test with Welch’s correction. l, Survival of CD27+ Th2 progenitors, sorted as in Fig. 6B, in culture for 10 days with IL-2, IL-33, or TSLP. Representative plots of LEF1 expression versus viability dye. Results are representative of 4 independent donors. m, Left: Representative plots of CRTh2 and TSLPR expression by GATA3+CD4+ T cells in nasal polyps. Right: Quantification of TSLPR expression by indicated GATA3+CD4+ T cell subsets **p<0.01 *p<0.05, 2-way ANOVA. n, Violin plot of IL1RL1, NR3C1, and FKBP5 expression by nasal polyp lymphocytes.
Fig. 1:
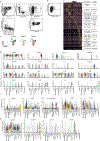
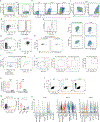
Fig. 1:. Single cell atlas of GATA3+ lymphocytes across human allergic diseases.
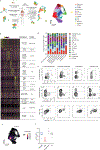
a, Left: Schematic outlining generation of a single-cell GATA3+ lymphocyte atlas. Datasets from the indicated human diseases were processed, and cells expressing GATA3 were extracted and integrated with Harmony. Right: UMAP of integrated, annotated GATA3+ lymphocytes. b, Heatmap of top 100 differentially expressed genes for each cluster (minimum 0.5 log2 fold change and padjusted <0.05), with key genes used to annotate clusters highlighted. c, Joint density plot of TCF7 and LEF1 in GATA3+ lymphocyte atlas showing enrichment in Memory-like cluster. d, Proportion of cells in each cluster for each disease. e, Upper: Expression of FOXP3 and GATA3 in CD4+ T cells. Middle: Expression of FOXP3 and CRTh2 by GATA3+CD4+ T cells. Lower: Expression of TCF1 and LEF1 by FOXP3-GATA3+CD4+ T cells. f, Quantification of GATA3+ lymphocytes from indicated diseases by flow cytometry, for CRSwNP and EOE N=9 donors, for lymphedema N=3 donors, for UC N=5 donors.
Fig. 2:
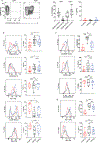
Fig. 2:. Aberrant maintenance of TCF1 and LEF1 expression by Th2 cells infiltrating human nasal polyps.
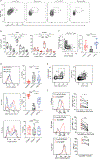
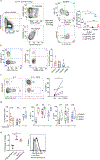
a, Expression of TCF1 and LEF1 by cytokine-producing Th2 (IL-4), Th1 (IFN-g), Th17 (IL-17), and CD8+ T cells from nasal polyps. Gate denotes TCF1hi/LEF1hi cells. b, Quantification of TCF1+/LEF1+ cells in total and activated (CD38+) CD4+ and CD8+ T cells from nasal polyps and healthy sinus mucosa. N=9 nasal polyp donors, N=7 healthy mucosa donors. ****p<0.0001. **p<0.01. One-way ANOVA with Dunnett’s correction for multiple comparisons. c, Identification of GATA3+ CD4+ T cell subsets. Left: Representative plot of FOXP3 and CRTh2 expression. Right: Quantification of frequencies of FOXP3+CRTh2-GATA3+, FOXP3-CRTh2+ GATA3+, and FOXP3-CRTh2-GATA3+ subsets. N=15 donors. ****p<0.0001. **p<0.01. n.s. not significant. One-way ANOVA with Tukey’s correction for multiple comparisons. d, Expression of indicated surface markers by GATA3+CD4+ T cell subsets with representative tracings (below). N=13 donors. ****p<0.0001. **p<0.01. *p<0.05. n.s. not significant. One-way ANOVA with Tukey’s correction for multiple comparisons. e, Expression of CD62L, CD27, CRTh2, and CD161 by nasal polyp GATA3+ T cells, with representative gating of CD27+CD62L+ and CRTh2+CD161+ subsets. Middle: Representative histograms of TCF1 and LEF1 expression by CRTh2+CD161+CD62L− Th2 (black) and CD27+CD62L+CRTh2− Th2-MPP (red). Lower: Quantification of TCF1 and LEF1 mean fluorescence intensity (MFI) in Th2-MPP and peTh2/Th2A. N=11 donors. **p<0.01. *p<0.05. Two tailed wilcoxon matched pairs test. f, Expression of PD-1 by Th2-MPP and peTh2/Th2A. N= 6 donors. Two tailed wilcoxon matched pairs test. For all panels with box and whisker plots, line denotes median, box range denotes 25th to 75th percentiles, whiskers show minimum and maximum values.
Fig. 3:
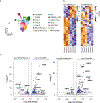
Fig. 3:. Pseudobulk analysis identifies transcriptional signatures of Th2-MPP and circulating blood memory cells.
a, UMAP of nasal polyp lymphocytes. b, Heatmaps of top 100 differentially expressed genes in pseudobulk analysis between Th2-MPP and blood memory clusters 1 (left) and 2 (right). c, Volcano plots of differentially expressed genes between Th2-MPP and (left) Blood Memory 1 and (right) Blood Memory 2. For all plots: fold change cut off 0.5, padjusted cutoff 0.01 as determined by False Discovery Rate (FDR). Labeled genes colored in blue meet both fold change and significance cutoff.
Fig. 4:
Fig. 4:. Metabolic heterogeneity of type 2 lymphocytes.
a, Fold change in IL-4 MFI of nasal polyp Th2 cells stimulated after culture for 8 hours in normal RPMI, RPMI without L-glutamine, or RPMI without glucose. n.s. not significant. Unpaired, two tailed t-test. N=5 donors. b, Left: Representative histogram of CD71 expression by indicated subsets from nasal polyps. Right: quantification of percent CD71+ cells from indicated subsets. ***p<0.001. **p<0.01. One-way ANOVA with Holm-Sidak correction for multiple comparisons. N=5 donors. c, Representative histograms of translation MFI (puromycin) for ILC2 (left) and Th2-MPP (middle) and Th2-Eff (CRTh2+CD38+CD62L−) (right) from nasal polyps treated with no drug (black), 2-DG (red), oligomycin (blue), or 2-DG + oligomycin (grey). Far Right: Quantification of mitochondrial dependence, glucose dependence, aerobic glycolytic capacity, and anapleurotic/beta oxidative capacity, with calculations as detailed in methods for each subset. ***p<0.001. **p<0.01. Two-way ANOVA with Holm-Sidak correction for multiple comparisons. N=6 donors. d, Fold change in translation MFI of nasal polyp Th2 cells cultured for 8 hours in normal RPMI, RPMI without L-glutamine, or RPMI without glucose. n.s. not significant. Unpaired t-test. N=6 donors e, Representative histogram of translation MFI (puromycin) for TCR-stimulated Th2 treated with no drug (black), 2-DG (red), oligomycin (blue), or 2-DG + oligomycin (grey). Right: Quantification of mitochondrial dependence, glucose dependence, aerobic glycolytic capacity, and anapleurotic/beta oxidative capacity, for resting and TCR-stimulated Th2. ***p<0.001. *p<0.05. Two-way ANOVA with Holm-Sidak correction for multiple comparisons. N=6 donors. For all panels with box and whisker plots, line denotes median, box range denotes 25th to 75th percentiles, whiskers show minimum and maximum values.
Fig. 5:
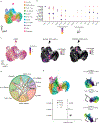
Fig. 5:. Single TCR clones exhibit clonal expansion and cross-cluster overlap along the Th2-MPP differentiation trajectory.
a, UMAP of integrated nasal polyp lymphocytes from this study and Ma et al. N=12,757 TCR-clonotyped cells. b, UMAP with color indicating expansion of each clone. c, Number of cells in each cluster binned by degree of expansion. d, Shannon diversity index of indicated clusters. e, Circos plot of clonal overlap between each cluster. Each overlapping clone is connected by a line, with heavier line weights indicative of more overlapping clones. f, Clonal overlap matrix between each pair of clusters, colored by increasing proportion of shared clones. g, Left: Pseudotime lineages with Th2-MPP cluster as starting node projected onto UMAP space. Middle: UMAP space split by lineage, with cells from each lineage colored by pseudotime. Right: Average expansion indices +/− SEM for clones with overlap between Th2-MPP and the specified lineages. Positive values indicate clonal expansion in the putative effector cluster relative to Th2-MPP; negative values indicate clonal expansion in the Th2-MPP cluster. Size of dots are scaled relative to the number of clones in that lineage. ** p<0.01. n.s. not significant. One sample two tailed Wilcoxon test. N=11 donors across integrated datasets.
Fig. 6:
Fig. 6:. Th2-MPP differentiation modeled in vitro.
a, Expression of TCF1 versus cell division at indicated timepoints of Th2 differentiation. TCF1lo cells denoted by gate. Results are representative of 4 independent donors. b, Differentiation capacity of in vitro-derived Th2 subsets. Left: Indicated subsets were sorted, labeled with proliferation dye (Cell Trace Violet, CTV), and cultured for additional 14 days. Upper Right: Expression of TCF1 versus cell division (TCF1lo cells denoted by gate). Lower Right: Expression of CD27 versus cell division. (CD27lo cells denoted by gate). Results are representative of 3 independent donors.
Fig. 7:
Fig. 7:. Th2-MPP couple self-renewal with effector differentiation to maintain the Th2 lineage.
a, Cell fate trajectories of Th2-MPP and T-Eff cells. Left: Sorting strategy for isolation of indicated subsets. Right: Differentiation capacity of Th2-MPP and Th2-Eff cells. Expression of LEF1 and IL-13 following 14 days of TCR stimulation. Lower Right: Quantification of subset frequencies post-differentiation. ** p<0.01. *p<0.05. n.s. not significant. Two-way ANOVA with Sidak correction for multiple comparisons. N=4 donors. b, Representative gating of CXCR5+ TFH-like, CRTh2+ Th2 Effector, FOPX3+ Treg, and GZMB+ cytotoxic subsets from Th2-MPP cultures. Middle: Quantification of indicated subsets. N=9 donors. c, TGFβ augments Treg differentiation. Representative gating of Treg cells in cultures of Th2-MPP after stimulation with or without TGFβ. Far Right: Quantification of FOXP3+ cells. *p<0.05. Paired, two tailed T test. N=4 donors. d, Left: Frequencies of indicated GATA3+ subsets in nasal mucosa of untreated patients or patients on dupilumab treatment. (Middle)%TCF1 and (Right) %LEF1 expression by indicated subsets in nasal mucosa of untreated patients or patients on dupilumab treatment. n.s. not significant, 2-way ANOVA with Sidak correction for multiple comparisons. N=6 donors. e, Left: Fold change in live cell frequencies of Th2 cultures treated with dexamethasone, TSLP, or a combination of TSLP and dexamethasone. Line indicates median +/− SEM. *p<0.05. One-way ANOVA with Holm-Sidak correction for multiple comparisons. Right: Expression of TSLPR after treatment with no drug or dexamethasone. For all panels with box and whisker plots, line denotes median, box range denotes 25th to 75th percentiles, whiskers show minimum and maximum values.

Similar articles

Cited by

References

    1. Paley MA et al. Progenitor and Terminal Subsets of CD8+ T Cells Cooperate to Contain Chronic Viral Infection. Science 338, 1220–1225 (2012). - PMC - PubMed
    1. Im SJ et al. Defining CD8+ T cells that provide the proliferative burst after PD-1 therapy. Nature 537, 417–421 (2016). - PMC - PubMed
    1. Utzschneider DT et al. T Cell Factor 1-Expressing Memory-like CD8+ T Cells Sustain the Immune Response to Chronic Viral Infections. Immunity 45, 415–427 (2016). - PubMed
    1. Wu T et al. The TCF1-Bcl6 axis counteracts type I interferon to repress exhaustion and maintain T cell stemness. Sci. Immunol. 1, eaai8593 (2016). - PMC - PubMed
    1. Sade-Feldman M et al. Defining T Cell States Associated with Response to Checkpoint Immunotherapy in Melanoma. Cell 175, 998–1013.e20 (2018). - PMC - PubMed

Publication types

MeSH terms