. 2024 Apr;25(4):607-621.
doi: 10.1038/s41590-024-01778-0. Epub 2024 Apr 8.

Large-scale phenotyping of patients with long COVID post-hospitalization reveals mechanistic subtypes of disease

Collaborators, Affiliations

Large-scale phenotyping of patients with long COVID post-hospitalization reveals mechanistic subtypes of disease

Felicity Liew et al. Nat Immunol. 2024 Apr.

Abstract

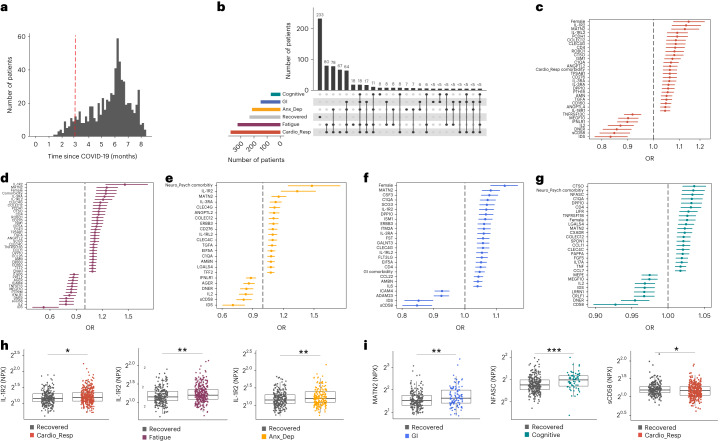
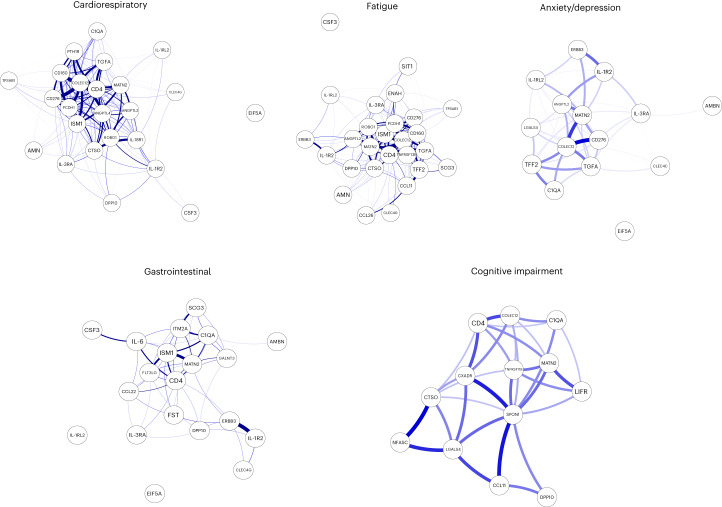
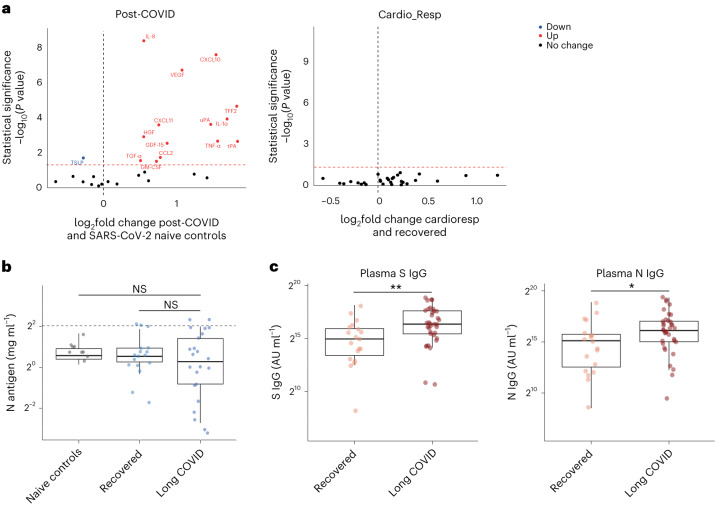
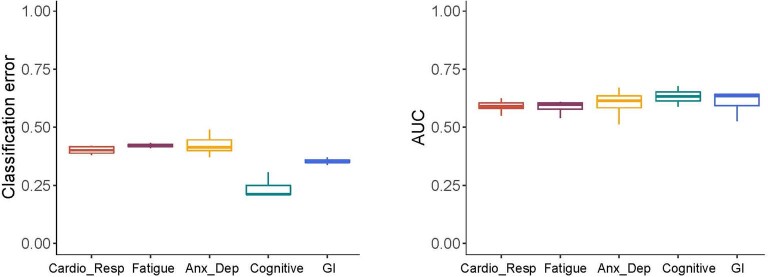
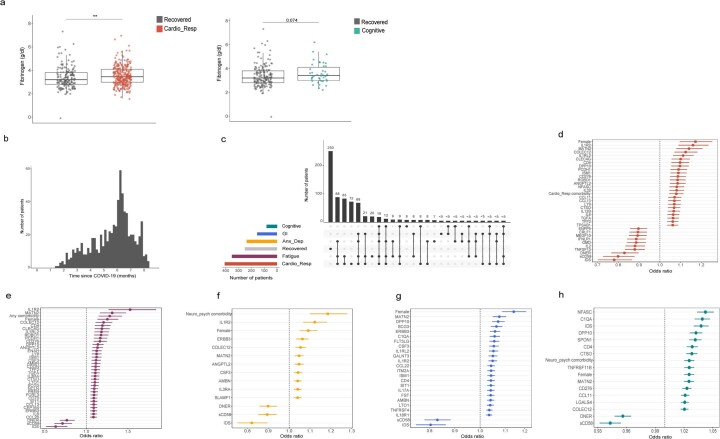
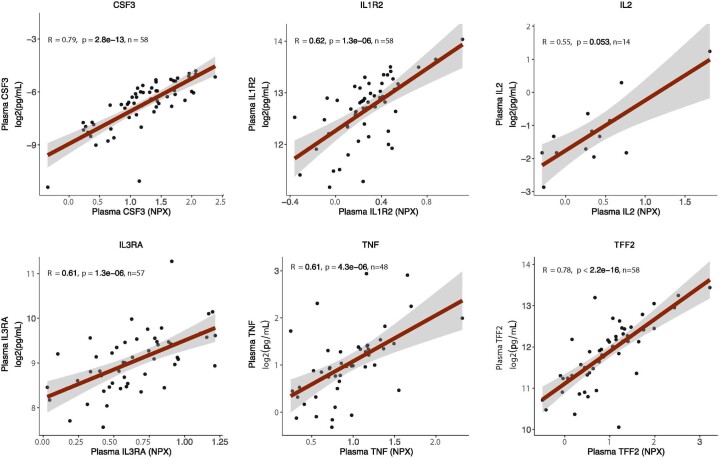
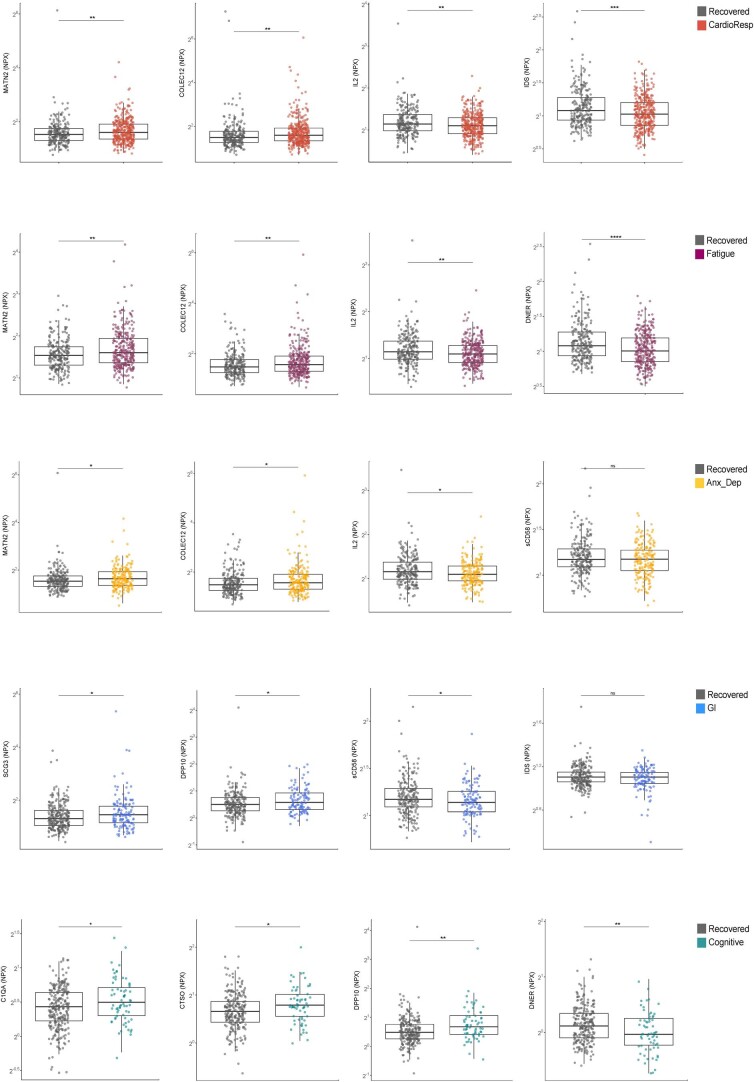
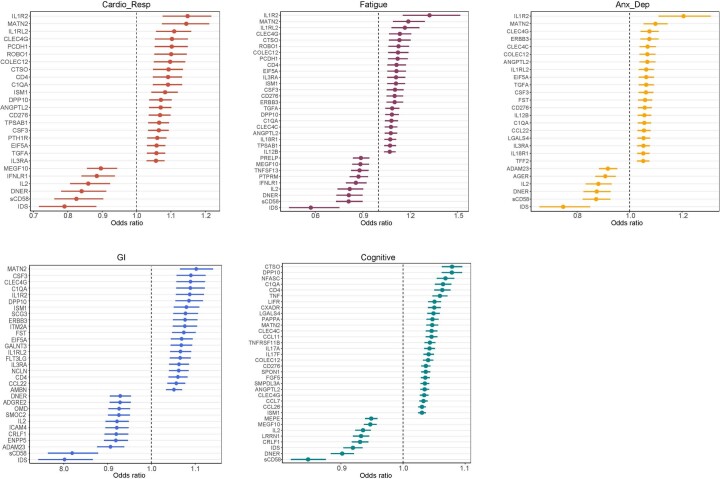
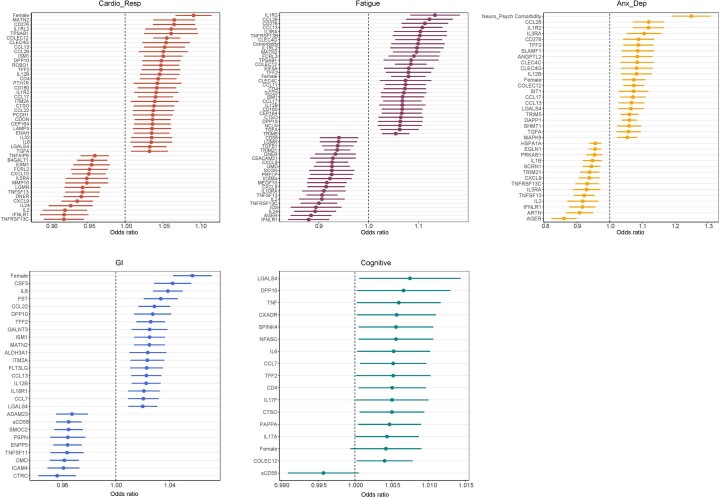
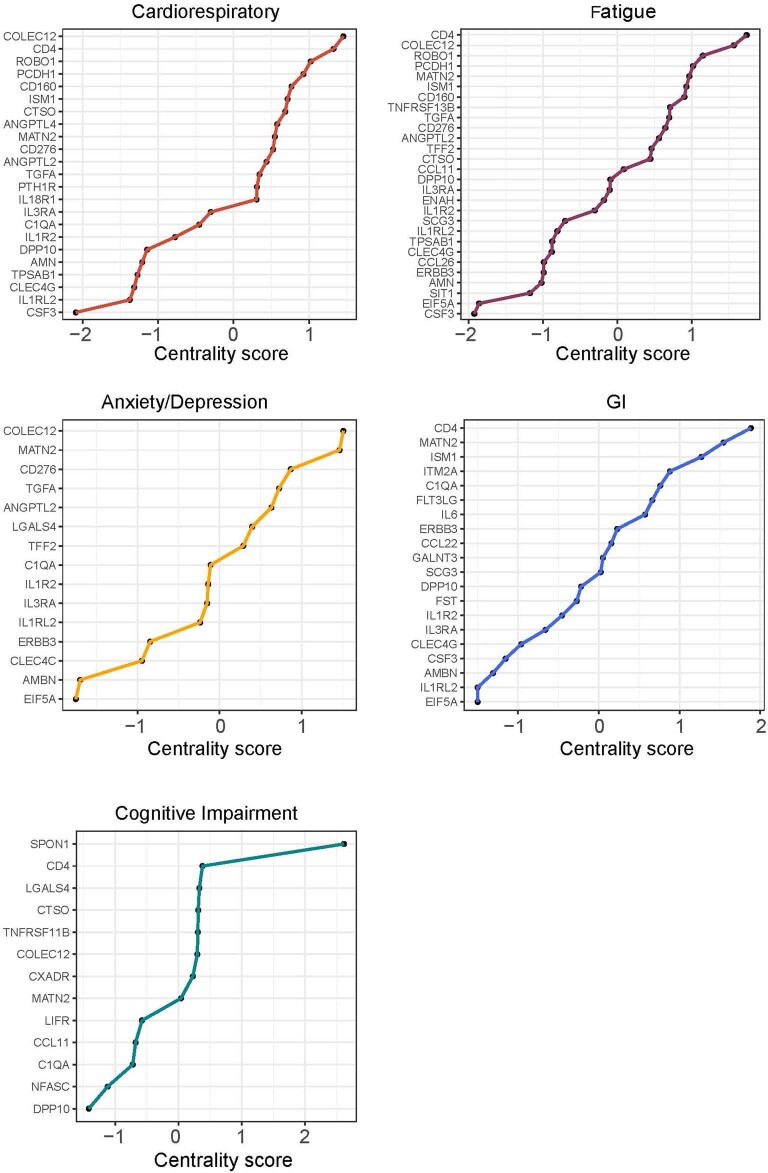
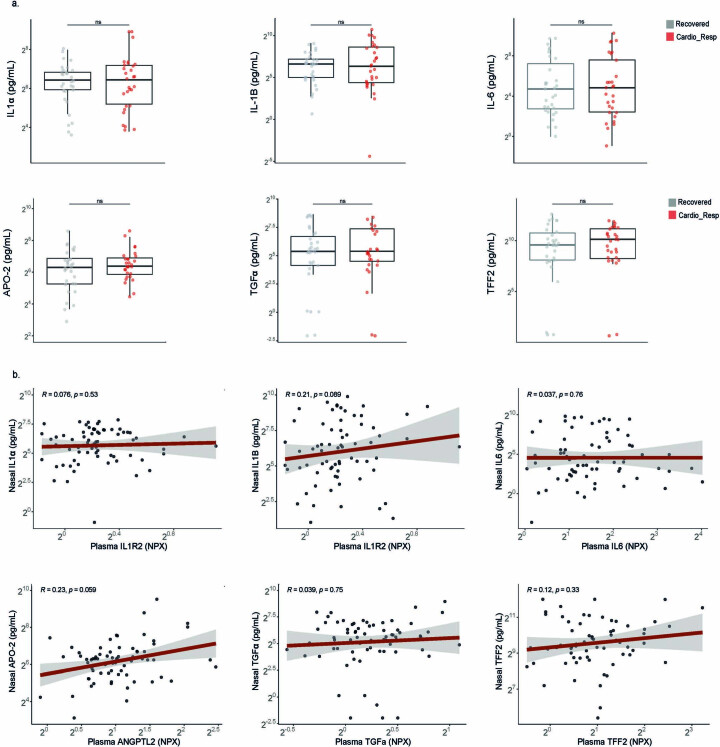
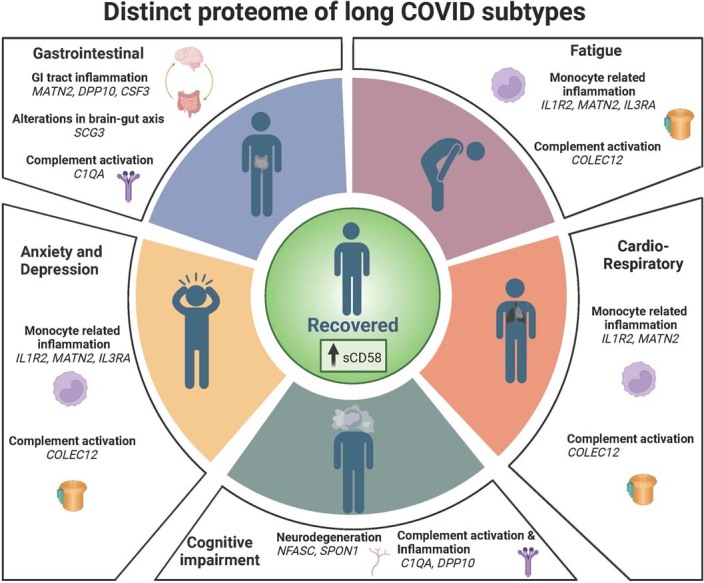
One in ten severe acute respiratory syndrome coronavirus 2 infections result in prolonged symptoms termed long coronavirus disease (COVID), yet disease phenotypes and mechanisms are poorly understood1. Here we profiled 368 plasma proteins in 657 participants ≥3 months following hospitalization. Of these, 426 had at least one long COVID symptom and 233 had fully recovered. Elevated markers of myeloid inflammation and complement activation were associated with long COVID. IL-1R2, MATN2 and COLEC12 were associated with cardiorespiratory symptoms, fatigue and anxiety/depression; MATN2, CSF3 and C1QA were elevated in gastrointestinal symptoms and C1QA was elevated in cognitive impairment. Additional markers of alterations in nerve tissue repair (SPON-1 and NFASC) were elevated in those with cognitive impairment and SCG3, suggestive of brain-gut axis disturbance, was elevated in gastrointestinal symptoms. Severe acute respiratory syndrome coronavirus 2-specific immunoglobulin G (IgG) was persistently elevated in some individuals with long COVID, but virus was not detected in sputum. Analysis of inflammatory markers in nasal fluids showed no association with symptoms. Our study aimed to understand inflammatory processes that underlie long COVID and was not designed for biomarker discovery. Our findings suggest that specific inflammatory pathways related to tissue damage are implicated in subtypes of long COVID, which might be targeted in future therapeutic trials.


Conflict of interest statement

F.L., C.E., D.S., J.K.S., S.C.M., C.D., C.K., N.M., L.N., E.M.H., A.B.D., J.K.Q., L.-P.H., K.P., L.S.H., O.M.K., S.F., T.I.d.S., D.G.W., R.S.T. and J.K.B. have no conflicts of interest. A.A.R.T. receives speaker fees and support to attend meetings from Janssen Pharmaceuticals. S.L.R.-J. is on the data safety monitoring board for Bexero trial in HIV+ adults in Kenya. J.D.C. is the deputy chief editor of the European Respiratory Journal and receives consulting fees from AstraZeneca, Boehringer Ingelheim, Chiesi, GSK, Insmed, Janssen, Novartis, Pfizer and Zambon. A. Horsley is deputy chair of NIHR Translational Research Collaboration (unpaid role). B.R. receives honoraria from Axcella therapeutics. R.A.E. is co-lead of PHOSP-COVID and receives fees from AstraZenaca/Evidera for consultancy on LC and from AstraZenaca for consultancy on digital health. R.A.E. has received speaker fees from Boehringer in June 2021 and has held a role as European Respiratory Society Assembly 01.02 Pulmonary Rehabilitation secretary. R.A.E. is on the American Thoracic Society Pulmonary Rehabilitation Assembly program committee. L.V.W. also receives funding from Orion pharma and GSK and holds contracts with Genentech and AstraZenaca. L.V.W. has received consulting fees from Galapagos and Boehringer, is on the data advisory board for Galapagos and is Associate Editor for the European Respiratory Journal. A. Ho is a member of NIHR Urgent Public Health Group (June 2020–March 2021). M.M. is an applicant on the PHOSP study funded by NIHR/DHSC. M.G.S. acts as an independent external and nonremunerated member of Pfizer’s External Data Monitoring Committee for their mRNA vaccine program(s), is Chair of Infectious Disease Scientific Advisory Board of Integrum Scientific LLC, and is director of MedEx Solutions Ltd. and majority owner of MedEx Solutions Ltd. and minority owner of Integrum Scientific LLC. M.G.S.’s institution has been in receipt of gifts from Chiesi Farmaceutici S.p.A. of Clinical Trial Investigational Medicinal Product without encumbrance and distribution of same to trial sites. M.G.S. is a nonrenumerated member of HMG UK New Emerging Respiratory Virus Threats Advisory Group and has previously been a nonrenumerated member of the Scientific Advisory Group for Emergencies (SAGE). C.B. has received consulting fees and/or grants from GSK, AstraZeneca, Genentech, Roche, Novartis, Sanofi, Regeneron, Chiesi, Mologic and 4DPharma. L.T. has received consulting fees from MHRA, AstraZeneca and Synairgen and speakers’ fees from Eisai Ltd., and support for conference attendance from AstraZeneca. L.T. has a patent pending with ZikaVac. P.J.M.O. reports grants from the EU Innovative Medicines Initiative 2 Joint Undertaking during the submitted work; grants from UK Medical Research Council, GSK, Wellcome Trust, EU Innovative Medicines Initiative, UK National Institute for Health Research and UK Research and Innovation–Department for Business, Energy and Industrial Strategy; and personal fees from Pfizer, Janssen and Seqirus, outside the submitted work.

Figures

Fig. 1
Fig. 1. Subtypes of LC are associated with distinct inflammatory profiles.
a, Distribution of time from COVID-19 hospitalization at sample collection. All samples were cross-sectional. The vertical red line indicates the 3 month cutoff used to define our final cohort and samples collected before 3 months were excluded. b, An UpSet plot describing pooled LC groups. The horizontal colored bars represent the number of patients in each symptom group: cardiorespiratory (Cardio_Resp), fatigue, cognitive, GI and anxiety/depression (Anx_Dep). Vertical black bars represent the number of patients in each symptom combination group. To prevent patient identification, where less than five patients belong to a combination group, this has been represented as ‘<5’. The recovered group (n = 233) were used as controls. cg, Forest plots of Olink protein concentrations (NPX) associated with Cardio_Resp (n = 365) (c), fatigue (n = 314) (d), Anx_Dep (n = 202) (e), GI (n = 124) (f) and cognitive (n = 60) (g). Neuro_Psych, neuropsychiatric. The error bars represent the median accuracy of the model. h,i, Distribution of Olink values (NPX) for IL-1R2 (h) and MATN2, neurofascin and sCD58 (i) measured between symptomatic and recovered individuals in recovered (n = 233), Cardio_Resp (n = 365), fatigue (n = 314) and Anx_Dep (n = 202) groups (h) and MATN2 in GI (n = 124), neurofascin in cognitive (n = 60) and sCD58 in Cardio_Resp and recovered groups (i). The box plot center line represents the median, the boundaries represent IQR and the whisker length represents 1.5× IQR. The median values were compared between groups using two-sided Wilcoxon signed-rank test, *P < 0.05, **P < 0.01, ***P < 0.001 and ****P < 0.0001.
Fig. 2
Fig. 2. Network analyses define key immune mediators in LC symptom groups.
Network analysis of Olink mediators associated with cardioresp (n = 365), fatigue (n = 314), anxiety/depression (n = 202), GI (n = 124) and cognitive groups (n = 60). Each node corresponds to a protein mediator identified by PLR. The edges (blue lines) were weighted according to the size of Spearman’s rank correlation coefficient between proteins. All edges represent positive and significant correlations (P < 0.05) after FDR adjustment.
Fig. 3
Fig. 3. Elevated immune mediator levels are most pronounced in older women with LC.
ac, Olink-measured plasma protein levels (NPX) of IL-1R2 and MATN2 (a and b) and CSF3 (c) between LC men and LC women divided by age (<50 or ≥50 years) in the cardiorespiratory group (<50 years n = 8 and ≥50 years n = 270) (a), fatigue group (<50 years n = 81 and ≥50 years n = 227) (b) and GI group (<50 years n = 34 and ≥50 years n = 82) (c). the median values were compared between men and women using two-sided Wilcoxon signed-rank test, *P < 0.05, **P < 0.01, ***P < 0.001 and ****P < 0.0001. The box plot center line represents the median, the boundaries represent IQR and the whisker length represents 1.5× IQR.
Fig. 4
Fig. 4. Pronounced mucosal inflammation after COVID-19 is not associated with LC.
a, Nasal cytokines measured by immunoassay in post-COVID participants (n = 64) compared with healthy SARS-CoV-2 naive controls (n = 25), and between the the cardioresp group (n = 29) and the recovered group (n = 31). The red values indicate significantly increased cytokine levels after FDR adjustment (P < 0.05) using two-tailed Wilcoxon signed-rank test. b, SARS-CoV-2 N antigen measured in sputum by electrochemiluminescence from recovered (n = 17) and pooled LC (n = 23) groups, compared with BALF from SARS-CoV-2 naive controls (n = 9). The horizontal dashed line indicates the lower limit of detection of the assay. c, Plasma S- and N-specific IgG responses measured by electrochemiluminescence in the LC (n = 35) and recovered (n = 19) groups. The median values were compared using two-sided Wilcoxon signed-rank tests, NS P > 0.05, *P < 0.05, **P < 0.01, ***P < 0.001 and ****P < 0.0001. The box plot center lines represent the median, the boundaries represent IQR and the whisker length represents 1.5× IQR.
Extended Data Fig. 1
Extended Data Fig. 1. Penalized logistic regression performance.
Graphs show classification error and Area under curve (AUC) from the 50 repeats tenfold nested cross-validation used to optimise and assess the performance of PLR testing associations with each LC outcome relative to Recovered (n = 233): Cardio_Resp (n = 398), Fatigue (n = 384), Anxiety/Depression (n = 202), GI (n = 132), (e) Cognitive (n = 6). The distributions of classification error and area under curve (AUC) from the nested cross-validation are shown. Box plot centre line represents the Median and boundaries of the box represent interquartile range (IQR), the whisker length represent 1.5xIQR.
Extended Data Fig. 2
Extended Data Fig. 2. Associations with long COVID symptoms in full study cohort.
(a) Fibrinogen levels at 6 months were compared between pooled LC cases (n = 295) and Recovered (n = 233) and between the Cognitive group (n = 41) and Recovered (n = 233). Box plot centre line represent the Median and boundaries of the box represent interquartile range (IQR), the whisker length represents 1.5xIQR, any outliers beyond the whisker range are shown as individual dots. Median differences were compared using two-sided Wilcoxon signed-rank test *=p < 0·05, **=p < 0·01, ***=p < 0·001, ****=p < 0·0001. Unadjusted p-values are reported. b) Distribution of time from COVID-19 hospitalisation at sample collection applying CDC and NICE definitions of LC (n = 719) (c) Upset plot of symptom groups. Horizontal coloured bars represent the number of patients in each symptom group: Cardiorespiratory (Cardio_Resp), Fatigue, Cognitive, Gastrointestinal (GI) and Anxiety/Depression (Anx_Dep). Vertical black bars represent the number of patients in each symptom combination group. To prevent patient identification, where less than 5 patients belong to a combination group, this has been represented as ‘<5’. The Recovered group (n = 250) were used as controls. Forest plots show Olink protein concentrations (NPX) associated with (d) Cardio_Resp (n = 398), (e) Fatigue (n = 342), (f) Anx_Dep (n = 219), (g) GI (n = 134), and (h) Cognitive (n = 65). Error bars represent the median accuracy of the model.
Extended Data Fig. 3
Extended Data Fig. 3. Validation of olink measurements using conventional assays in plasma.
Olink measured protein (NPX) were compared to chemiluminescence assays (ECL or ELISA, log2[pg/mL]) to validate our findings, where contemporaneously collected plasma samples were available (n = 58). Results from key mediators associated with LC groups were validated: CSF3, IL1R2, IL2, IL3RA, TNFa, TFF2. R= spearman rank correlation coefficient and shaded areas indicated the 95% confidence interval. Samples that fell below the lower limit of detection for a given assay were excluded and the ‘n’ value on each panel indicates the number of samples above this limit.
Extended Data Fig. 4
Extended Data Fig. 4. Univariate analysis of proteins associated with each symptom.
Olink measured plasma protein levels (NPX) compared between LC groups (Cardio_Resp, n = 398, Fatigue n = 384, Anxiety/Depression, n = 202, GI, n = 132 and Cognitive, n = 60) and Recovered (n = 233). Proteins identified by PLR were compared between groups. Median differences were compared using two-sided Wilcoxon signed-rank test. * = p < 0·05, ** = p < 0·01, *** = p < 0·001, ****= p < 0·0001 after FDR adjustment. Box plot centre line represent the Median and boundaries of the box represent interquartile range (IQR), the whisker length represents 1.5xIQR, any outliers beyond the whisker range are shown as individual dots.
Extended Data Fig. 5
Extended Data Fig. 5. Unadjusted Penalised Logistic Regression.
Olink measured proteins (NPX) and their association with Cardio_Resp (n = 398), Fatigue (n = 342), Anx_Dep (n = 219), GI (n = 134), and Cognitive (n = 65). Forest plots show odds of each LC outcome vs Recovered (n = 233), using PLR without adjusting for clinical co-variates. Error bars represent the median accuracy of the model.
Extended Data Fig. 6
Extended Data Fig. 6. Partial Least Squares analysis.
Olink measured proteins (NPX) and their association with Cardio_Resp (n = 398), Fatigue (n = 342), Anx_Dep (n = 219), GI (n = 134), and Cognitive (n = 65) groups. Forest plots show odds of LC outcome vs Recovered (n = 233), using PLS analysis. Error bars represent the standard error of the coefficient estimate.
Extended Data Fig. 7
Extended Data Fig. 7. Network analysis centrality.
Each graph shows the centrality score for each Olink measured protein (NPX) found to have significant associations with other proteins that were elevated in the Cardio_Resp (n = 398), Fatigue (n = 342), Anx_Dep (n = 219), GI (n = 134), and Cognitive (n = 65) groups relative to Recovered (n = 233).
Extended Data Fig. 8
Extended Data Fig. 8. Inflammation in men and women with long COVID.
Olink measured plasma protein levels (NPX) between men and women with symptoms, divided by age (<50 or >=50years): (a) shows IL1R2 and MATN2 in the Anxiety/Depression group (<50 n = 55, >=50 n = 133), (b) shows CTSO and NFASC in the Cognitive group (<50 n = 11, >=50 n = 50). Median values were compared between men and women using two-sided Wilcoxon signed-rank test. Box plot centre line represent the Median and boundaries represent interquartile range (IQR), the whisker length represents 1.5xIQR.
Extended Data Fig. 9
Extended Data Fig. 9. Inflammation in the upper respiratory tract.
Nasal cytokines measured by immunoassay in the CardioResp Group (n = 29) and Recovered (n = 31): (a) shows IL1a, IL1b, IL-6, APO-2, TGFa, TFF2. Median differences were compared using two-sided Wilcoxon signed-rank test. Box plot centre line represents the Median and boundaries of the box represent interquartile range (IQR), the whisker length represent 1.5xIQR. (b) Shows cytokines measured by immunoassay in paired plasma and nasal (n = 70). Correlations between IL1a, IL1b, IL-6, APO-2, TGFa and TFF2 in nasal and plasma samples were compared using Spearman’s rank correlation coefficient (R). Shaded areas indicated the 95% confidence interval of R.
Extended Data Fig. 10
Extended Data Fig. 10. Graphical abstract.
Summary of interpretation of key findings from Olink measured proteins and their association with CardioResp (n = 398), Fatigue (n = 342), Anx/Dep (n = 219), GI (n = 134), and Cognitive (n = 65) groups relative to Recovered (n = 233).

Similar articles

Cited by

References

    1. Davis HE, McCorkell L, Vogel JM, Topol EJ. Long COVID: major findings, mechanisms and recommendations. Nat. Rev. Microbiol. 2023;21:133–146. doi: 10.1038/s41579-022-00846-2. - DOI - PMC - PubMed
    1. Antonelli M, Pujol JC, Spector TD, Ourselin S, Steves CJ. Risk of long COVID associated with delta versus omicron variants of SARS-CoV-2. Lancet. 2022;399:2263–2264. doi: 10.1016/S0140-6736(22)00941-2. - DOI - PMC - PubMed
    1. Talla A, et al. Persistent serum protein signatures define an inflammatory subcategory of long COVID. Nat. Commun. 2023;14:3417. doi: 10.1038/s41467-023-38682-4. - DOI - PMC - PubMed
    1. Captur G, et al. Plasma proteomic signature predicts who will get persistent symptoms following SARS-CoV-2 infection. EBioMedicine. 2022;85:104293. doi: 10.1016/j.ebiom.2022.104293. - DOI - PMC - PubMed
    1. Scott, N. A. et al. Monocyte migration profiles define disease severity in acute COVID-19 and unique features of long COVID. Eur. Respir. J.10.1183/13993003.02226-2022 (2023). - PMC - PubMed

Substances