. 2024 May;16(5):1091-1114.
doi: 10.1038/s44321-024-00062-w. Epub 2024 Apr 8.

A missense mutation in human INSC causes peripheral neuropathy

Affiliations

A missense mutation in human INSC causes peripheral neuropathy

Jui-Yu Yeh et al. EMBO Mol Med. 2024 May.

Abstract

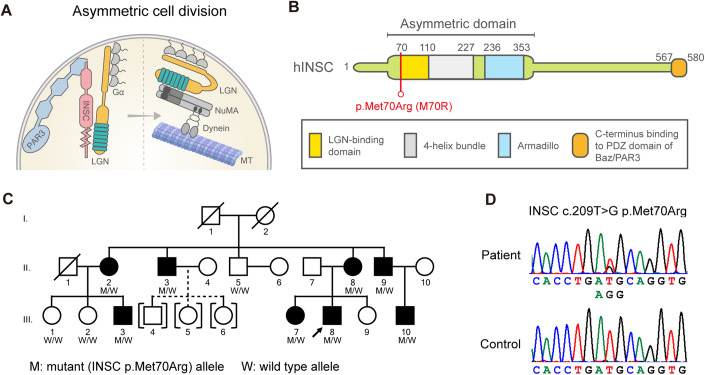
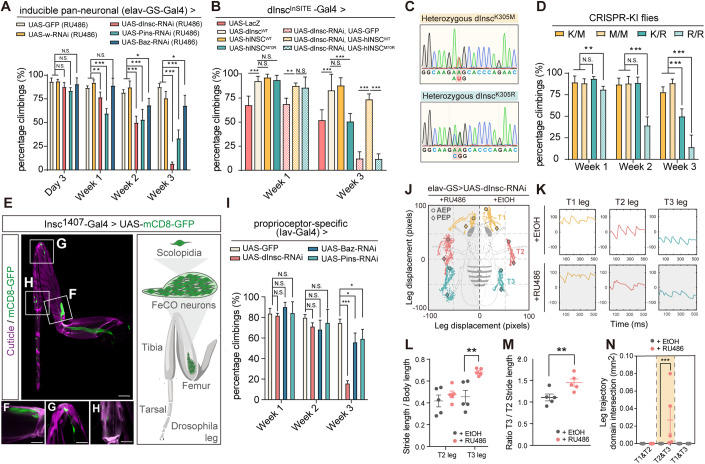
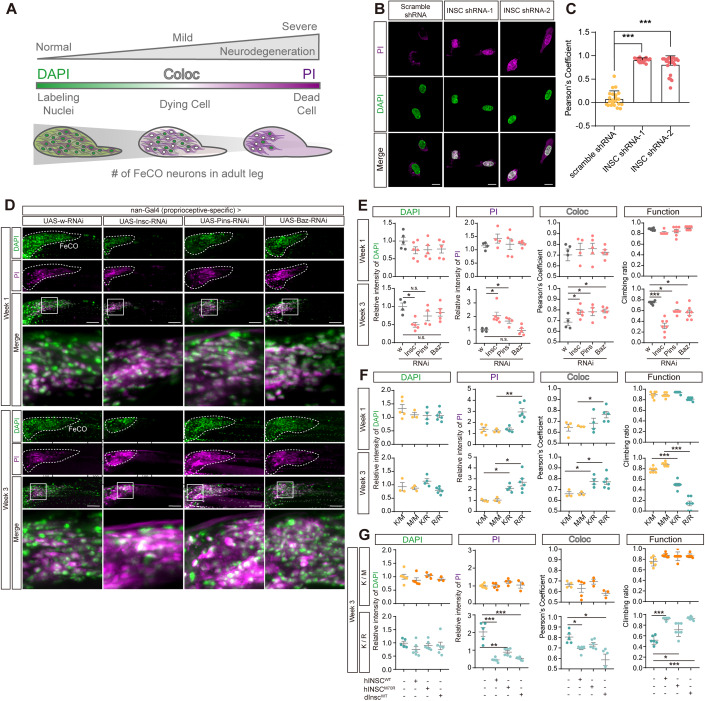
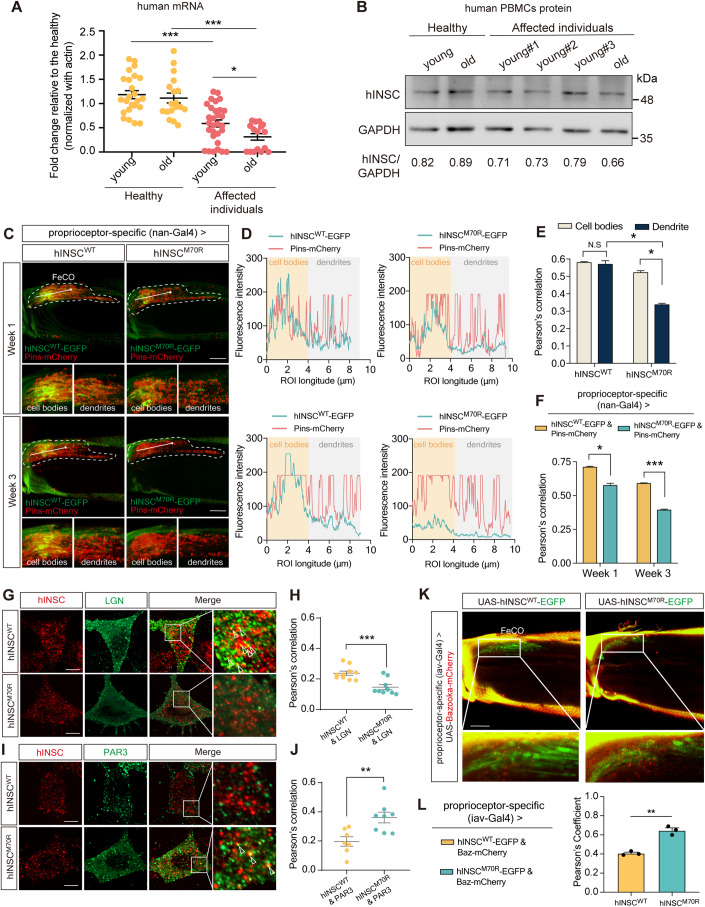
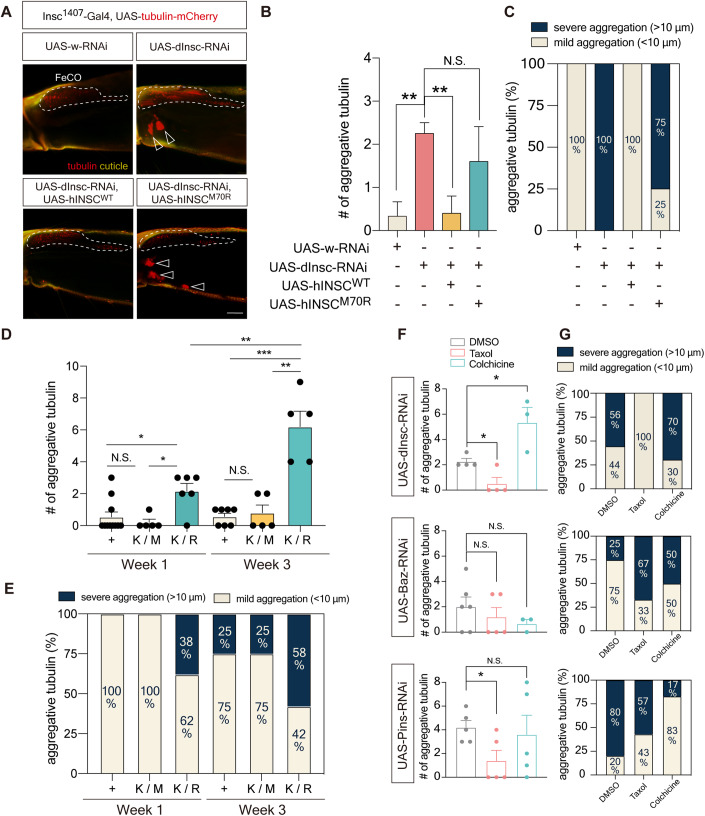
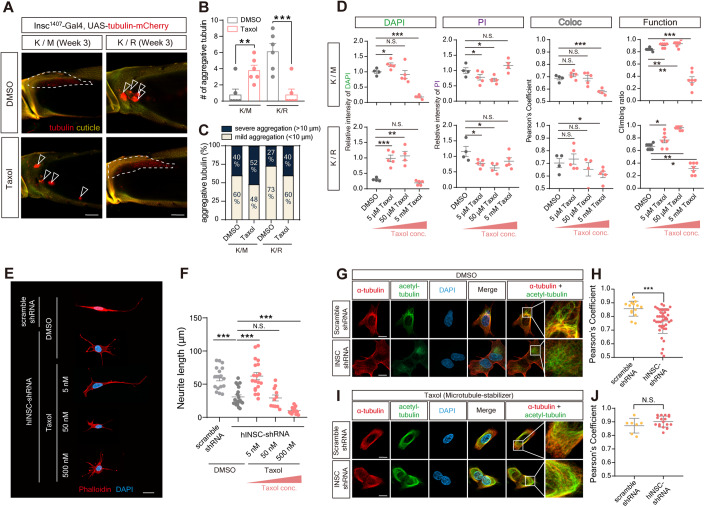
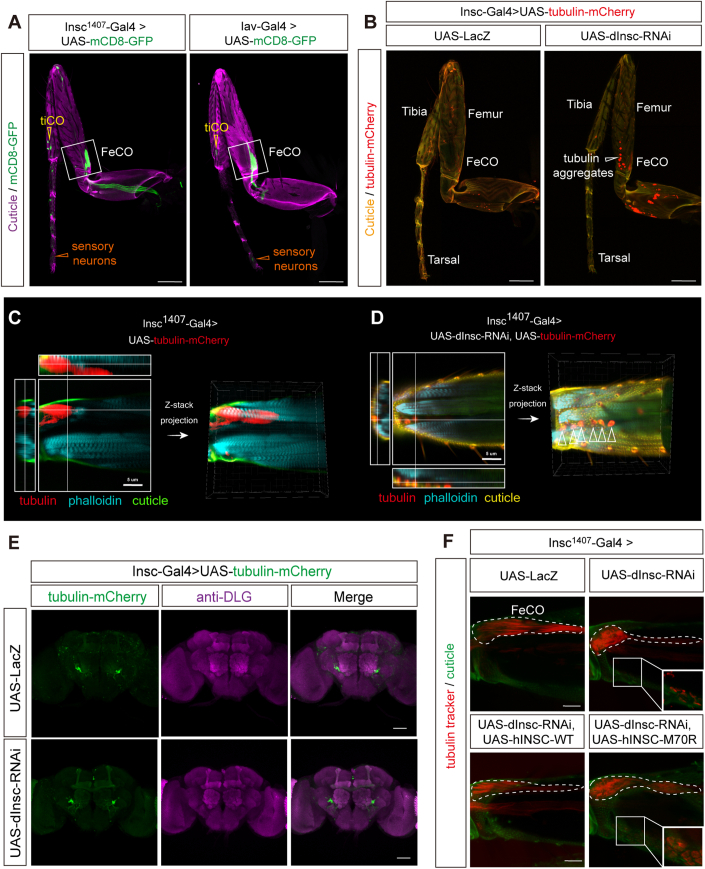
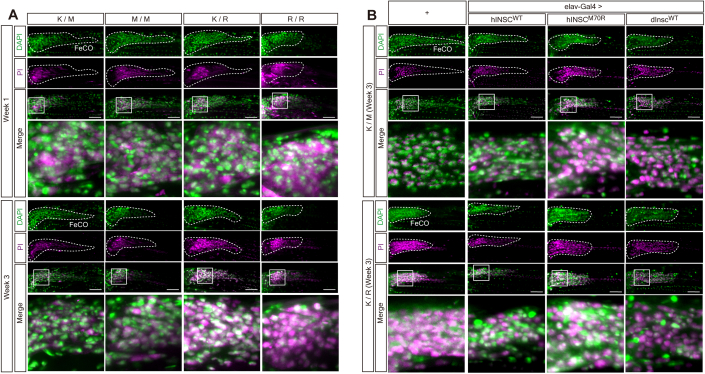
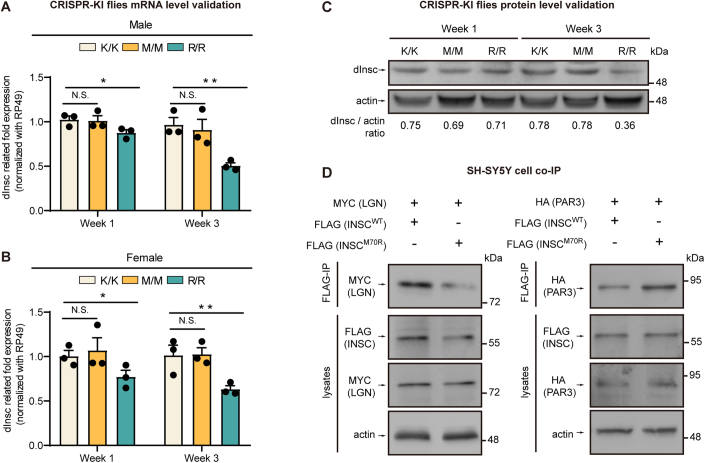
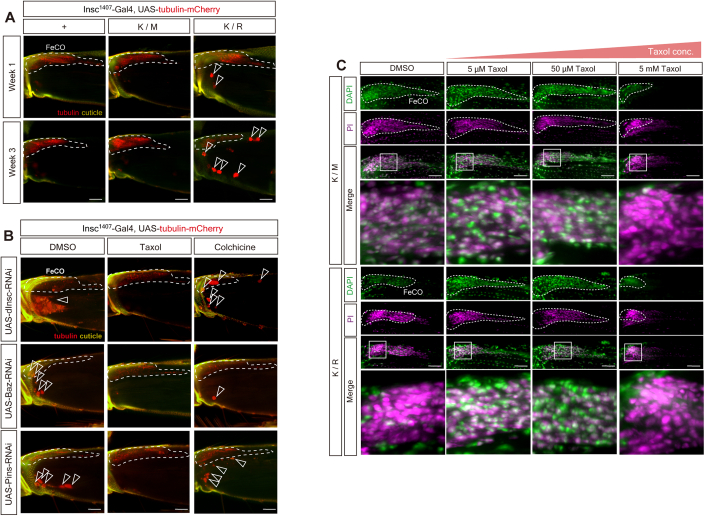
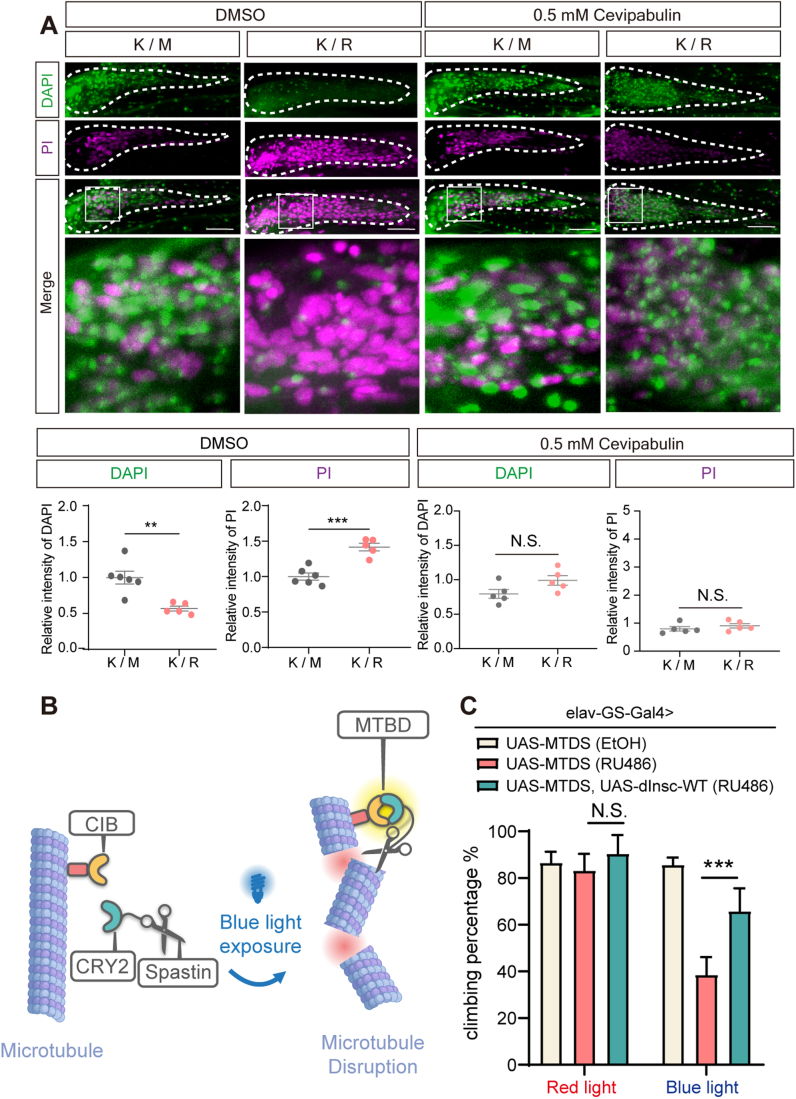
PAR3/INSC/LGN form an evolutionarily conserved complex required for asymmetric cell division in the developing brain, but its post-developmental function and disease relevance in the peripheral nervous system (PNS) remains unknown. We mapped a new locus for axonal Charcot-Marie-Tooth disease (CMT2) and identified a missense mutation c.209 T > G (p.Met70Arg) in the INSC gene. Modeling the INSCM70R variant in Drosophila, we showed that it caused proprioceptive defects in adult flies, leading to gait defects resembling those in CMT2 patients. Cellularly, PAR3/INSC/LGN dysfunction caused tubulin aggregation and necrotic neurodegeneration, with microtubule-stabilizing agents rescuing both morphological and functional defects of the INSCM70R mutation in the PNS. Our findings underscore the critical role of the PAR3/INSC/LGN machinery in the adult PNS and highlight a potential therapeutic target for INSC-associated CMT2.

Keywords: Inscuteable; Charcot–Marie–Tooth Neuropathy Type 2; Microtubule-Stabilizing Agents; Necrosis; Proprioception.


Conflict of interest statement

The authors declare no competing interests.

Figures

Figure 1
Figure 1. Identification of a CMT2-associated INSC variant.
(A) Schematic figure of asymmetric cell division in neuroblast. Inscuteable (INSC), an adaptor protein in asymmetric cell division, regulates microtubules by binding with PAR3 and LGN. (B) The INSC p.Met70Arg variant resides in the LGN-binding domain of the human INSC protein. (C) The CMT2 pedigree carrying the INSC mutation. “M” represents the INSC mutant allele, and “W” stands for wild-type allele. Open symbol: unaffected; filled symbol: affected; symbol with a diagonal line: deceased; arrow: proband; squares: males; circles: females; brackets with dashed line: adopted into the pedigree. (D) Sanger sequencing traces confirming the c. 290 T > G (p.Met70Arg, M70R) variant.
Figure 2
Figure 2. Adult-onset depletion of PIL complex causes locomotor and proprioceptive defects.
(A) Quantification of the climbing activity of 3-day-old to 3-week-old adult flies with dInsc-RNAi, Baz-RNAi and Pins-RNAi under the control of inducible pan-neuronal driver (elav-GS-Gal4) upon feeding with RU486, comparing with the age-matched controls (mCD8-GFP) and (w-RNAi); n = 100–249 flies/genotype from five independent fly crosses. (B) Quantification of the climbing activity of 1- and 3-week-old flies with overexpressing dInsc-WT, LacZ, hINSCWT, hINSCM70R, dInsc-RNAi, UAS-GFP and the groups co-overexpressing dInsc-RNAi with hINSCWT or hINSCM70R under the control of dInscInSITE-Gal4 driver; n = 57–110 flies/genotype from five independent fly crosses. (C) Sanger sequencing traces confirming the heterozygous dInscK305M and dInscK305R CRISPR-KI flies. (D) Quantification of the climbing activity of 1–3-week-old heterozygous +/dInscK305M (K/M) and +/dInscK305R (K/R), homozygous dInscK305M / dInscK305M (M/M) and dInscK305R/ dInscK305R (R/R) CRISPR-KI flies; n = 49–56 flies/genotype from five independent fly crosses. (E) Thoracic segments 1 (T1) leg of an adult fly expressing mCD8-GFP (green) under the control of dInsc1407-Gal4. (Right) a schematic of the FeCO neuron in an adult leg. Scale bars: 50 µm. Magenta is the auto-fluorescence of the cuticle. (FH) Magnified images of the femoral chordotonal organ (F), stretch receptor (G), and tibiotarsal chordotonal organ (H). Scale bars: 20 µm. (I) Quantification of the climbing activity of 1–3-week-old dInsc-RNAi, Baz-RNAi and Pins-RNAi flies under the control of Iav-Gal4, compared with the age-matched controls (mCD8-GFP); n = 44–129 flies/genotype from 5 independent fly crosses. (J) Body-centered leg trajectories plot of 3-week-old elav-GS-Gal4>UAS-dInsc-RNAi flies feeding with RU486, compared with the age-matched solvent feeding controls. AEP: anterior extreme positions; PEP: posterior extreme positions. (K) The leg displacement plots of T1 (yellow), T2 (pink) and T3 (cyan) legs from the same groups as (J). (L) Quantification of T2 and T3 leg stride length normalized to body length; n = 5 flies/condition from three independent fly crosses. (M) Quantification of the ratio T3/T2 stride length of RU486-fed group, compared with the solvent-fed control; n = 5 flies/condition from three independent fly crosses. (N) Quantification of the leg trajectory domain intersection of RU486-fed group, compared with the solvent-fed control; n = 5 flies/condition from three independent fly crosses. Data information: Error bars indicate mean ± SEM. Statistical analysis was performed using two-tailed Student’s t test. *P < 0.05, **P < 0.01, ***P < 0.001. Source data are available online for this figure.
Figure 3
Figure 3. Counter-correlation between necrosis and locomotor activity in PIL loss of function flies.
(A) Schematic figure analyzing the relative intensity and colocalization of DAPI and PI staining indicated the progression of necrotic cell death in vivo. The intensity and colocalization of DAPI and PI may represent the stage of necrosis. For instance, in the healthy neurons, the signal of DAPI is largely stronger than PI; in the situation of progressive necrosis, DAPI highly colocalizes with PI; in the stage of severe neurodegeneration when most of the neuronal cell died, we can detect a weak signal of DAPI, but a relative stronger signal of PI. (B) Representative PI staining in scramble shRNA and hINSC-shRNA SH-SY5Y cell. Magenta is PI staining. Green is DAPI staining. Scale bar: 10 µm. (C) Pearson’s coefficient of colocalization between PI and DAPI in hINSC-shRNA-1 and hINSC-shRNA-2, compared with scramble shRNA in (B); n = 60 cells/condition from 3 independent technical replicates. (D) Representative confocal images of dInsc-RNAi, Pins-RNAi and Baz-RNAi co-staining with PI (magenta) and DAPI (green) in FeCO neurons of 1- and 3-week-old flies, compared with w-RNAi control. The FeCO neurons are encircled by the dashed lines. Scale bar: 5 µm. (E) Quantification of the relative intensity and colocalization (coloc) of DAPI and PI in (D), and comparing the results with the functional assay. The relative intensity is normalized with w-RNAi; n = 18–28 flies/genotype from three independent fly crosses. (F) Quantification of the relative intensity and colocalization of DAPI and PI in (Fig. EV2A), and comparing the results with the functional assay. The relative intensity is normalized with W1118 (K/K) flies; n = 16–28 flies/genotype from three independent fly crosses. (G) Quantification of the relative intensity and colocalization of DAPI and PI in (Fig. EV2B), and comparing the results with the functional assay. The relative intensity is normalized with K/M and K/R CRISPR-KI flies, respectively; n = 15–27 flies/genotype from three independent fly crosses. Data information: Error bars indicate mean ± SEM. Statistical analysis was performed using two-tailed Student’s t test. *P < 0.05, **P < 0.01, ***P < 0.001. Source data are available online for this figure.
Figure 4
Figure 4. hINSC-M70R protein exhibited decreased levels and altered association with PIL complex.
(A) Relative mRNA abundance of hINSC in the PBMCs of young (n = 2) and old (n = 1) affected individuals, compared with healthy young (n = 2) and old (n = 2) controls. For each trial, three replicates of three cDNA preparations per participant were performed. The data points collected from the same group of participants in two separate trials, each conducted 6 months apart, were pooled together. (B) Representative western blot of hINSC from PBMCs in young and old affected individuals, compared with healthy young and old controls. (C) Representative images of co-expressing hINSCM70R-EGFP (green) and Pins-mCherry (red) in 1- and 3-week-old flies under FeCO-expressing nan-Gal4, compared with the age-matched controls (hINSCWT-EGFP). The white arrow indicates the direction of the fluorescence intensity profile. Scale bars: 5 µm. Shown below are the magnified insets of cell bodies and dendrites in FeCO neurons, respectively. (D) Representative fluorescence intensity profiles were generated to visualize colocalization of hINSCM70R-EGFP and Pins-mCherry of cell bodies and dendrites in 1- and 3-week-old flies, compared with the age-matched controls (hINSCWT-EGFP). The linear region of interest (ROI) was drawn manually from left to right. (E) Pearson’s coefficient of colocalization hINSCWT and hINSCM70R with Pins in (C) in cell bodies and dendrite in FeCO neurons of 1-week-old flies; n = 9 flies/genotype from three independent fly crosses. (F) Pearson’s coefficient of colocalization of whole FeCO neurons of 1- and 3-week-old flies in (C); n = 8–9 flies/genotype from three independent fly crosses. (G) Immunostaining of SH-SY5Y cells transfected with FLAG-hINSCM70R (red) to visualize the colocalization with MYC-LGN (green), comparing with FLAG-hINSCWT (red) control. Scale bar: 10 µm. (H) Pearson’s coefficient of colocalization of anti-FLAG (red) and anti-MYC (green) fluorescence in (G); n = 9–10 cells/condition from three independent transfection. (I) Immunostaining of SH-SY5Y cells transfected with FLAG-hINSCM70R (red) to visualize the colocalization with HA-PAR3 (green), comparing with FLAG-hINSCWT (red) control. Scale bar: 10 µm. (J) Pearson’s coefficient of colocalization of anti-HA (green) and anti-FLAG (red) fluorescence in (I); n = 9–10 cells/condition from three independent transfection. (K) Representative images of co-expressing hINSCM70R-EGFP (green) and Baz-mCherry (red) in 3-week-old flies under Iav-Gal4, compared with the age-matched controls (hINSCWT-EGFP). Scale bars: 5 µm. (L) Pearson’s coefficient of colocalization of EGFP (green) and mCherry (red) fluorescence in (K); n = 3 flies/genotype from three independent fly crosses. Data information: Error bars indicate mean ± SEM. Statistical analysis was performed using two-tailed Student’s t test. *P < 0.05, **P < 0.01, ***P < 0.001. Source data are available online for this figure.
Figure 5
Figure 5. Aging flies of PIL loss-of-function exhibited tubulin aggregation in FeCO neurons.
(A) Representative confocal images of tubulin aggregation in the femur in 3-week-old dInsc1407-Gal4>dInsc-RNAi flies compared with the control (w-RNAi) and the rescue (hINSCWT but not hINSCM70R) groups. Yellow indicates the auto-fluorescence of cuticles. The FeCO neurons are encircled by the dashed line. Arrowheads indicate the aggregative tubulin. Scale bars: 5 µm. (B) Quantification of the number of aggregative tubulins in (A); n = 4–5 flies/genotype from three independent fly crosses. (C) Relative abundance of aggregative tubulins of different sizes in (A); n = 4–5 flies/genotype from three independent fly crosses. (D) Quantification of the number of aggregative tubulins in (Fig. EV4A); n = 5–11 flies/genotype from three independent fly crosses. (E) Relative abundance of aggregative tubulins of different sizes in (Fig. EV4A); n = 5– 11 flies/genotype from three independent fly crosses. (F) Quantification of the number of aggregative tubulins in (Fig. EV4B); n = 3–6 flies/condition. (G) Relative abundance of aggregative tubulins of different sizes in (Fig. EV4B); n = 3–6 flies/condition. Data information: Error bars indicate mean ± SEM. Statistical analysis was performed using two-tailed Student’s t test. *P < 0.05, **P < 0.01, ***P < 0.001. Source data are available online for this figure.
Figure 6
Figure 6. Treatment of optimal concentration of Taxol rescued the morphological and functional defects in cell and aging fly.
(A) Representative confocal images of tubulin aggregation in the femur of 3-week-old heterozygous CRISPR-KI flies, K/M and K/R, with dInsc1407-Gal4 driving tubulin-mCherry (Red). Flies were treated with Taxol for 7 days, compared with vehicle control (DMSO). Yellow indicates the auto-fluorescence of cuticles. The FeCO neurons are encircled by the dashed line. Arrowheads indicate the aggregative tubulin. Scale bars: 5 µm. (B) Quantification of the number of aggregative tubulins in (A); n = 6 flies/condition. (C) Relative abundance of aggregative tubulins of different sizes in (A); n = 6 flies/condition. (D) Quantification of the relative intensity and colocalization of DAPI and PI in (Fig. EV4C), and comparing the results with the functional assay. The relative intensity is normalized with the vehicle control (DMSO) group; n = 18–28 flies/condition. (E) Immunostaining of hINSC-shRNA transfected SH-SY5Y cells and treated with DMSO and Taxol to visualize the neurite length compared with scramble-shRNA control. Red is phalloidin. Blue is DAPI staining. Scale bar: 20 µm. (F) Quantification of the mean neurite length in (E); n = 11–20 cells/condition from three independent technical replicates. (G) Immunostaining of hINSC-shRNA transfected SH-SY5Y cells and treated with DMSO (a vehicle control of Taxol) to visualize the colocalization of α-tubulin (red) and acetylated tubulin (green) compared with scramble-shRNA control. Blue is DAPI staining. Scale bars: 10 µm. (H) Pearson’s coefficient of colocalization of anti-α-tubulin (red) and anti-acetylated tubulin (green) fluorescence in (G); n = 12–41 cells/condition from three independent technical replicates. (I) Immunostaining of hINSC-shRNA transfected SH-SY5Y cells and treated with microtubule stabilizer Taxol to visualize the colocalization of α-tubulin (red) and acetylated tubulin (green) compared with scramble-shRNA control. Blue is DAPI staining. Scale bars: 10 µm. (J) Pearson’s coefficient of colocalization of anti-α-tubulin (red) and anti-acetylated tubulin (green) fluorescence in (I); n = 7–17 cells/condition from three independent technical replicates. Data information: Error bars indicate mean ± SEM. Statistical analysis was performed using two-tailed Student’s t test. *P < 0.05, **P < 0.01, ***P < 0.001. Source data are available online for this figure.
Figure EV1
Figure EV1. Expression of dInsc in FeCO neuron and its role in inducing tubulin aggregation.
(A) The patterns of UAS-mCD8-GFP driven by dInsc1407-Gal4 (left, same image in Fig. 2E) and Iav-Gal4 (right) in the leg. Green indicates mCD8-GFP and magenta indicates auto-fluorescence of the cuticle. Scale bars: 50 µm. (B) Representative confocal images of tubulin aggregation in the femur of 3-week-old dInsc1407-Gal4>UAS-dInsc-RNAi flies compared with UAS-LacZ control. Red indicates tubulin-mCherry. Scale bars: 50 µm. (C, D) Three-dimensional imaging of the femur of (D) dInsc1407-Gal4>dInsc-RNAi compared with (C) control flies. The intercellular mCherry fluorescence shows tubulin aggregation between muscle fibers. Red labeled tubulin, cyan labeled phalloidin (muscle fibers), and green indicate the auto-fluorescence of the cuticle. Arrowheads indicate the aggregative tubulin. Scale bars: 5 µm. (E) Representative confocal images of the adult brain of 3-week-old dInsc1407-Gal4>UAS-dInsc-RNAi compared with the UAS-LacZ control flies. Green indicates mCherry fluorescence. Magenta indicates anti-DLG. Scale bars: 50 µm. (F) Representative confocal images of tubulin aggregation in the FeCO neuron and the femur of 3-week-old dInsc1407-Gal4>dInsc-RNAi flies, compared with the control (UAS-lacZ) and the rescue (hINSCWT and hINSCM70R) groups. Red indicates tubulin tracker signals. Green indicates the auto-fluorescence of cuticles. The FeCO neurons are encircled by the dashed line. Scale bars: 5 µm.
Figure EV2
Figure EV2. Representative confocal images of DAPI and PI co-staining in K305M and K305R CRISPR-KI flies.
(A) Representative confocal images of FeCO neurons of 1- and 3-week-old dInsc+/K305R (K/R) and dInscK305R/K305R (R/R) flies, co-stained with PI (magenta) and DAPI (green), compared with dInsc+/K305M (K/M) and dInscK305M/K305M (M/M) CRISPR-KI flies. The FeCO neurons are encircled by the dashed line. Scale bar: 5 µm. (B) Representative confocal images of FeCO neurons of K/M and K/R flies overexpressing hINSCWT, hINSCM70R and dInscWT under the control of pan-neuronal elav-Gal4, co-stained with PI (magenta) and DAPI (green), compared with K/M and K/R CRISPR-KI flies, respectively. All flies are aged to 3 weeks. The FeCO neurons are encircled by the dashed line. Scale bar: 5 µm.
Figure EV3
Figure EV3. Both mRNA and protein level of R/R decrease in aging flies induced by PIL complex dysregulation.
(A) Relative mRNA abundance in whole fly extracts of M/M and R/R male flies with its corresponding K/K control in week 1 and week 3; n = 12 flies/genotype from 3 independent technical replicates. (B) Relative mRNA abundance in whole fly extracts of M/M and R/R female flies with its corresponding K/K control in week 1 and week 3; n = 12 flies/genotype from three independent technical replicates. (C) Representative western blotting of whole fly extracts from M/M and R/R flies with its corresponding K/K control in week 1 and week 3; n = 5 flies/genotype. (D) Co-immunoprecipitation to examine the association of FLAG-hINSC (WT and M70R) with MYC-LGN (left) or HA-PAR3 (right) in SH-SY5Y cells.
Figure EV4
Figure EV4. Taxol and Colchicine exert opposite effects on tubulin accumulation.
(A) Representative confocal images of tubulin aggregation in K/M and K/R of 1- and 3-week-old CRISPR-KI flies with dInsc1407-Gal4>UAS-tubulin-mCherry. Arrowheads indicate the aggregative tubulin. Scale bars: 5 µm. (B) Representative confocal images of tubulin aggregation (Red indicates tubulin-mCherry) in the femur of 3-week-old dInsc-RNAi, Baz-RNAi and Pins-RNAi flies under dInsc1407-Gal4. Flies were treated with DMSO (vehicle control), Taxol (microtubule-stabilizing agent) and Colchicine (microtubule-destabilizing agent). Yellow indicates the auto-fluorescence of cuticles. The FeCO neurons are encircled by the dashed line. Arrowheads indicate the aggregative tubulin. Scale bars: 5 µm. (C) Representative confocal images of FeCO neurons of K/M and K/R CRISPR-KI flies treated with three different concentrations (5 µM, 50 µM, 5 mM) of Taxol for 7 days, co-stained with PI (magenta) and DAPI (green), and compared with vehicle control (DMSO). The FeCO neurons are encircled by the dashed line. Scale bars: 5 µm.
Figure EV5
Figure EV5. The destabilization of microtubules caused by M70R mutation can be rescued with both microtubule-stabilizing agents and genetic manipulation.
(A) Representative confocal images of FeCO neurons of K/M and K/R 3-week flies treated with 0.5 mM of microtubule stabilizer Cevipabulin for 7 days, co-stained with PI (magenta) and DAPI (green), compared with vehicle control (DMSO). The FeCO neurons are encircled by the dashed line. Scale bars: 5 µm. Quantifications are shown in the lower panels. (B) The schematic of light-inducible microtubule disassembly system (MTDS) in a fly model. The dimerization of CRY2 and CIB can be induced by blue light. The CRY2 is fused with a microtubule-severing enzyme Spastin, and CIB is fused with microtubule-binding domain (MTBD). Dimerization upon blue light stimuli induces accumulation of Spastins on microtubules, which in turn induces disassembly of microtubules in MTDS-expressing cells. (C) Quantification of the climbing activity of Week 1 flies of UAS-MTDS (EtOH), UAS-MTDS (RU486), and UAS-MTDS, UAS-dInsc-WT (RU486) under the control of RU486-inducible pan-neuronal driver (elav-GS-Gal4) upon 48 h of blue light exposure, comparing with the conditional control (red light); n = 30 flies/genotypes from 3 independent fly crosses.

References

    1. Ackerley S, James PA, Kalli A, French S, Davies KE, Talbot K. A mutation in the small heat-shock protein HSPB1 leading to distal hereditary motor neuronopathy disrupts neurofilament assembly and the axonal transport of specific cellular cargoes. Hum Mol Genet. 2006;15:347–354. doi: 10.1093/hmg/ddi452. - DOI - PubMed
    1. Banerjee A, Wu S, Cheng L, Aw SS (2020) Fully automated leg tracking in freely moving insects using feature learning leg segmentation and tracking (FLLIT). J Vis Exp 158:e61012 - PubMed
    1. Betschinger J, Mechtler K, Knoblich JA. Asymmetric segregation of the tumor suppressor brat regulates self-renewal in Drosophila neural stem cells. Cell. 2006;124:1241–1253. doi: 10.1016/j.cell.2006.01.038. - DOI - PubMed
    1. Bhattacharya MRC, Gerdts J, Naylor SA, Royse EX, Ebstein SY, Sasaki Y, Milbrandt J, Diantonio A. A model of toxic neuropathy in Drosophila reveals a role for MORN4 in promoting axonal degeneration. J Neurosci. 2012;32:5054–5061. doi: 10.1523/JNEUROSCI.4951-11.2012. - DOI - PMC - PubMed
    1. Blair SS. Dissection of imaginal discs in Drosophila. CSH Protoc. 2007;2007:pdb.prot4794. - PubMed

MeSH terms