. 2024 May;25(5):2348-2374.
doi: 10.1038/s44319-024-00130-9. Epub 2024 Apr 8.

Lifelong absence of microglia alters hippocampal glutamatergic networks but not synapse and spine density

Affiliations

Lifelong absence of microglia alters hippocampal glutamatergic networks but not synapse and spine density

Michael Surala et al. EMBO Rep. 2024 May.

Abstract

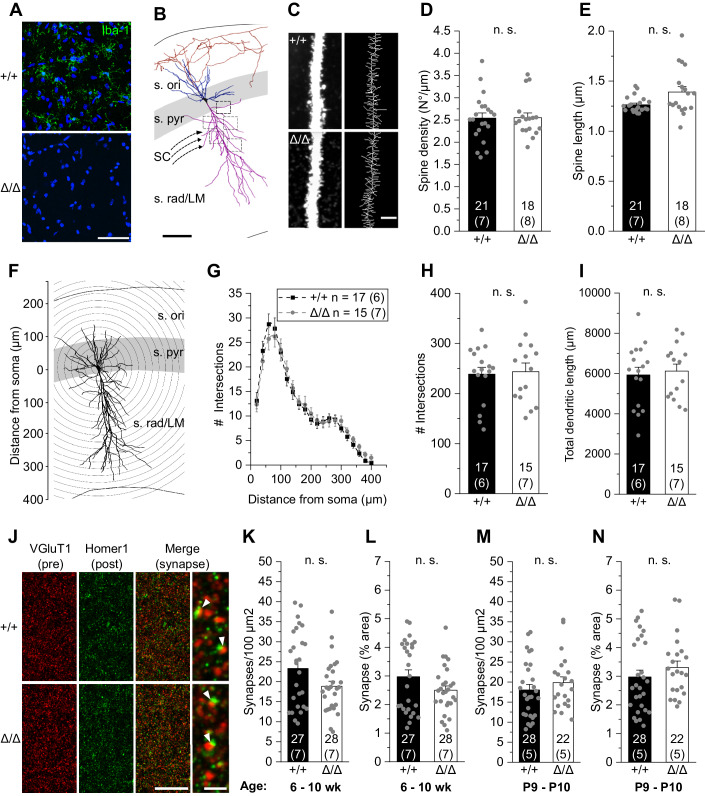
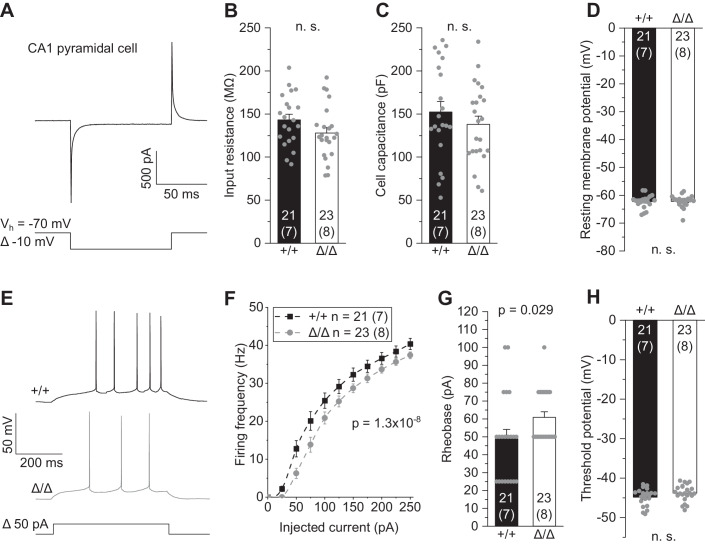
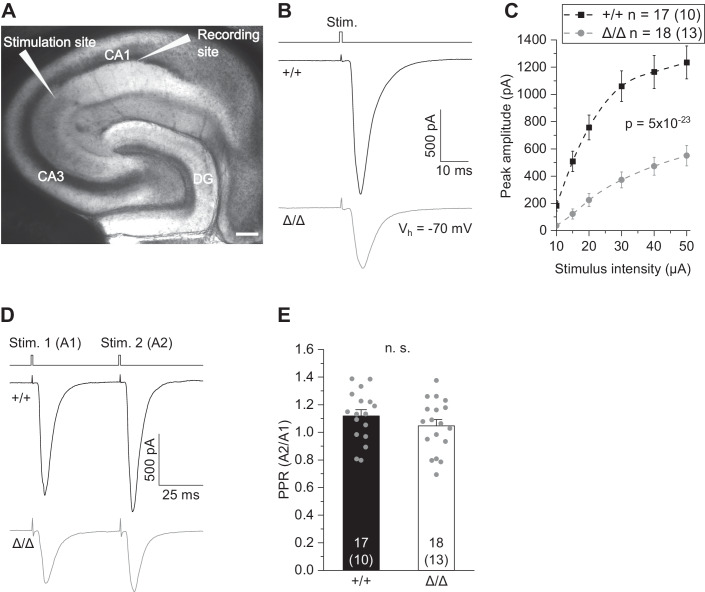
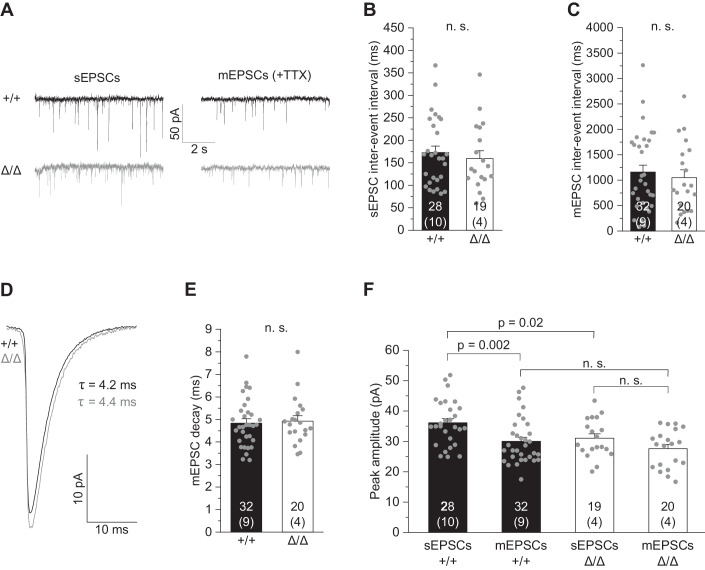
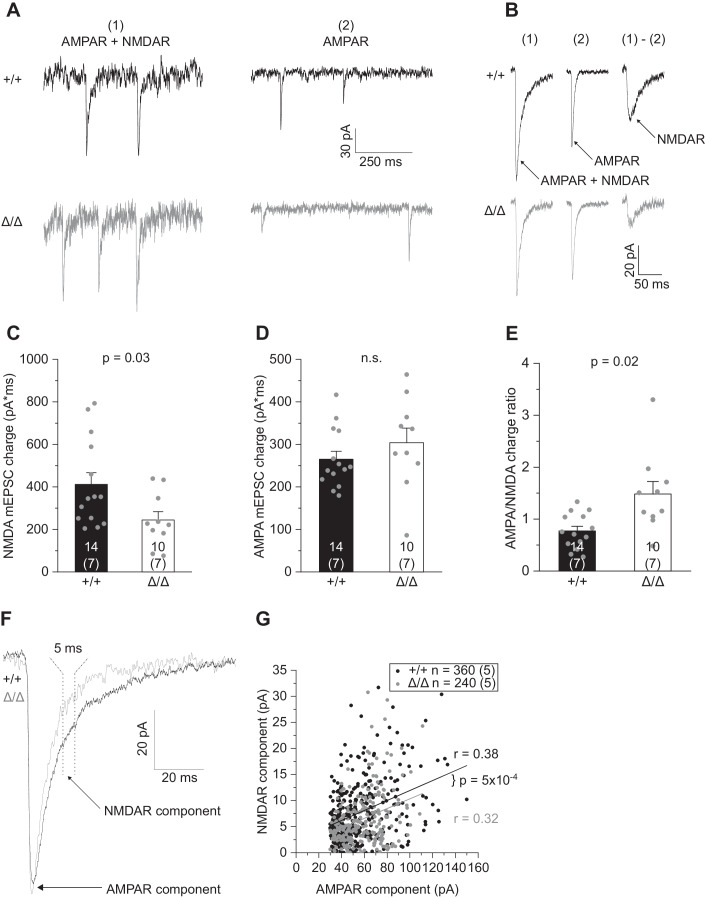
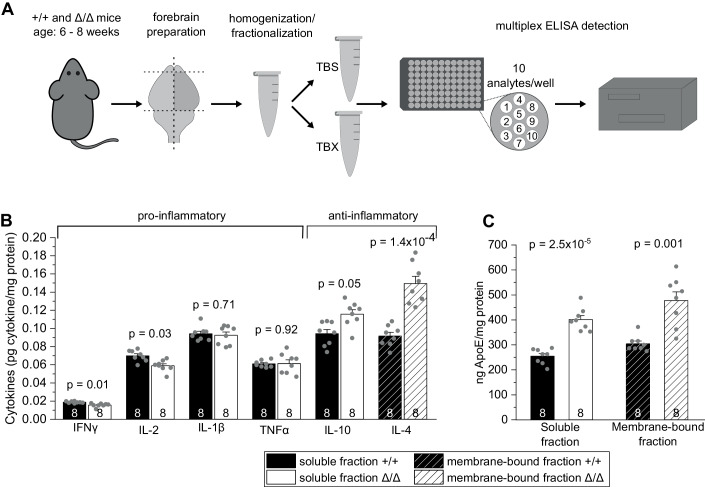
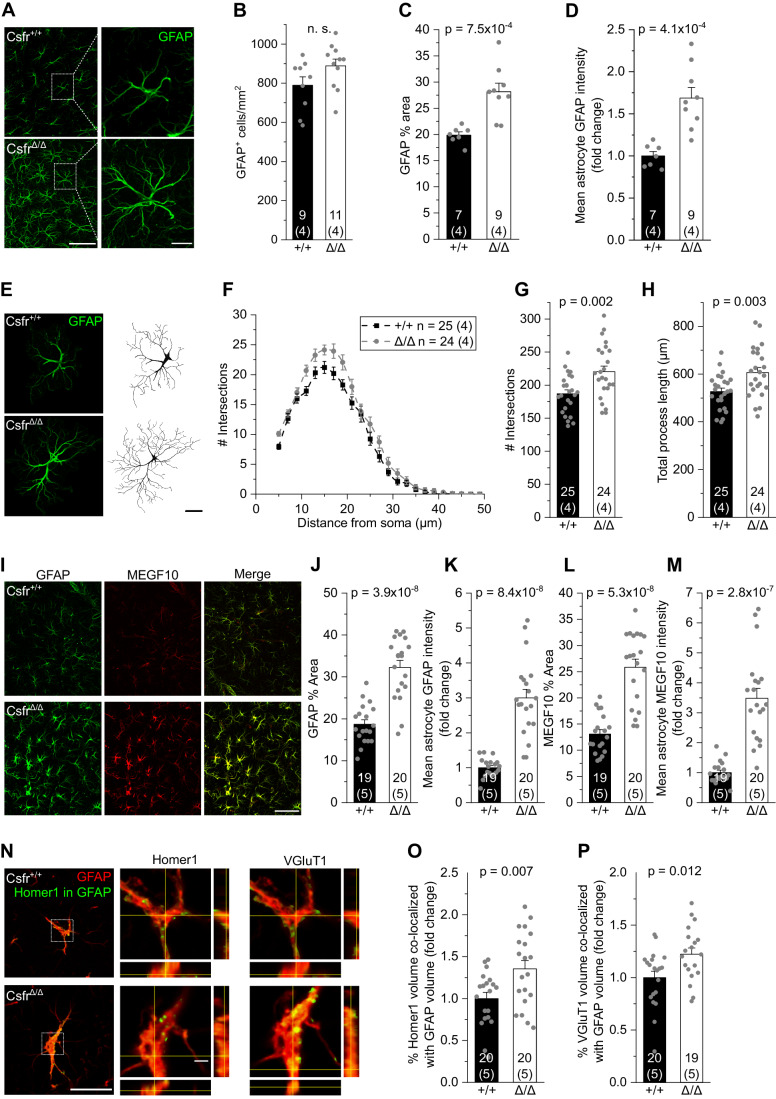
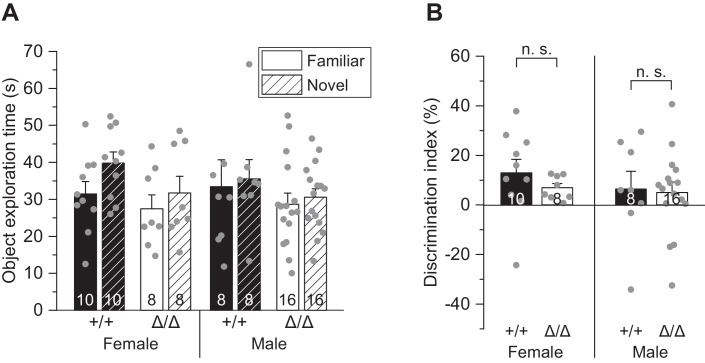
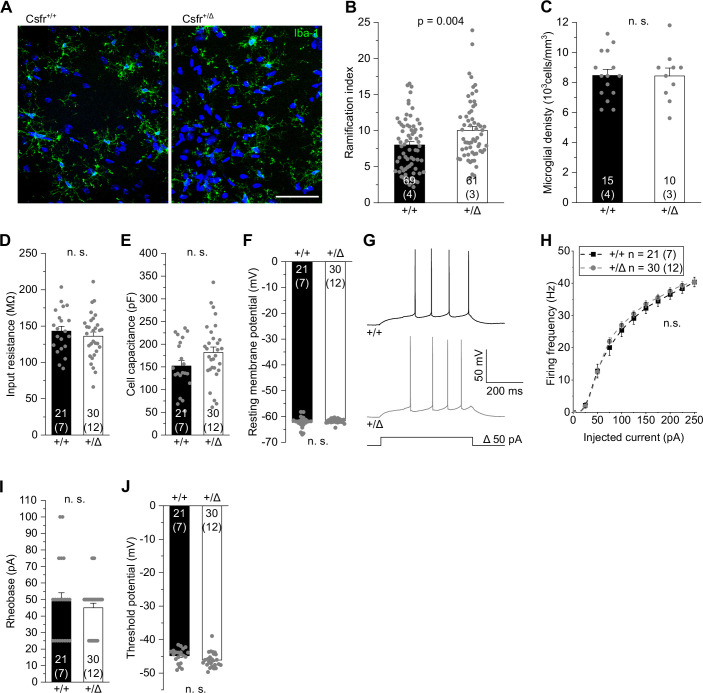
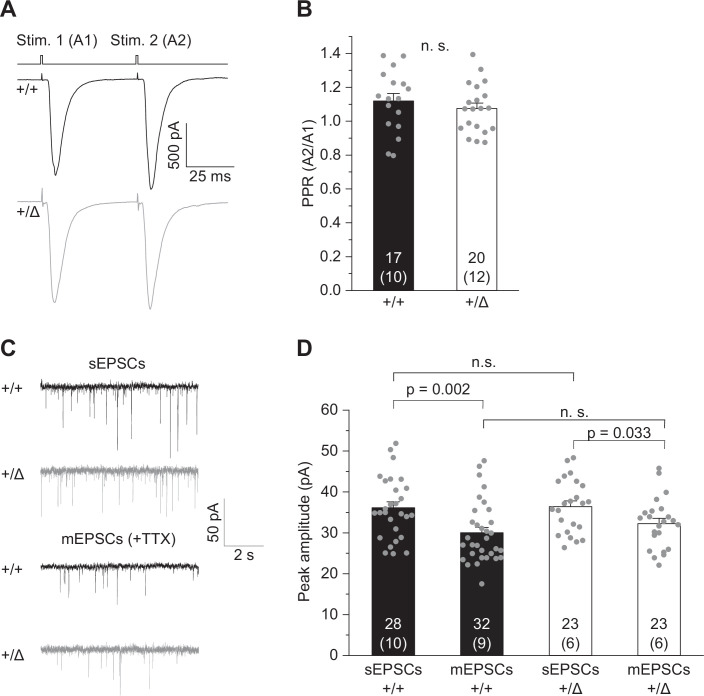
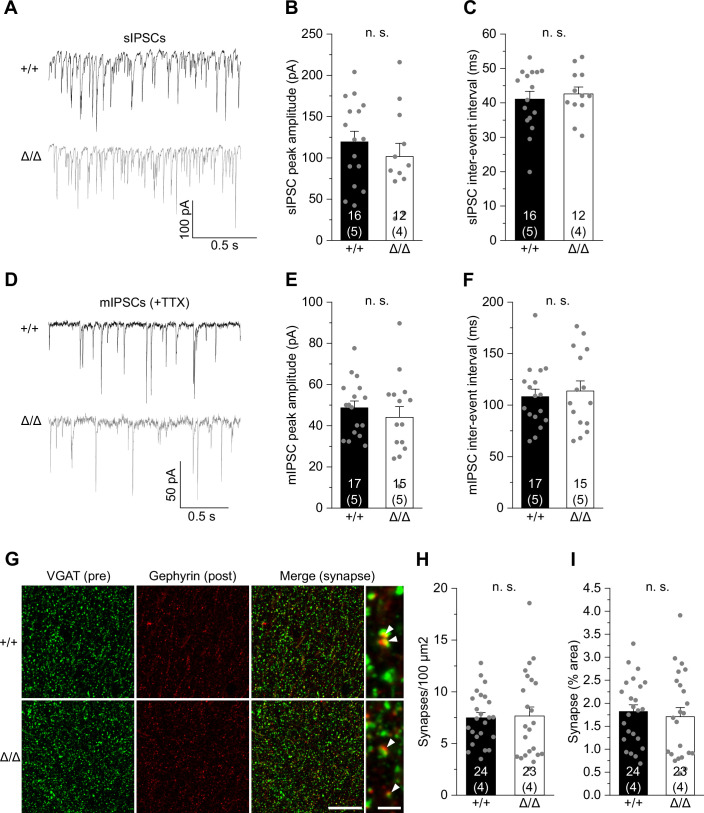
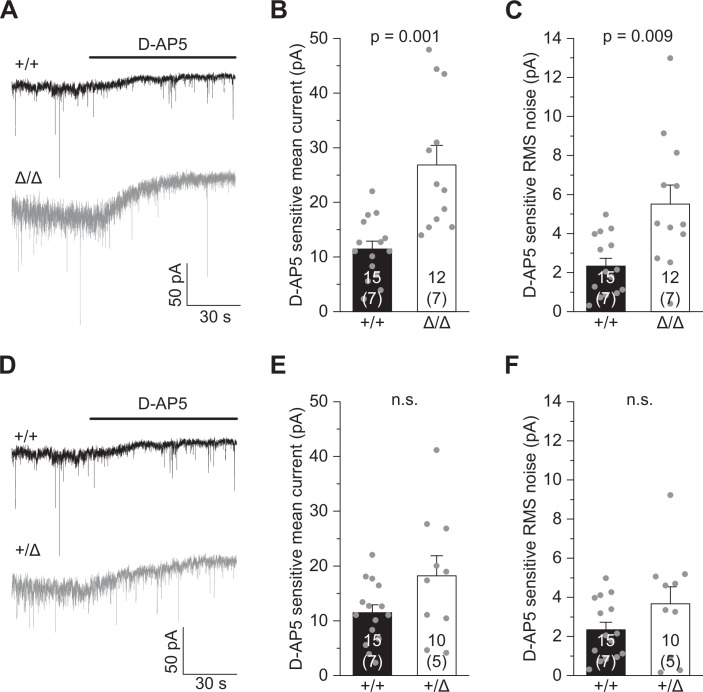
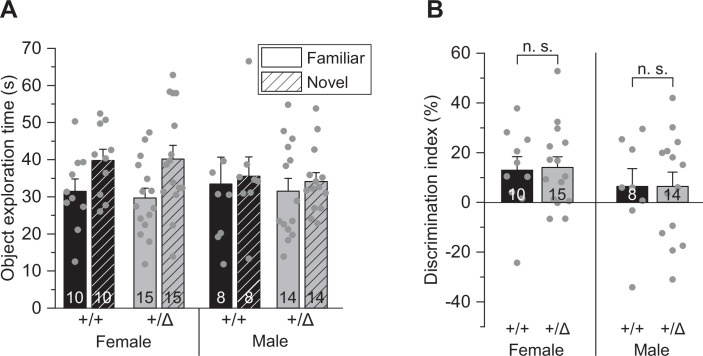
Microglia sculpt developing neural circuits by eliminating excess synapses in a process called synaptic pruning, by removing apoptotic neurons, and by promoting neuronal survival. To elucidate the role of microglia during embryonic and postnatal brain development, we used a mouse model deficient in microglia throughout life by deletion of the fms-intronic regulatory element (FIRE) in the Csf1r locus. Surprisingly, young adult Csf1rΔFIRE/ΔFIRE mice display no changes in excitatory and inhibitory synapse number and spine density of CA1 hippocampal neurons compared with Csf1r+/+ littermates. However, CA1 neurons are less excitable, receive less CA3 excitatory input and show altered synaptic properties, but this does not affect novel object recognition. Cytokine profiling indicates an anti-inflammatory state along with increases in ApoE levels and reactive astrocytes containing synaptic markers in Csf1rΔFIRE/ΔFIRE mice. Notably, these changes in Csf1rΔFIRE/ΔFIRE mice closely resemble the effects of acute microglial depletion in adult mice after normal development. Our findings suggest that microglia are not mandatory for synaptic pruning, and that in their absence pruning can be achieved by other mechanisms.

Keywords: Brain Development; Electrophysiology; Hippocampus; Microglia; Synapses.


Conflict of interest statement

The authors declare no competing interests.

Figures

Figure 1
Figure 1. Absence of microglia has no effect on CA1 excitatory synapse number, spine density, and morphology.
(A) Specimen confocal images illustrating the lack of microglia by Iba1 immunoreactivity (green) in acute hippocampal slices of Csf1rΔFIRE/ΔFIRE (Δ/Δ) compared to WT littermates (+/+). DAPI labeling of cellular nuclei in blue. Scale bar, 50 µm. (B) 3D reconstruction of a biocytin-filled CA1 pyramidal cell (black, cell body; blue, basal dendrite; magenta, apical dendrite; red, axon), depicting the excitatory input via the Schaffer collaterals (SC) and hippocampal layers. (s. ori—stratum oriens, s. pyr— stratum pyramidale, s. rad/LM—stratum radiatum/lacunosum-moleculare). Squared boxes indicate five different apical regions of interest for spine analysis. Individual values were averaged to obtain a grand average per cell. Scale bar, 50 µm. (C) Representative segments of apical dendrites at high power (left) from which skeletonized branches were generated (right). Scale bar, 3 µm. (D, E) Analysis of mean apical spine density (D) and spine length (E). (F) Schematic representation of Sholl analysis of a biocytin-filled CA1 pyramidal cell. Number of intersections between dendrites and concentric spheres centered around the soma was determined at increasing distances with 20 μm increments. (GI) Sholl analysis-derived values of the number of intersections with Sholl radii at increasing distance from the soma (G) and resulting total number of intersections (H) and total dendritic length (I) of CA1 pyramidal cells. (J) Confocal images showing VGluT1-labeled presynaptic puncta (red) and Homer1-labeled postsynaptic puncta (green) in the CA1 stratum radiatum. The merged image and expanded view on the right show excitatory synapses as colocalized puncta (arrowheads). Scale bars, 20 µm and 2 µm (for expanded view). (KN) Quantification of colocalized puncta (excitatory synapses) per 100 µm2 and their area covered of mice aged 6–10 weeks (K, L) and 9–10 days (M, N). Data information: Data indicate mean ± SEM. Numbers on bars show tested cells (CI) or number of slices (KN) and (number of animals). P values are from unpaired Student’s t (H, I, K, M) or Mann–Whitney tests (D, E, L, N). Source data are available online for this figure.
Figure 2
Figure 2. Absence of microglia results in reduced excitability of CA1 pyramidal cells.
(A) Patch-clamped membrane current of a CA1 pyramidal cell to a brief 10 mV hyperpolarization from which values for input resistance and cell capacitance were determined (see “Methods”). (BD) Quantification of input resistance (B), cell capacitance (C) and resting membrane potential (D) of CA1 pyramidal cells in Δ/Δ and +/+ mice. (E) Specimen traces showing action potential firing patterns of CA1 pyramidal cells in response to 500 ms depolarizing current injections. (F) Corresponding course of action potential firing frequencies on increasing depolarizations. (G, H) Values for rheobase, i.e., minimal current to reach action potential threshold, (G) and action potential threshold voltage (H). Data information: Data are represented as mean ± SEM. Numbers on bars indicate tested cells and (number of animals). P values are from unpaired Student’s t (BD, H), or Mann–Whitney tests (G) and two-way ANOVA (F). Source data are available online for this figure.
Figure 3
Figure 3. Reduced CA3–CA1 glutamatergic transmission in Csf1rΔFIRE/ΔFIRE mice.
(A) Differential interference contrast image showing the localization of CA3 stimulation and CA1 recording sites. Scale bar, 200 µm. (CA1, CA3: cornu ammonis regions 1 and 3; DG: dentate gyrus). (B) Specimen traces of excitatory postsynaptic currents (EPSC) in CA1 pyramidal cells in response to electrical stimulation for 0.2 ms. (C) Corresponding input–output relationship showing peak amplitudes of CA1 EPSCs with increasing stimulation strength. (D) Example traces (EPSC) in CA1 pyramidal cells after paired-pulse stimulation at 50 ms inter-stimulus intervals. (E) Comparison of paired-pulse ratios (PPR) as the quotient of the second vs first EPSC amplitude (A2/A1) of CA1 pyramidal cells. Data information: Data show mean ± SEM. Numbers on bars indicate tested cells and (the number of animals). P values are from two-way ANOVA (C) and unpaired Student’s t test (E). Source data are available online for this figure.
Figure 4
Figure 4. Absence of microglia causes deficits in excitatory synaptic transmission.
(A) Specimen traces showing AMPAR-mediated spontaneous EPSCs (sEPSCs) and miniature EPSCs (mEPSCs) in the presence of 300 nM TTX of CA1 pyramidal cells. (B, C) Comparison of inter-event intervals of sEPSCs (B) and mEPSCs (C). (D) Specimen traces showing average mEPSCs kinetics of CA1 pyramidal cells. (E) Analysis of decay times of CA1 mEPSCs (AMPA receptor-evoked currents). (F) Comparison of peak amplitudes of sEPSCs and mEPSCs. Note that mEPSC amplitudes are not different amongst genotypes, suggesting no change in functional synaptic contacts, whereas action potential-dependent sEPSC amplitudes are larger in +/+ but not in Δ/Δ mice, indicating impairment in synaptic multiplicity in the latter. Data information: Data indicate mean ± SEM. Numbers on bars show tested cells and (the number of animals). P values are from unpaired Student’s t [C, E, F (for Δ/Δ and sEPSC comparison)] or Mann–Whitney tests [B, F (for +/+ and mEPSC comparison)]. Source data are available online for this figure.
Figure 5
Figure 5. Absence of microglia results in reduced synaptic NMDA receptor component in CA1 pyramidal cells.
(A) Specimen traces showing dual-component mEPSCs comprising AMPAR- and NMDAR-evoked currents measured in nominally Mg2+-free extracellular solution in the presence of 300 nM TTX, 10 μM gabazine and 10 μM glycine (left), and pharmacologically isolated AMPAR-only mEPSCs after blockade of NMDARs with 50 µM D-AP5 (right). (B) Average dual-component (1) and AMPAR-only (2) mEPSCs from which the synaptic NMDAR component was calculated by subtracting (1) – (2). (CE) Comparison of the NMDAR- (C) and AMPAR-mediated mEPSC charge (D) and the resulting AMPA/NMDA charge ratio (E). (F) Specimen traces showing individual dual-component mEPSCs containing both AMPAR and NMDAR components. Arrows indicate where respective currents were measured. (G). Correlation between the AMPA and NMDA measurements of individual mEPSCs comprising 40 events per cell. Data information: Data are represented as mean ± SEM. Numbers on bars indicate tested cells and (the number of animals). P values are from unpaired Student’s t test (D, E), Mann–Whitney test (C) or ANCOVA (G, co-variant: AMPA peak amplitude). R values refer to Pearson correlation coefficients. Source data are available online for this figure.
Figure 6
Figure 6. Absence of microglia changes cytokine and ApoE levels in the brain.
(A) Workflow illustrating the ELISA-based detection of brain cytokines and ApoE in soluble (TBS) and membrane-bound (TBX) fractions from cortical brain homogenates (see “Methods”). (B, C) Comparison of basal levels of anti- and pro-inflammatory cytokines (B) and apolipoprotein E (ApoE) (C) in soluble and membrane-bound fractions in Δ/Δ mice and +/+ mice. Data information: Data are represented as mean ± SEM. Numbers on bars indicate the number of animals. P values are from unpaired Student’s t tests corrected for multiple comparisons. Source data are available online for this figure.
Figure 7
Figure 7. Absence of microglia results in reactive astrocytes.
(A) Specimen confocal images illustrating astrocytes in 6–10-week-old mice by GFAP immunoreactivity (green) in the CA1 stratum radiatum. Scale bars, 50 µm and 10 µm (for expanded view). (BD) Analyses of GFAP+ cell density (B), percentage of area covered by GFAP+ astrocytes (C) and mean GFAP intensity (D). (E) Specimen confocal images illustrating astrocyte morphology by GFAP immunoreactivity (left) and their 3D reconstruction (right). Scale bar, 10 µm. (FH) Sholl analysis-derived values of the number of intersections with Sholl radii at increasing distance from the soma (F) and the resulting total number of intersections (G) and total process length (H) of astrocytes. (I) Specimen confocal images illustrating astrocytes by GFAP (green) and MEGF10 (red) immunoreactivity in the CA1 stratum radiatum of mice aged P22-23. Scale bar, 50 µm. (JM) Analyses of the percentage of area covered by GFAP+ astrocytes (J), mean GFAP intensity (K), area covered by MEGF10+ astrocytes (L) and mean MEGF10 intensity (M). (N) Left: Specimen confocal images showing Homer1 signal (green) within GFAP+ astrocytes (red). Middle and right: Close-up images of astrocytes with orthogonal projections at the level of the crosshairs showing Homer1 (middle) or VGluT1 (right) signal within GFAP+ astrocytes. Scale bars, 20 µm and 2 µm (for orthogonal projections). (O, P) Quantification of volume (%) of Homer1 (O) and VGluT1 (P) signal co-localizing with GFAP volume. Data information: Age of mice was 6–10 weeks (AH) and P22–P23 (IP) Data are represented as mean ± SEM. Numbers on bars indicate number of slices and (number of animals). P values are from unpaired Student’s t tests. Source data are available online for this figure.
Figure 8
Figure 8. Absence of microglia does not alter object recognition memory.
(A) Comparison of exploration times of the familiar and novel object after habituation for male and female Δ/Δ and +/+ mice (see “Methods”). (B) Comparison of the respective discrimination indices (see “Methods”). Data information: Data are represented as mean ± SEM. Numbers on bars indicate number of tested animals. P values are from two-way ANOVA (B). Source data are available online for this figure.
Figure EV1
Figure EV1. Normal excitability of CA1 pyramidal cells in heterozygous Csf1r+/ΔFIRE mice.
(A) Specimen confocal images illustrating microglia by Iba1 immunoreactivity (green) in acute hippocampal slices of Csf1r+/ΔFIRE (+/Δ) and WT littermates (+/+). DAPI labeling of cellular nuclei in blue. Scale bar, 50 µm. (B, C) Quantification of microglial ramification (B) and cell density (C) in the CA1 stratum radiatum. (DF) Analysis of input resistance (D), cell capacitance (E) and resting membrane potential (F) of CA1 pyramidal cells. (G) Specimen traces showing action potential firing patterns of CA1 pyramidal cells in response to 500 ms depolarizing current injections. (H). Corresponding course of action potential firing frequencies of CA1 pyramidal cells on increasing depolarizations. (I, J) Values for rheobase (I) and action potential threshold voltage (J). Data information: Data indicate mean ± SEM. Numbers on bars show tested cells or number of slices (C) and (number of animals). P values are from unpaired Student’s t (BF, J) or Mann–Whitney tests (I) and two-way ANOVA (H).
Figure EV2
Figure EV2. Normal glutamatergic transmission in heterozygous Csf1r+/ΔFIRE mice.
(A) Example traces (EPSCs) of CA1 pyramidal cells after paired-pulse stimulation at 50 ms inter-stimulus intervals. (B) Comparison of paired-pulse ratios (PPR) as the quotient of the second vs first EPSC amplitude (A2/A1) of CA1 pyramidal cells. (C) Specimen traces showing AMPAR-mediated spontaneous EPSCs (sEPSCs) and miniature EPSCs (mEPSCs) in the presence of 300 nM TTX of CA1 pyramidal cells. (D) Comparison of peak amplitudes of sEPSCs and mEPSCs. Data information: Data are represented as mean ± SEM. Numbers on bars indicate tested cells and (number of animals). P values are from unpaired Student’s t (B, D, for +/Δ and sEPSC comparison) or Mann–Whitney tests (D, for +/+ and mEPSC comparison).
Figure EV3
Figure EV3. Unaltered inhibitory synaptic transmission of CA1 pyramidal cells in Csf1rΔFIRE/ΔFIRE mice.
(A) Specimen traces showing GABAA receptor-evoked spontaneous inhibitory postsynaptic currents (sIPSCs) of CA1 pyramidal cells in +/+ and Δ/Δ mice. (B, C) Comparison of sIPSC peak amplitudes (B) and inter-event intervals (C). (D) Specimen traces showing miniature IPSCs (mIPSCs) of CA1 pyramidal cells. (E, F) Comparison of peak amplitudes (E) and inter-event intervals (F). (G) Confocal images showing VGAT-labeled presynaptic puncta (green) and Gephyrin-labeled postsynaptic puncta (red) in the CA1 stratum radiatum (left and middle) and colocalization of puncta (right, arrowheads). Scale bars, 20 µm and 2 µm (for expanded view). (H, I) Quantification of colocalized puncta (inhibitory synapses) per 100 µm2 (H) and their area covered (I). Data information: Data indicate mean ± SEM. Numbers on bars show tested cells and (number of animals). P values are from unpaired Student’s t (B, C, E, F, I) and Mann–Whitney (H) tests.
Figure EV4
Figure EV4. Increased tonic NMDA current in Csf1rΔFIRE/ΔFIRE mice.
(A) Example traces showing changes in holding current after application of 50 µM D-AP5 for Δ/Δ compared with +/+ mice, reflecting blockade of all tonic NMDAR-mediated currents in CA1 pyramidal cells. Measurements were done in nominally Mg2+-free extracellular solution in the presence of 300 nM TTX and 10 μM glycine. (B, C) Comparison of the D-AP5-sensitive mean holding current (B) and root mean square (RMS) noise (C) for the different genotypes. Note the contribution of both synaptic and extrasynaptic NMDA receptors to these parameters. (DF) Same as for (AC), but comparison of wild-type (+/+) and heterozygous phenotype (+/Δ). Data information: Data are represented as mean ± SEM. Numbers on bars indicate tested cells and (number of animals). P values are from unpaired Student’s t tests.
Figure EV5
Figure EV5. Unaltered object recognition memory in heterozygous Csf1r+/ΔFIRE mice.
(A) Comparison of exploration times of the familiar and novel object after habituation for male and female +/Δ and +/+ mice. (B) Comparison of the respective discrimination indices (see “Methods”). Data information: Data are represented as mean ± SEM. Numbers on bars indicate number of tested animals. P values are from two-way ANOVA (B).

References

    1. Aarum J, Sandberg K, Haeberlein SLB, Persson MAA. Migration and differentiation of neural precursor cells can be directed by microglia. Proc Natl Acad Sci USA. 2003;100:15983–15988. doi: 10.1073/pnas.2237050100. - DOI - PMC - PubMed
    1. Antony JM, Paquin A, Nutt SL, Kaplan DR, Miller FD. Endogenous microglia regulate development of embryonic cortical precursor cells. J Neurosci Res. 2011;89:286–298. doi: 10.1002/jnr.22533. - DOI - PubMed
    1. Askew K, Gomez-Nicola D. A story of birth and death: Insights into the formation and dynamics of the microglial population. Brain Behav Immun. 2018;69:9–17. doi: 10.1016/j.bbi.2017.03.009. - DOI - PubMed
    1. Attardo A, Fitzgerald JE, Schnitzer MJ. Impermanence of dendritic spines in live adult CA1 hippocampus. Nature. 2015;523:592–596. doi: 10.1038/nature14467. - DOI - PMC - PubMed
    1. Badimon A, Strasburger HJ, Ayata P, Chen X, Nair A, Ikegami A, Hwang P, Chan AT, Graves SM, Uweru JO, et al. Negative feedback control of neuronal activity by microglia. Nature. 2020;586:417–423. doi: 10.1038/s41586-020-2777-8. - DOI - PMC - PubMed

MeSH terms

LinkOut - more resources