. 2024 Apr 8;22(1):337.
doi: 10.1186/s12967-024-05164-0.

Wnt, glucocorticoid and cellular prion protein cooperate to drive a mesenchymal phenotype with poor prognosis in colon cancer

Affiliations

Wnt, glucocorticoid and cellular prion protein cooperate to drive a mesenchymal phenotype with poor prognosis in colon cancer

Sophie Mouillet-Richard et al. J Transl Med. .

Abstract

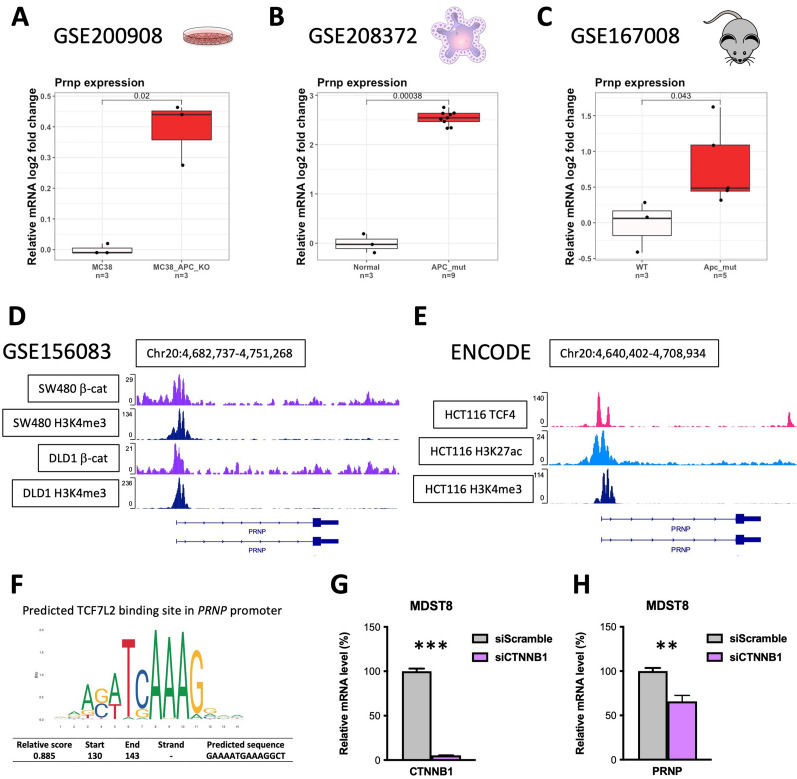
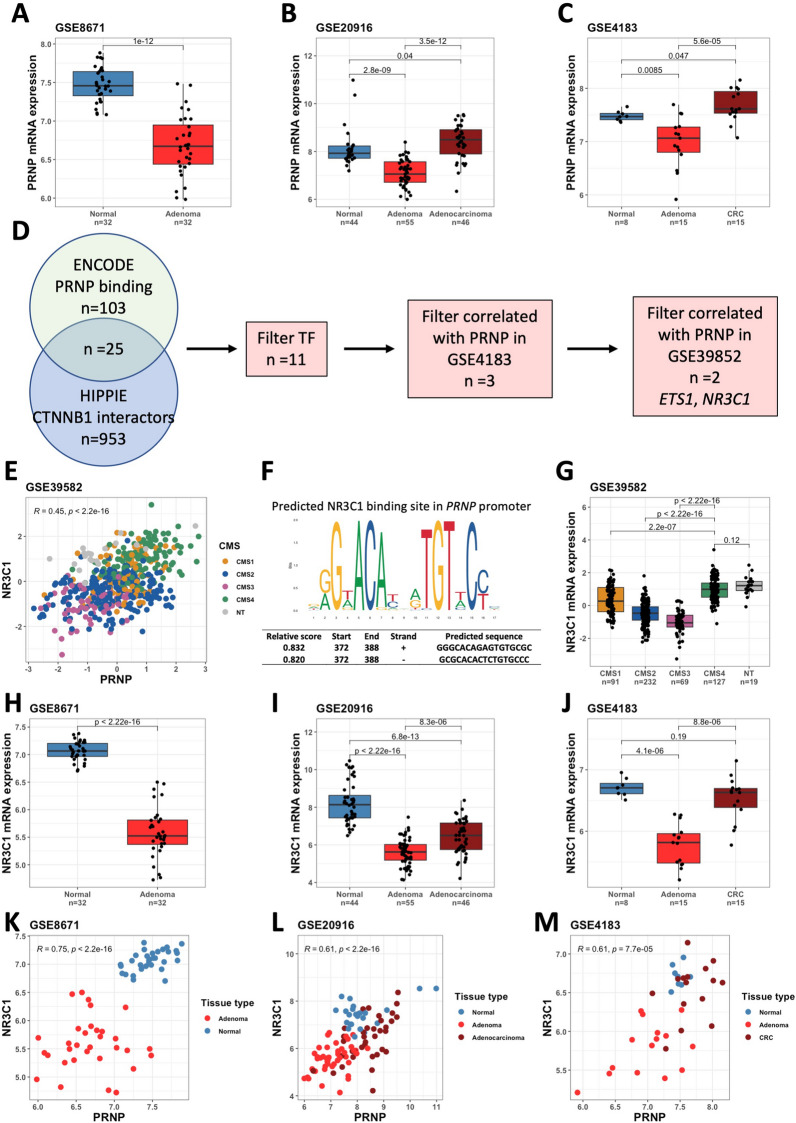
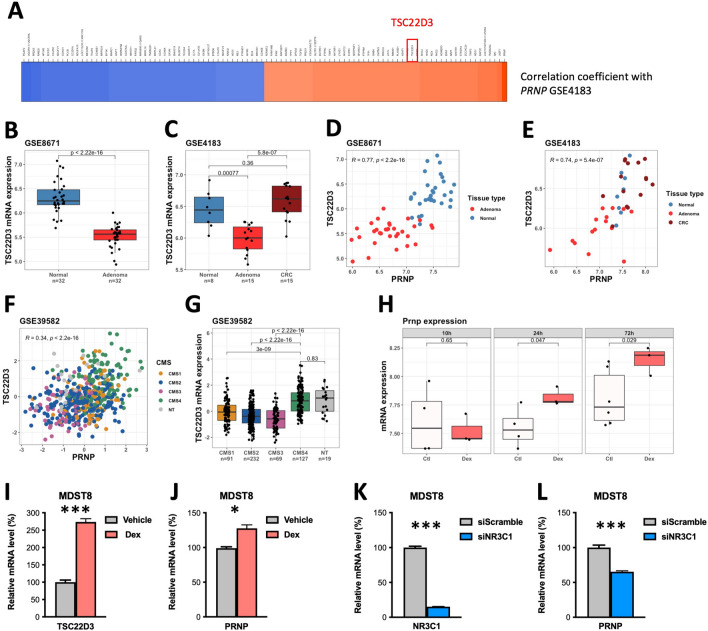
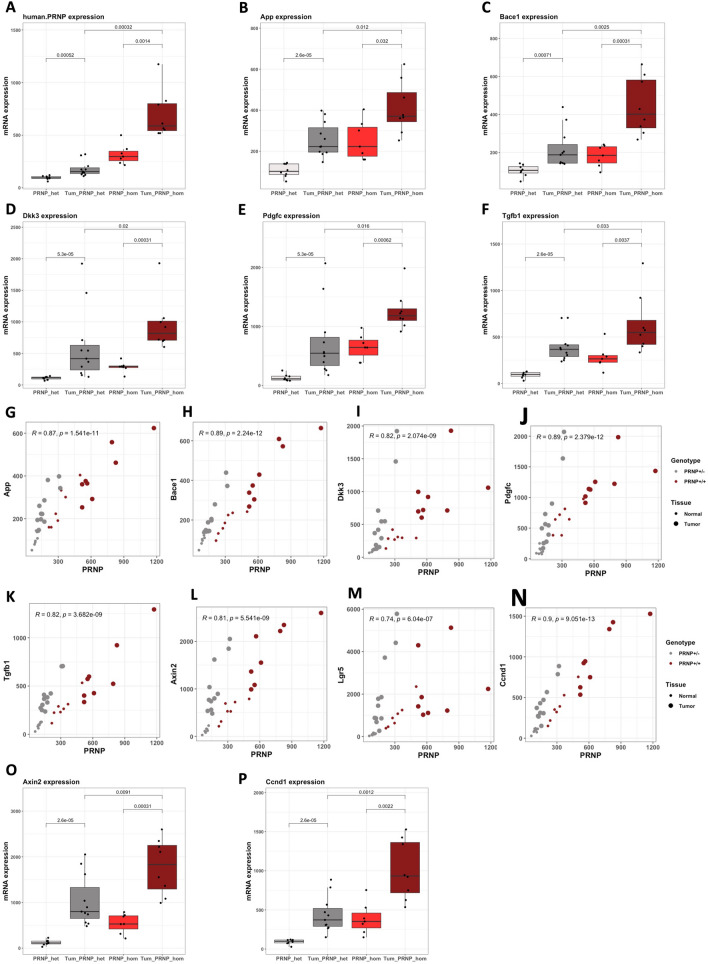
Background: The mesenchymal subtype of colorectal cancer (CRC), associated with poor prognosis, is characterized by abundant expression of the cellular prion protein PrPC, which represents a candidate therapeutic target. How PrPC is induced in CRC remains elusive. This study aims to elucidate the signaling pathways governing PrPC expression and to shed light on the gene regulatory networks linked to PrPC.

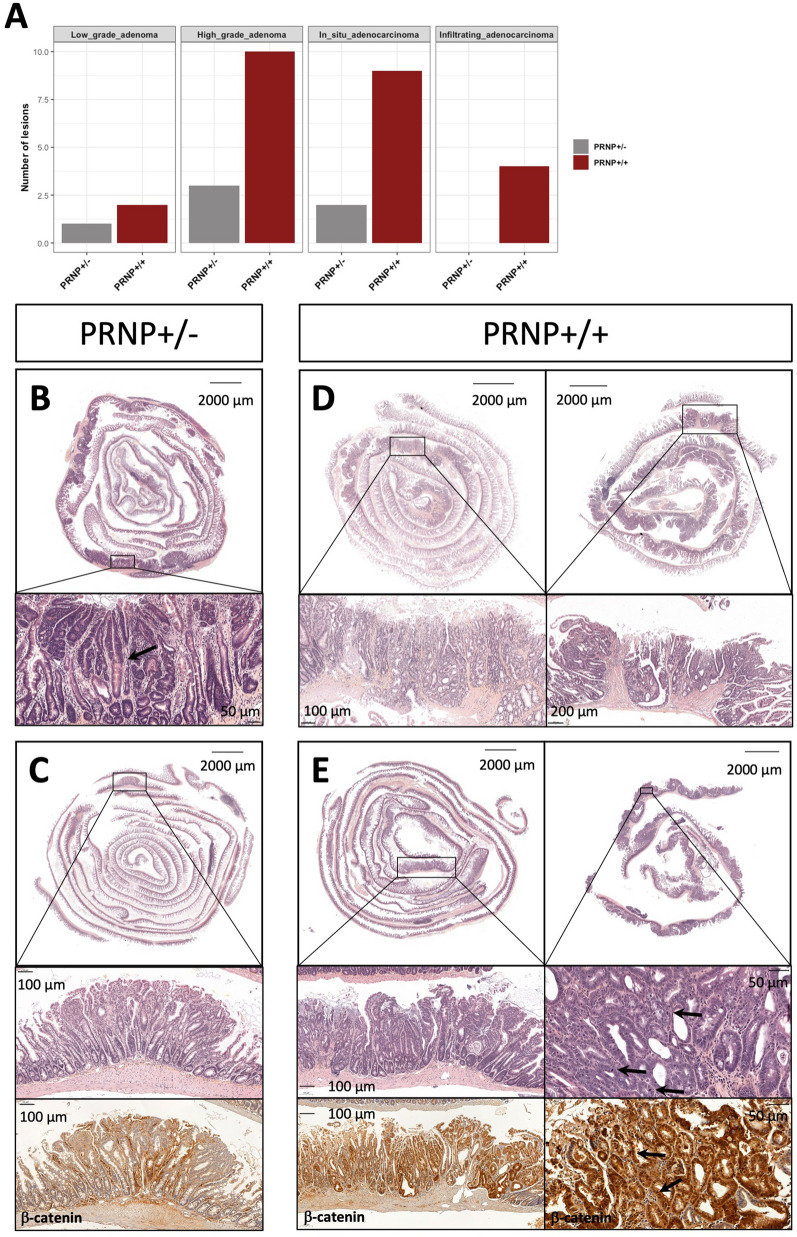
Methods: We performed in silico analyses on diverse datasets of in vitro, ex vivo and in vivo models of mouse CRC and patient cohorts. We mined ChIPseq studies and performed promoter analysis. CRC cell lines were manipulated through genetic and pharmacological approaches. We created mice combining conditional inactivation of Apc in intestinal epithelial cells and overexpression of the human prion protein gene PRNP. Bio-informatic analyses were carried out in two randomized control trials totalizing over 3000 CRC patients.

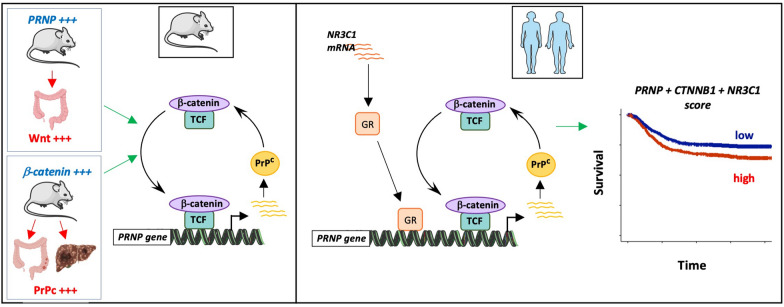
Results: In silico analyses combined with cell-based assays identified the Wnt-β-catenin and glucocorticoid pathways as upstream regulators of PRNP expression, with subtle differences between mouse and human. We uncover multiple feedback loops between PrPC and these two pathways, which translate into an aggravation of CRC pathogenesis in mouse. In stage III CRC patients, the signature defined by PRNP-CTNNB1-NR3C1, encoding PrPC, β-catenin and the glucocorticoid receptor respectively, is overrepresented in the poor-prognosis, mesenchymal subtype and associates with reduced time to recurrence.

Conclusions: An unleashed PrPC-dependent vicious circle is pathognomonic of poor prognosis, mesenchymal CRC. Patients from this aggressive subtype of CRC may benefit from therapies targeting the PRNP-CTNNB1-NR3C1 axis.

Keywords: Colon cancer; Glucocorticoid receptor; Molecular classification; Prion protein; Wnt-β-catenin.


Conflict of interest statement

The authors declare no competing interests in the present study.

Figures

Fig. 1
Fig. 1
The PRNP gene is a target of Wnt-β-catenin signaling in colon cancer models. A–C Analysis of the GSE200908 (A) GSE208372 (B) and GSE167008 (C) datasets reveals increased Prnp expression in cellular, organoid and in vivo mouse models of Apc inactivation. D Analysis of the GSE156083 ChIPseq dataset reveals enrichment of β-catenin and the H3K4me3 active histone mark at the promoter of the PRNP gene in SW480 and DLD-1 human colon cancer cell lines. E Analysis from the ENCODE database reveals binding of the TCF7L2-encoded TCF4 factor, together with the H3K27ac and H3K4me3 active histone marks at the promoter of the PRNP gene in the HCT116 human colon cancer cell line. F Predicted TCF7L2 binding site within the human PRNP gene promoter. G, H Relative mRNA levels of CTNNB1 (G) and PRNP (H) in CTNNB1-silenced versus control MDST8 cells, as determined in qPCR analysis. Results are expressed as means of n = 2 independent triplicates of cell preparations ± s.e.m. (***p < 0.001, **p < 0.01, Student’s t-test)
Fig. 2
Fig. 2
The GR encoded by the NR3C1 gene is predicted to regulate PRNP gene expression in human CRC. A–C Analysis of the GSE8671 (A) GSE20916 (B) and GSE4183 (C) datasets reveals decreased PRNP expression across the normal to adenoma sequence, followed by an increase from the adenoma to carcinoma sequence in human CRC. D Schematic representation of the selection of ETS1 and NR3C1 as candidate transcription factors regulating the expression of PRNP in human CRC. E Scatter plot showing the correlation between PRNP and NR3C1 mRNA levels in the GSE39582 dataset of human CRC. F Predicted NR3C1 binding sites within the human PRNP gene promoter. G Relative NR3C1 mRNA levels according to the CMS classification in the GSE39582 dataset of human CRC. NT = non tumor. H–J Analysis of the GSE8671 (H) GSE20916 (I) and GSE4183 (J) datasets reveals decreased NR3C1 expression across the normal to adenoma sequence, followed by an increase from the adenoma to carcinoma sequence in human CRC. K–M Scatter plots showing the correlation between PRNP and NR3C1 mRNA levels in GSE8671 (K) GSE20916 (L) and GSE4183 (M) datasets
Fig. 3
Fig. 3
PRNP gene expression is regulated by the GR in human CRC. A Heatmap showing the top 20 positively (in red) and negatively (in blue) correlated genes to PRNP expression in the GSE4183 dataset. Highlighted is the GR target TSC22D3. B, C Analysis of the GSE8671 (B) and GSE4183 (C) datasets reveals decreased TSC22D3 expression across the normal to adenoma sequence, followed by an increase from the adenoma to carcinoma sequence in human CRC. D, E Scatter plots showing the correlation between PRNP and TSC22D3 mRNA levels in GSE8671 (D) and GSE4183 (E) datasets. F Scatter plot showing the correlation between PRNP and TSC22D3 mRNA levels in the GSE39582 dataset of human CRC. G Relative TSC22D3 mRNA levels according to the CMS classification in the GSE39582 dataset of human CRC. NT = non tumor. H Boxplots showing the time-dependent increase in Prnp expression in oligodendrocyte progenitor cells (OPCs) exposed to Dexamethasone (Dex) (GSE11406 dataset). I, J Relative mRNA levels of TSC22D3 (I) and PRNP (J) in MDST8 cells exposed to Dex (1 µM, 24 h) versus vehicle (water), as determined in qPCR analysis. n = 3 cell preparations per condition. (***p < 0.001, *p < 0.05, Student’s t-test). K, L Relative mRNA levels of NR3C1 (K) and PRNP (L) in NR3C1-silenced versus control MDST8 cells, as determined in qPCR analysis. n = 2 independent triplicates of cell preparations. (***p < 0.001, Student’s t-test)
Fig. 4
Fig. 4
PrPC sustains a vicious circle in an oncogenic Apc mouse model. A–F Boxplots showing the mRNA levels of human PRNP (A), and mouse App (B), Bace1 (C), Dkk3 (D), Pdgfc (E) and Tgfb1 (F) in normal or tumor tissue from VilCreERT2Apcfl/+-PRNP+/− (PRNP_het) or VilCreERT2Apcfl/+-PRNP+/+ (PRNP_hom) mice as measured through qRT-PCR. G-N Scatter plots showing the correlation between the mRNA levels of human PRNP and those of mouse App (G), Bace1 (H), Dkk3 (I), Pdgfc (J), Tgfb1 (K), Axin2 (L), Lgr5 (M) and Ccnd1 (N) in normal or tumor tissue from VilCreERT2Apcfl/+-PRNP+/− or VilCreERT2Apcfl/+-PRNP+/+ mice. O, P Boxplots showing the mRNA levels of mouse Axin2 (O) and Ccnd1 (P) in normal or tumor tissue from VilCreERT2Apcfl/+-PRNP+/− (PRNP_het) or VilCreERT2Apcfl/+-PRNP+/+ (PRNP_hom) mice as measured through qRT-PCR. Mice experiments were conducted as described in Additional file 1
Fig. 5
Fig. 5
PrPC overexpression aggravates the development of mutant Apc driven CRC in mouse. A Relative quantification of lesion types according to genotype. B, C H&E staining sections from PRNP+/− mice, showing representative zones of high grade dysplasia (B, bottom panel) and low grade dysplasia (c, middle panel), as well as β-catenin staining (C, bottom panel). D, E H&E staining sections from PRNP+/+ mice, showing representative zones of infiltrating adenocarcinoma (D, bottom panels) and high grade dysplasia (E, middle panels), as well as β-catenin staining (E, bottom panels). Arrows indicate: a transition zone between normal cells and high grade dysplasia cells (B, bottom panel), mitoses (E, middle right panel), nuclear β-catenin (E, bottom right panel). Mice experiments were conducted as described in Additional file 1
Fig. 6
Fig. 6
The Prnp gene is a target of Wnt-β-catenin signaling in mouse models of liver cancer. A Analysis of our GSE35213 ChIPseq dataset reveals enrichment of the Tcf7l2-encoded TCF4 transcription factor at the promoter of the Prnp gene in Apc-inactivated (Apc∆hep), but not control or Ctnnb1-deficient hepatocytes. B Analysis of our GSE242267 ATACseq dataset and our GSE210482 RNAseq showing the promoter accessibility (left) and RNA transcription (right) of the Prnp gene along the kinetics (days 6, 15 and 21) of Apc inactivation in hepatocytes as compared to GFP control. C Boxplots showing the mRNA levels of Prnp in Apc∆hep tumor versus Apc∆hep normal tissue, as measured through qRT-PCR. D Boxplots showing the mRNA levels of Prnp in undifferentiated versus differentiated liver tumors from Apc∆hep mice, as measured through qRT-PCR. E, F Analysis of our PRJEB44400 dataset reveals increased Prnp (E) and Nr3c1 (F) expression in differentiated and mostly undifferentiated liver tumors from mutant Ctnnb1 and Apc mice. G–M Scatter plots showing the correlation between Prnp and App (G), Dkk3 (H), Pdgfc (I), Tgfb1 (J), Axin2 (K), Ccnd1 (L) and Nr3c1 (M) mRNA levels in the PRJEB44400 dataset
Fig. 7
Fig. 7
The PRNP-dependent axis is over-represented in poor-prognosis subtypes of CRC in the IDEA-France randomized clinical trial and predicts dismal outcome. A–C Relative PRNP-CTNNB1-NR3C1 score according to the CMS classification (A), CMS combination (B) or TNM risk (C) in the IDEA France cohort. Patients with stage pT1-T3 and pN1 were classified as low TNM risk and those with pT4 and / or pN2 as high TNM risk. D–F Scatter plots showing the correlation between the PRNP-CTNNB1-NR3C1 score and the mesenchymal (D) or the fibroblast (E) scores in the IDEA France cohort. F Density plot showing the distribution of correlation coefficients with the PRNP-CTNNB1-NR3C1 score in the IDEA France cohort highlighting the top-ranked correlation with the mesenchymal score. G Sankey plots showing the correspondence between low or high PRNP-CTNNB1-NR3C1 score and CMS subclasses. H, I Kaplan–Meier curves comparing time to recurrence in patients with low or high PRNP-CTNNB1-NR3C1 score in the entire IDEA France cohort (H) or in the subset of patients having received chemotherapy during 3 months (I)
Fig. 8
Fig. 8
Graphical summary

References

    1. Sung H, Ferlay J, Siegel RL, Laversanne M, Soerjomataram I, Jemal A, et al. Global Cancer Statistics 2020: GLOBOCAN estimates of incidence and mortality worldwide for 36 cancers in 185 countries. CA Cancer J Clin. 2021;71:209–249. doi: 10.3322/caac.21660. - DOI - PubMed
    1. Kinzler KW, Nilbert MC, Su LK, Vogelstein B, Bryan TM, Levy DB, et al. Identification of FAP locus genes from chromosome 5q21. Science. 1991;253:661–665. doi: 10.1126/science.1651562. - DOI - PubMed
    1. Parsons MJ, Tammela T, Dow LE. WNT as a driver and dependency in cancer. Cancer Discov. 2021;11:2413–2429. doi: 10.1158/2159-8290.CD-21-0190. - DOI - PMC - PubMed
    1. Guinney J, Dienstmann R, Wang X, de Reyniès A, Schlicker A, Soneson C, et al. The consensus molecular subtypes of colorectal cancer. Nat Med. 2015;21:1350–1356. doi: 10.1038/nm.3967. - DOI - PMC - PubMed
    1. Marisa L, Blum Y, Taieb J, Ayadi M, Pilati C, Le Malicot K, et al. Intratumor CMS heterogeneity impacts patient prognosis in localized colon cancer. Clin Cancer Res. 2021;27:4768–4780. doi: 10.1158/1078-0432.CCR-21-0529. - DOI - PMC - PubMed

Publication types