. 2024 Apr;25(4):e13451.
doi: 10.1111/mpp.13451.

Genetic dissection of the tissue-specific roles of type III effectors and phytotoxins in the pathogenicity of Pseudomonas syringae pv. syringae to cherry

Affiliations

Genetic dissection of the tissue-specific roles of type III effectors and phytotoxins in the pathogenicity of Pseudomonas syringae pv. syringae to cherry

Andrea Vadillo-Dieguez et al. Mol Plant Pathol. 2024 Apr.

Abstract

When compared with other phylogroups (PGs) of the Pseudomonas syringae species complex, P. syringae pv. syringae (Pss) strains within PG2 have a reduced repertoire of type III effectors (T3Es) but produce several phytotoxins. Effectors within the cherry pathogen Pss 9644 were grouped based on their frequency in strains from Prunus as the conserved effector locus (CEL) common to most P. syringae pathogens; a core of effectors common to PG2; a set of PRUNUS effectors common to cherry pathogens; and a FLEXIBLE set of T3Es. Pss 9644 also contains gene clusters for biosynthesis of toxins syringomycin, syringopeptin and syringolin A. After confirmation of virulence gene expression, mutants with a sequential series of T3E and toxin deletions were pathogenicity tested on wood, leaves and fruits of sweet cherry (Prunus avium) and leaves of ornamental cherry (Prunus incisa). The toxins had a key role in disease development in fruits but were less important in leaves and wood. An effectorless mutant retained some pathogenicity to fruit but not wood or leaves. Striking redundancy was observed amongst effector groups. The CEL effectors have important roles during the early stages of leaf infection and possibly acted synergistically with toxins in all tissues. Deletion of separate groups of T3Es had more effect in P. incisa than in P. avium. Mixed inocula were used to complement the toxin mutations in trans and indicated that strain mixtures may be important in the field. Our results highlight the niche-specific role of toxins in P. avium tissues and the complexity of effector redundancy in the pathogen Pss 9644.

Keywords: Prunus; Pseudomonas syringae; comparative genomics; mutagenesis; phytotoxins; type 3 effectors; virulence.


Conflict of interest statement

The authors declare no conflict of interest.

Figures

FIGURE 1
FIGURE 1
Maximum‐likelihood phylogeny of Pseudomonas syringae strains in phylogroup 2 based on the core genome. Bootstrap support at each node is shown as circles for 0%–50%; 51%–99% (all others are 100%). Four different categories of type III secretion system effectors are shown in shades of blue according to their frequency in genomes of isolates from cherry (red): conserved effector locus (CEL) (100%), CORE (100%), PRUNUS (>60%), FLEXIBLE (<60%). Presence of the syrsyp and sylA clusters are represented with shades of black according to the % identity to the P. syringae pv. syringae (Pss) B728A reference in antiSMASH. Pss 9644 is highlighted with a yellow rectangle. P. syringae pv. phaseolicola 1448A was used as an out‐group.
FIGURE 2
FIGURE 2
Log2 fold‐change ratio of the upregulated expression of genes encoding effectors and toxin synthesis in hrp‐inducing minimal medium (HMM) compared to King's medium B (KB) in Pseudomonas syringae pv. syringae 9644 wild‐type strain. Type III secretion system effectors (T3Es) in the four categories of Figure 1 are colour coded in shades of blue according to their frequency in phylogroup 2 and genomes of isolates from cherry: conserved effector locus (CEL), CORE, PRUNUS and FLEXIBLE. Toxin clusters are highlighted in shades of black. Legend represents syr, syringomycin; syp, syringopeptin; sylA, syringolin A. Lines represent the log2 fold‐change threshold of 1, 2 and 4; ns: nonsignificant (log2 fold‐change < 1). Values show means and standard errors from three replicates; the experiment was performed once.
FIGURE 3
FIGURE 3
Lesion formation in cut shoots and woody stems on whole trees of Prunus avium ‘Sweetheart’ inoculated with wild‐type Pseudomonas syringae pv. syringae 9644 and deletion mutants. Mutants are described in Table 1. WT: wild type, CEL: conserved effector locus, F: FLEXIBLE group, P: PRUNUS group, C: CORE group, Eff: all effectors in the CEL, FLEXIBLE, PRUNUS, CORE groups, sa: syringolin A cluster, ss: syringomycin/syringopeptin cluster, T: both toxin clusters. Mock: 10 mM MgCl2. Letters in common above data points indicate no significant difference between treatments. Box plots indicate minimum, first quartile, median (line), mean (diamond) third quartile and maximum values with bars indicating outliers. Letters in red indicate significant differences compared to the wild type (p < 0.05). Representative symptoms are shown in Figure S3. (a) Length of lesions produced in cut shoots. Data from three repeated experiments with 45 shoots in total for each treatment were analysed after log transformation by analysis of variance and post hoc Tukey–Kramer HSD tests to assess pairwise differences between mutants. The Tukey HSD procedure produced p‐values adjusted for multiple testing. (b) Percentage of inoculations (n = 10) in each disease score category after wound inoculation into trees. Disease symptoms were scored as illustrated: 1, no symptoms; 2, limited browning; 3, necrosis; 4, necrosis and gumming; 5, necrosis, gumming and spread of lesions from the site of inoculation. This experiment was performed once. Pairwise differences between strains were assessed via a series of Fisher's exact tests with the resulting p‐values adjusted for multiple testing through the Benjamini–Hochberg procedure.
FIGURE 4
FIGURE 4
Lesion formation in immature cherry fruits of Prunus avium stab‐inoculated with wild‐type Pseudomonas syringae pv. syringae 9644 and deletion mutants as described in Table 1. WT: wild type, CEL: conserved effector locus, F: FLEXIBLE group, P: PRUNUS group, C: CORE group, Eff: all effectors in the CEL, FLEXIBLE, PRUNUS, CORE groups, sa: syringolin A cluster, ss: syringomycin/syringopeptin cluster, T: both toxins clusters. Mock: sterile toothpick. dpi, days post‐inoculation. Letters in common above data points indicate no significant difference between treatments and those in red indicate significant differences compared to the wild type (p < 0.05). This experiment was performed twice and data from 10 fruits for each treatment were analysed after log transformation, with analysis of variance and post hoc Tukey–Kramer HSD tests to assess pairwise differences between mutants. Box plots indicate minimum, first quartile, median (line), mean (diamond) third quartile and maximum values with bars indicating outliers.
FIGURE 5
FIGURE 5
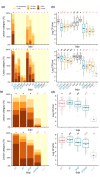
The effects of mutations on the pathogenicity of Pseudomonas syringae pv. syringae (Pss) 9644 to leaves of Prunus avium. Detached leaves were inoculated with wild‐type Pss 9644 and deletion mutants as described in Table 1, using low concentration inoculum (2 × 106 cfu/mL); WT: wild type, CEL: conserved effector locus, F: FLEXIBLE group, P: PRUNUS group, C: CORE group, Eff: all effectors in CEL, FLEXIBLE, PRUNUS, CORE groups, sa: syringolin A cluster, ss: syringomycin/syringopeptin cluster, T: both toxins clusters. Mock: 10 mM MgCl2. dpi, days post‐inoculation. Letters in common above data points indicate no significant difference between treatments. Letters in red indicate significant differences compared to the wild type (p < 0.05). (a, c) Lesion formation, assessed using a six‐point scale as illustrated, based on the percentage browning /blackening at the inoculation site; 0, no reaction; 1, <10%; 2, 10%–50%; 3, 51%–90%; 4, 100% discolouration; 5, symptoms spreading from the infiltrated area. Data from three repeated experiments with 15 inoculation sites in total per treatment were analysed. Pairwise differences between strains were assessed via a series of Fisher's exact tests with the resulting p‐values adjusted for multiple testing through the Benjamini–Hochberg procedure. Representative symptoms are shown in Figure S5. (b, d) Recovery of bacteria from inoculation sites. Data from three repeated experiments with 15 sites for each treatment per timepoint were analysed after log transformation by analysis of variance and post hoc Tukey–Kramer HSD tests to assess pairwise differences between mutants. The Tukey HSD procedure produced p‐values adjusted for multiple testing. Box plots indicate minimum, first quartile, median (line), mean (diamond) third quartile and maximum values with bars indicating outliers.
FIGURE 6
FIGURE 6
Comparison of the effects of mutations on the pathogenicity of Pseudomonas syringae pv. syringae (Pss) 9644 to leaves of Prunus avium ‘Sweetheart’ and Prunus incisa using high concentration inoculum (2 × 108 cfu/mL). WT: wild type, CEL: conserved effector locus, F: FLEXIBLE group, P: PRUNUS group, C: CORE group, Eff: all effectors in CEL, FLEXIBLE, PRUNUS, CORE groups, sa: syringolin A cluster, ss: syringomycin/syringopeptin cluster, T: both toxins cluster. Mock: 10 mM MgCl2. dpi, days post‐inoculation. Letters in common above data points indicate no significant difference between treatments. Letters in red indicate significant differences compared to the wild type (p < 0.05). Lesion formation, assessed using a six‐point scale as illustrated, based on the percentage browning/blackening at the inoculation site; 0, no reaction; 1, <10%; 2, 10%–50%; 3, 51%–90%; 4, 100% discolouration; 5, symptoms spreading from the infiltrated area. Data from three repeated experiments with 18 inoculation sites in total per treatment were analysed. Pairwise differences between strains were assessed via a series of Fisher's exact tests with the resulting p‐values adjusted for multiple testing through the Benjamini–Hochberg procedure. Note that at low inoculum concentration (2 × 106 cfu/mL) Pss 9644 fails to cause lesions in ornamental cherry, P. incisa.
FIGURE 7
FIGURE 7
Use of mixtures of mutants of Pseudomonas syringae pv. syringae 9644 to demonstrate complementation of gene deletions. A mixture of the effectorless mutant (ΔEff) that produces both toxins, and the ΔCELΔT mutant, which produces all effectors except the CEL, was examined to complement the missing genes in trans. Pathogenicity to detached leaves of Prunus avium ‘Sweetheart’ was examined using low concentration inoculum (2 × 106 cfu/mL). WT: wild type, CEL: conserved effector locus, F: FLEXIBLE group, P: PRUNUS group, C: CORE group, Eff: all effectors in the CEL, FLEXIBLE, PRUNUS, CORE groups, sa: syringolin A cluster, ss: syringomycin/syringopeptin cluster, T: both toxins clusters. Mock: 10 mM MgCl2. dpi, days post‐inoculation. Letters in common above data points indicate no significant difference between treatments. Letters in red indicate significant differences compared to the wild type (p < 0.05). (a) Lesion formation, assessed using a six‐point scale as illustrated, based on the percentage browning/blackening at the inoculation site; 0, no reaction; 1, <10%; 2, 10%–50%; 3, 51%–90%; 4, 100% discolouration; 5, symptoms spreading from the infiltrated area. Data from three repeated experiments with 15 inoculation sites per treatment were analysed. Pairwise differences between strains were assessed via a series of Fisher's exact tests with the resulting p‐values adjusted for multiple testing through the Benjamini–Hochberg procedure. (b) Recovery of bacteria from inoculation sites. Data from three repeated experiments with 15 sites in total for each treatment, were analysed after log transformation by analysis of variance and post hoc Tukey–Kramer HSD tests to assess pairwise differences between mutants. The Tukey HSD procedure produced p‐values adjusted for multiple testing. Box plots indicate minimum, first quartile, median (line), mean (diamond) third quartile and maximum values with bars indicating outliers.

Similar articles

Cited by

References

    1. Alfano, J.R. , Charkowski, A.O. , Deng, W.‐L. , Badel, J.L. , Petnicki‐Ocwieja, T. , Van Dijk, K. et al. (2000) The Pseudomonas syringae Hrp pathogenicity island has a tripartite mosaic structure composed of a cluster of type III secretion genes bounded by exchangeable effector and conserved effector loci that contribute to parasitic fitness and pathogenicity in plants. Proceedings of the National Academy of Sciences of the United States of America, 97, 4856–4861. - PMC - PubMed
    1. Altschul, S.F. , Gish, W. , Miller, W. , Myers, E.W. & Lipman, D.J. (1990) Basic local alignment search tool. Journal of Molecular Biology, 215, 403–410. - PubMed
    1. Andrews, S. (2010) FastQC: a quality control tool for high throughput sequence data. Cambridge, UK: Babraham Bioinformatics, Babraham Institute.
    1. Aronesty, E. (2013) Comparison of sequencing utility programs. The Open Bioinformatics Journal, 7, TOBIOIJ‐7‐1.
    1. Badel, J.L. , Nomura, K. , Bandyopadhyay, S. , Shimizu, R. , Collmer, A. & He, S.Y. (2003) Pseudomonas syringae pv. tomato DC3000 HopPtoM (CEL ORF3) is important for lesion formation but not growth in tomato and is secreted and translocated by the Hrp type III secretion system in a chaperone‐dependent manner. Molecular Microbiology, 49, 1239–1251. - PubMed

Substances