

Photosynthetic capacity and assimilate transport of the lower canopy influence maize yield under high planting density
- PMID: 38590166
- PMCID: PMC11288763
- DOI: 10.1093/plphys/kiae204
Photosynthetic capacity and assimilate transport of the lower canopy influence maize yield under high planting density
Abstract
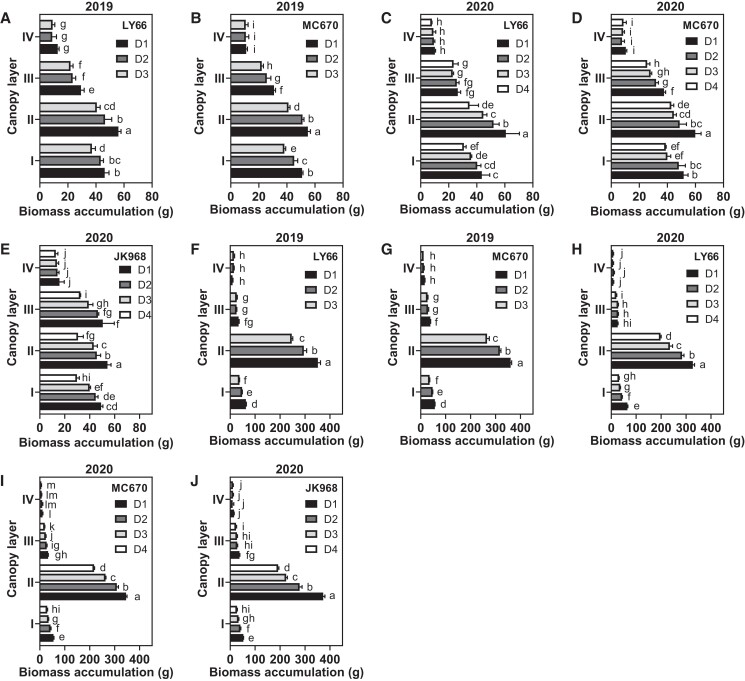
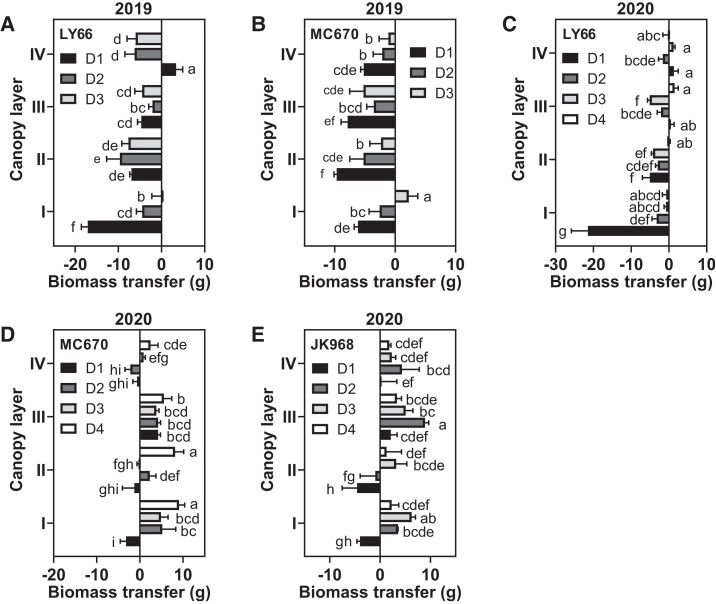
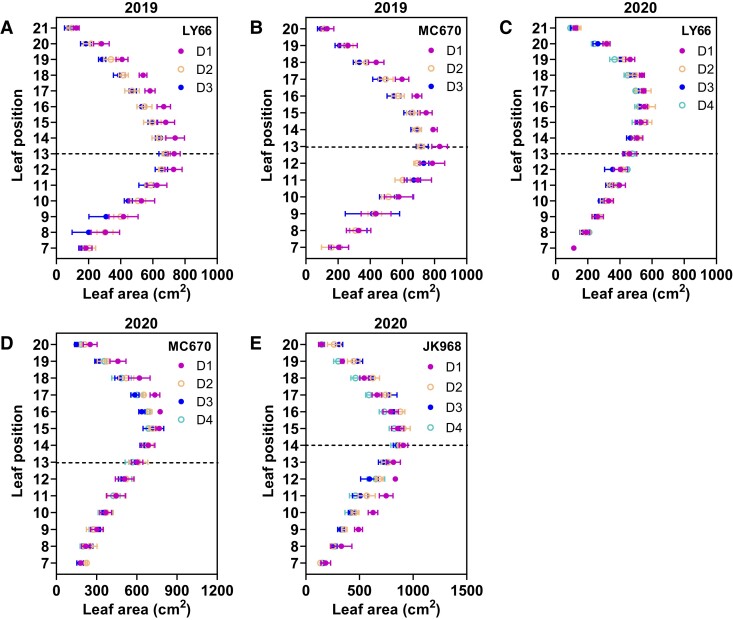
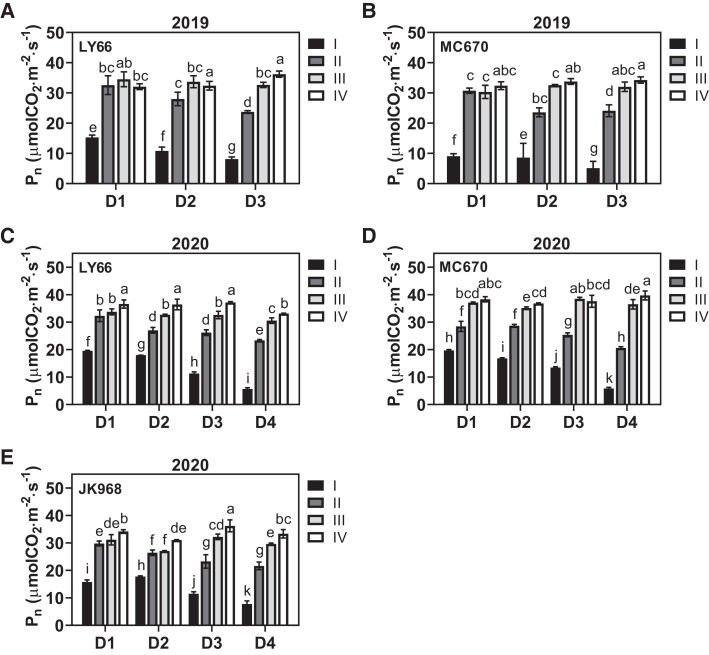
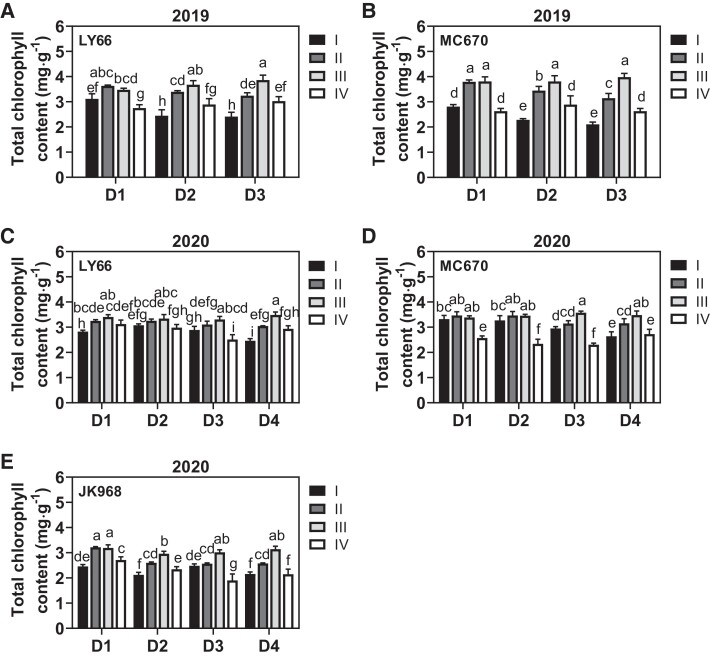
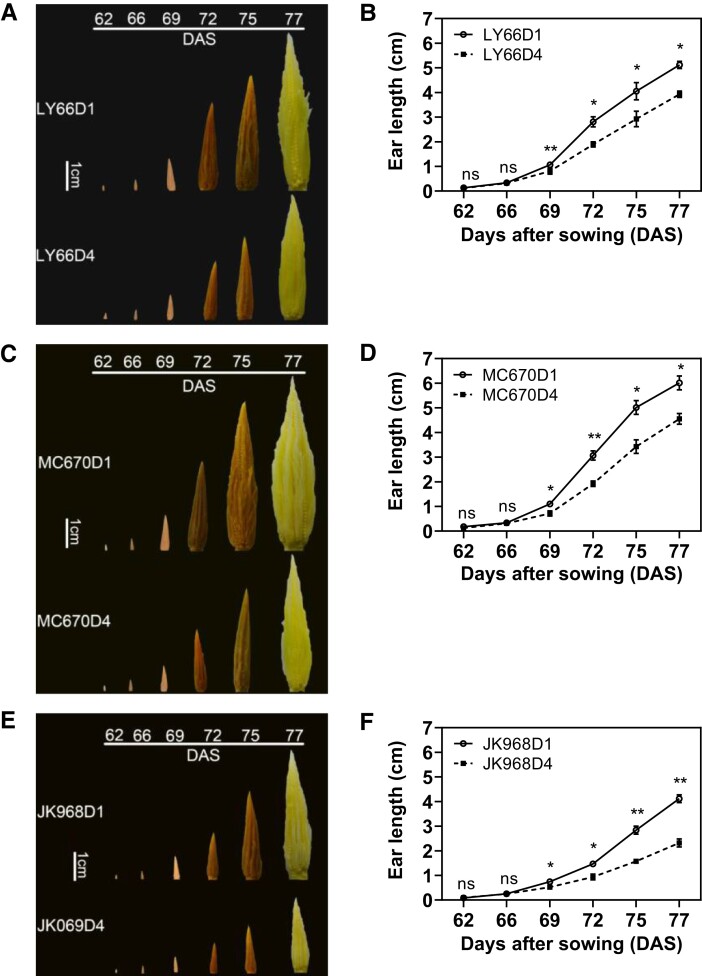
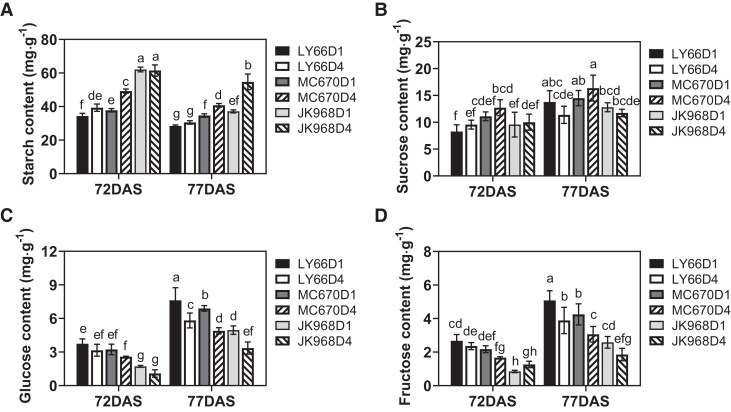
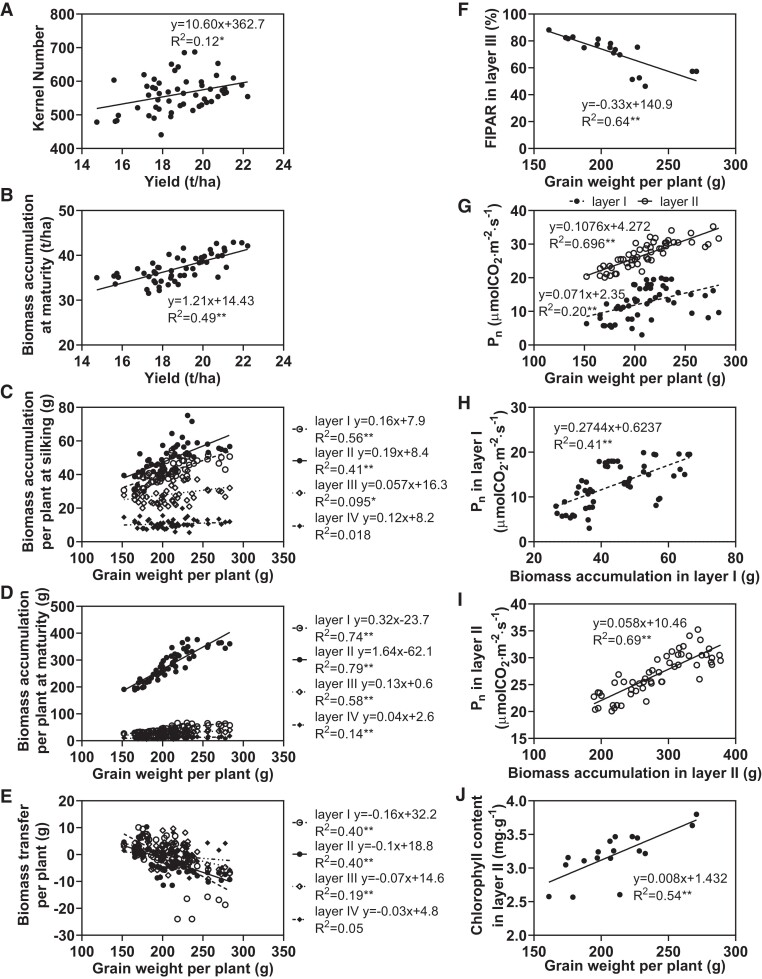
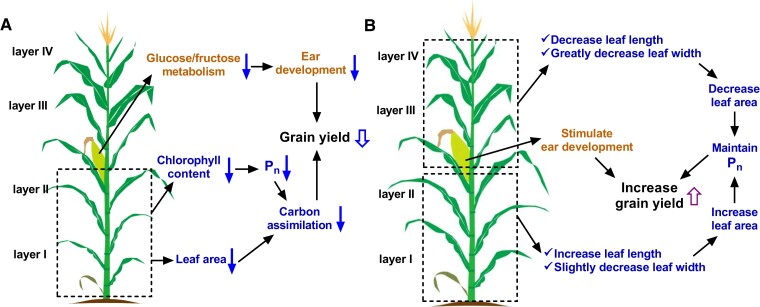
Photosynthesis is a major trait of interest for the development of high-yield crop plants. However, little is known about the effects of high-density planting on photosynthetic responses at the whole-canopy level. Using the high-yielding maize (Zea mays L.) cultivars "LY66," "MC670," and "JK968," we conducted a 2-yr field experiment to assess ear development in addition to leaf characteristics and photosynthetic parameters in each canopy layer at 4 planting densities. Increased planting density promoted high grain yield and population-scale biomass accumulation despite reduced per-plant productivity. MC670 had the strongest adaptability to high-density planting conditions. A physiological analysis showed that increased planting density primarily led to decreases in the single-leaf area above the ear for LY66 and MC670 and below the ear for JK968. Furthermore, high planting density decreased chlorophyll content and the photosynthetic rate due to decreased canopy transmission, leading to severe decreases in single-plant biomass accumulation in the lower canopy. Moreover, increased planting density improved presilking biomass transfer, especially in the lower canopy. The yield showed significant positive relationships with photosynthesis and biomass in the lower canopy, demonstrating the important contributions of these leaves to grain yield under dense planting conditions. Increased planting density led to retarded ear development as a consequence of reduced glucose and fructose contents in the ears, indicating reductions in sugar transport that were associated with limited sink organ development, reduced kernel number, and yield loss. Overall, these findings highlighted the photosynthetic capacities of the lower canopy as promising targets for improving maize yield under dense planting conditions.
© The Author(s) 2024. Published by Oxford University Press on behalf of American Society of Plant Biologists.
Conflict of interest statement
Conflict of interest statement. The authors declare they have no conflicts of interest in this paper.
Figures
Similar articles
-
Improving photosynthesis to increase grain yield potential: an analysis of maize hybrids released in different years in China.Photosynth Res. 2021 Dec;150(1-3):295-311. doi: 10.1007/s11120-021-00847-x. Epub 2021 May 25. Photosynth Res. 2021. PMID: 34032983 Free PMC article.
-
[Spectra characteristic effect of different density-resistant maize variety on planting density].Guang Pu Xue Yu Guang Pu Fen Xi. 2013 Mar;33(3):770-5. Guang Pu Xue Yu Guang Pu Fen Xi. 2013. PMID: 23705451 Chinese.
-
Physiological and proteome studies of maize (Zea mays L.) in response to leaf removal under high plant density.BMC Plant Biol. 2018 Dec 29;18(1):378. doi: 10.1186/s12870-018-1607-8. BMC Plant Biol. 2018. PMID: 30594144 Free PMC article.
-
Leaf angle regulation toward a maize smart canopy.Plant J. 2025 Jan;121(2):e17208. doi: 10.1111/tpj.17208. Epub 2024 Dec 11. Plant J. 2025. PMID: 39661752 Review.
-
Leaf angle: a target of genetic improvement in cereal crops tailored for high-density planting.Plant Biotechnol J. 2022 Mar;20(3):426-436. doi: 10.1111/pbi.13780. Epub 2022 Feb 15. Plant Biotechnol J. 2022. PMID: 35075761 Free PMC article. Review.
Cited by
-
Solving the maize maze? Look to the lower leaves.Plant Physiol. 2024 Jul 31;195(4):2477-2479. doi: 10.1093/plphys/kiae236. Plant Physiol. 2024. PMID: 38668373 Free PMC article. No abstract available.
-
Effects of Nitrogen Fertilizer Types and Planting Density on the Yield and Nitrogen Use Efficiency of Salt-Tolerant Rice Under Salt Stress Conditions.Plants (Basel). 2025 Feb 7;14(4):501. doi: 10.3390/plants14040501. Plants (Basel). 2025. PMID: 40006759 Free PMC article.
-
Comparative Physiological, Proteomic, and Metabolomic Insights into a Promising Low-Pruning Mulberry Cultivar for Silkworm Rearing.Int J Mol Sci. 2024 Dec 16;25(24):13483. doi: 10.3390/ijms252413483. Int J Mol Sci. 2024. PMID: 39769246 Free PMC article.
-
Advancements in the Research and Application of Whole-Plant Maize Silage for Feeding Purposes.Animals (Basel). 2025 Jun 29;15(13):1922. doi: 10.3390/ani15131922. Animals (Basel). 2025. PMID: 40646821 Free PMC article. Review.
-
A combined model of shoot phosphorus uptake based on sparse data and active learning algorithm.Front Plant Sci. 2025 Jan 22;15:1470719. doi: 10.3389/fpls.2024.1470719. eCollection 2024. Front Plant Sci. 2025. PMID: 39911659 Free PMC article.
References
-
- Allison JCS, Watson DJ. The production and distribution of dry matter in maize after flowering. Ann Bot. 1966:30(3):365–381. 10.1093/oxfordjournals.aob.a084082 - DOI
-
- Andrade FH, Vega C, Uhart S, Cirilo A, Cantarero M, Valentinuz O. Kernel number determination in maize. Crop Sci. 1999:39(2):453–459. 10.2135/cropsci1999.0011183X0039000200026x - DOI
-
- Andrea S, Di BD, Pierangelo B, Olga G, Giorgio M. Investigating the European beech (Fagus sylvatica L.) leaf characteristics along the vertical canopy profile: leaf structure, photosynthetic capacity, light energy dissipation and photoprotection mechanisms. Tree Physiol. 2016:36(9):1060–1076. 10.1093/treephys/tpw038 - DOI - PubMed
-
- Assefa Y, Carter P, Hinds M, Bhalla G, Schon R, Jeschke M, Paszkiewicz S, Smith S, Ciampitti IA. Analysis of long term study indicates both agronomic optimal plant density and increase maize yield per plant contributed to yield gain. Sci Rep. 2018:8(1):4937. 10.1038/s41598-018-23362-x - DOI - PMC - PubMed
-
- Cárcova J, Uribelarrea M, Borrás L, Otegui ME, Westgate ME. Synchronous pollination within and between ears improves kernel set in maize. Crop Sci. 2000:40(4):1056–1061. 10.2135/cropsci2000.4041056x - DOI
MeSH terms
Substances
Grants and funding
LinkOut - more resources
Full Text Sources
