. 2024 Mar 15;14(3):1033-1051.
doi: 10.62347/EYNT8387. eCollection 2024.

Higher overall survival rates of oral squamous cell carcinoma treated with metronomic neoadjuvant chemotherapy

Affiliations

Higher overall survival rates of oral squamous cell carcinoma treated with metronomic neoadjuvant chemotherapy

Shinichiro Kina et al. Am J Cancer Res. .

Abstract

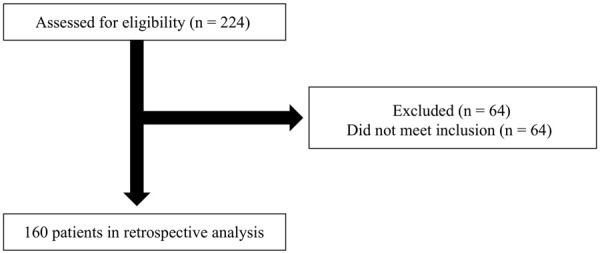
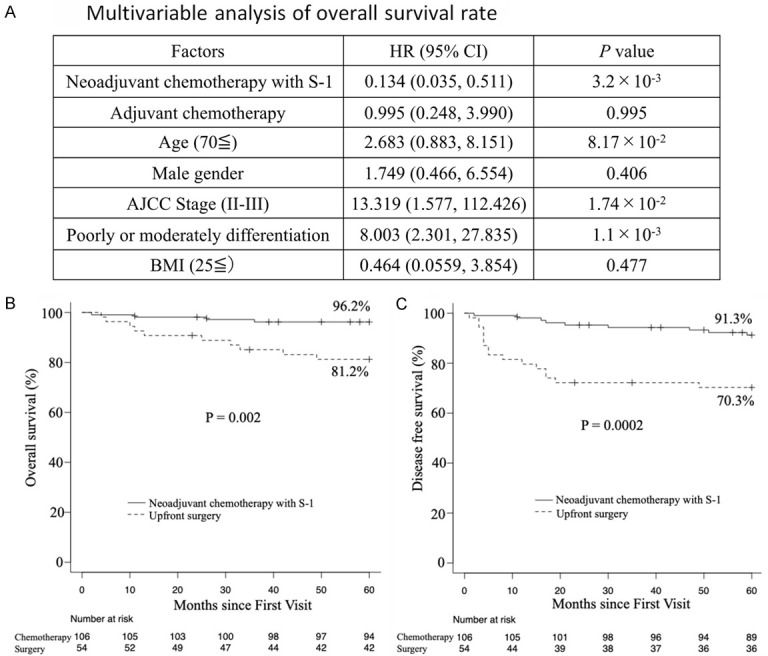
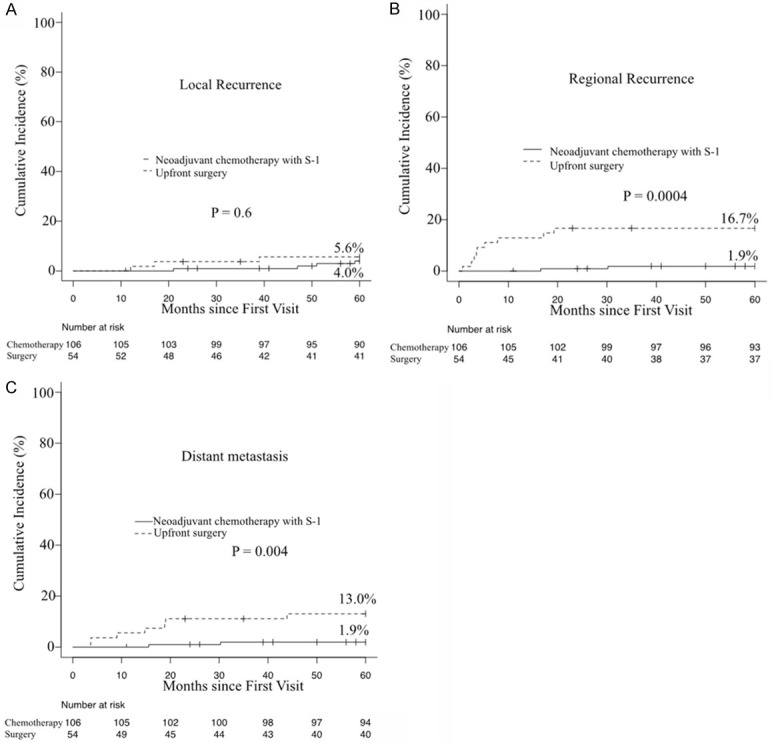
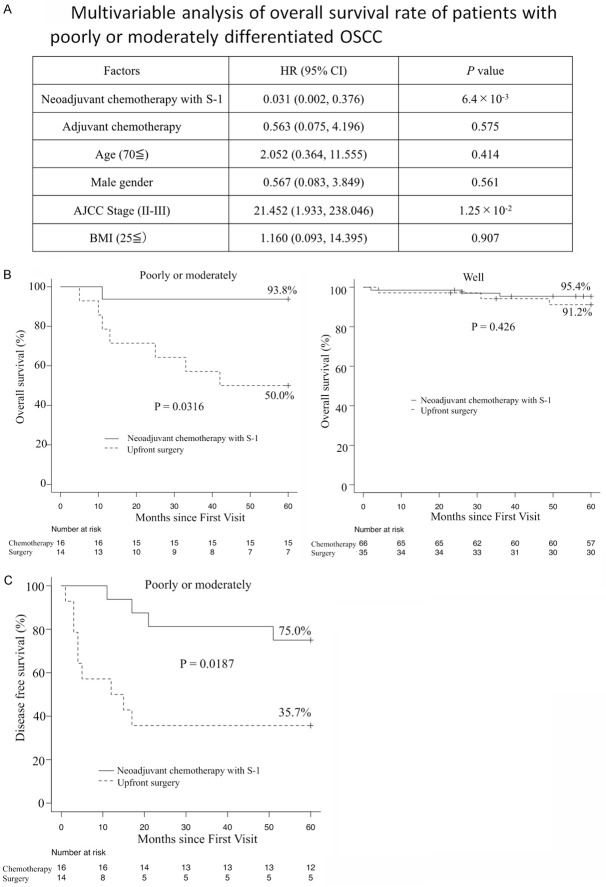
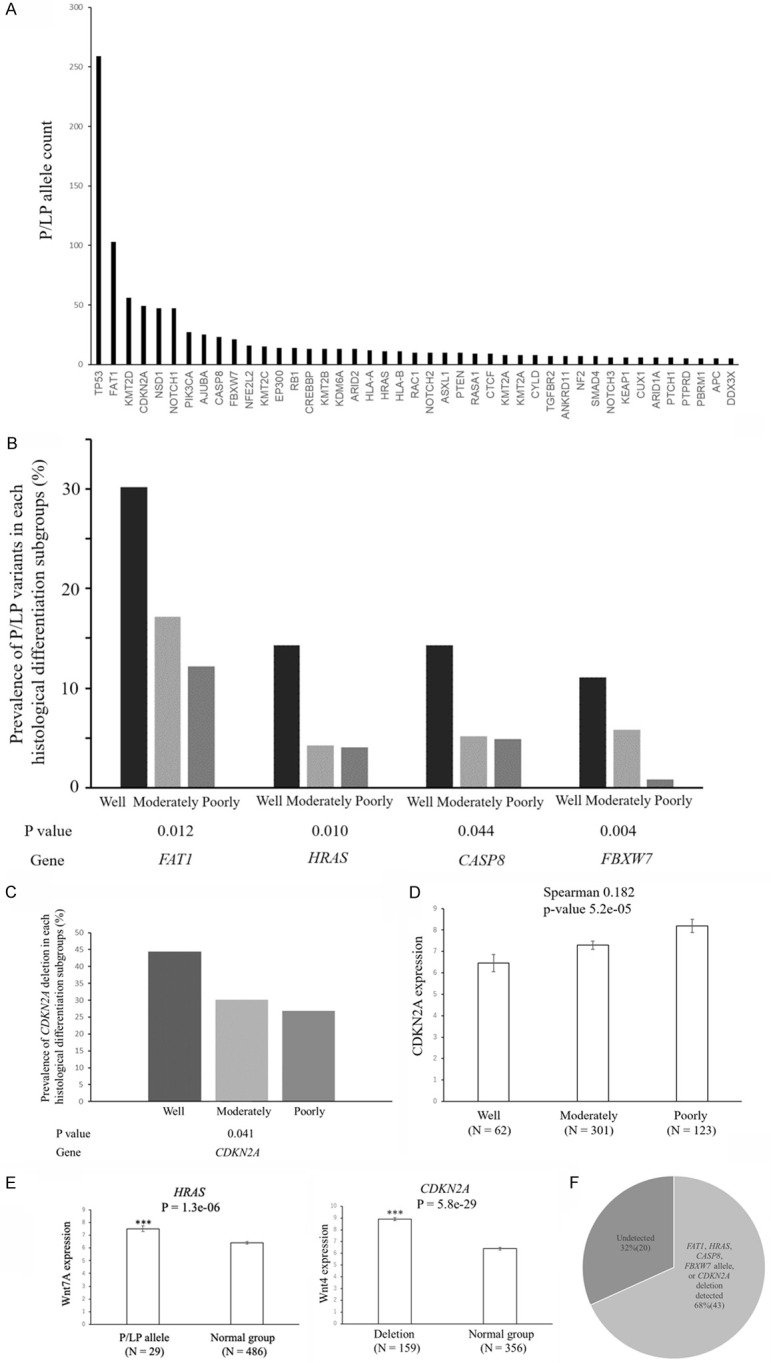
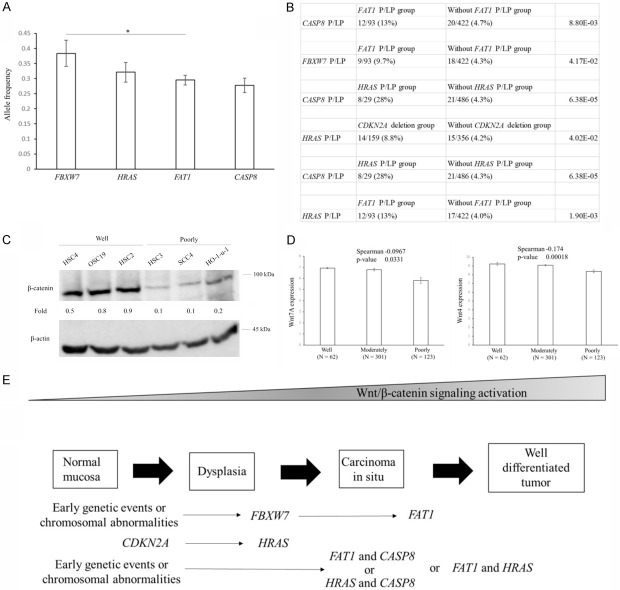
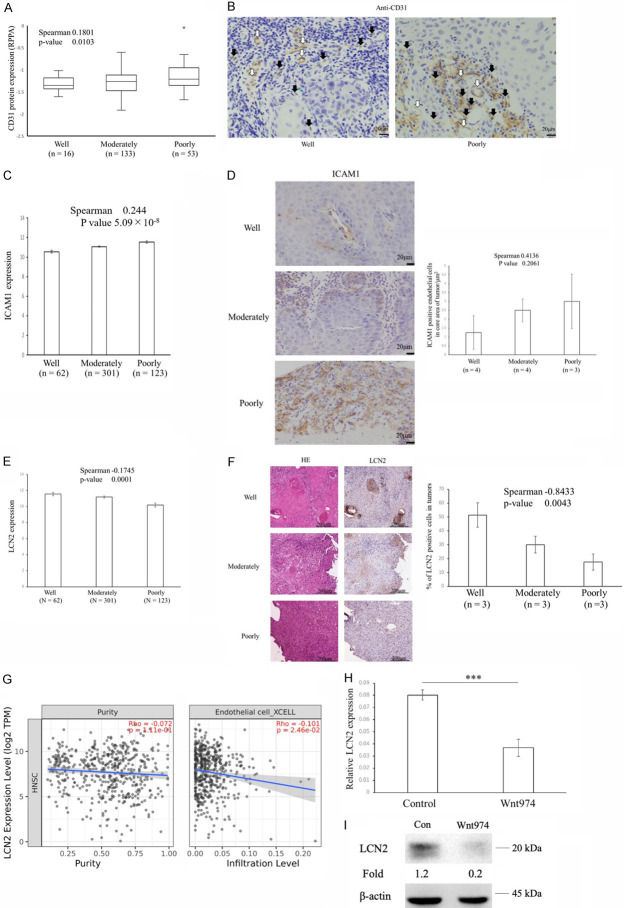
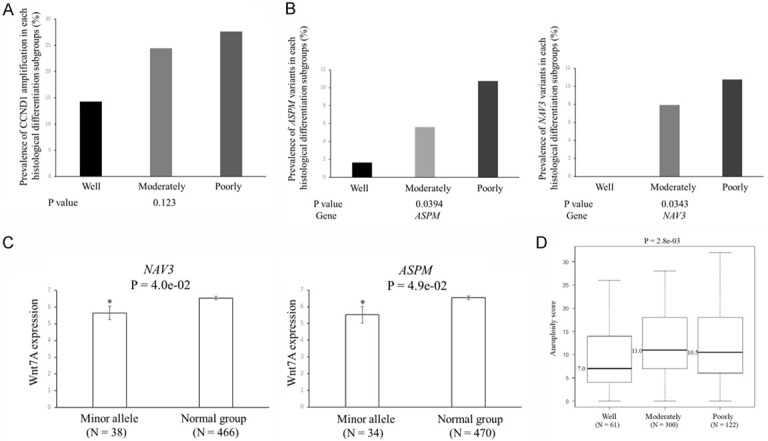
Distant metastasis is an important prognostic factor for oral squamous cell carcinoma (OSCC). It involves the direct spread of tumor cells through blood vessels or via lymph nodes; however, there are currently no well-established treatments for its prevention in patients with OSCC. To investigate the impact of metronomic neoadjuvant chemotherapy on OSCC, we conducted a retrospective analysis of the efficacy of neoadjuvant chemotherapy with S-1 alone. Fifty-four patients underwent up-front surgery, while 106 received neoadjuvant chemotherapy with S-1 alone. A serious adverse event occurred in one of patient treated with neoadjuvant chemotherapy (1%); however, all patients underwent resection. The 5-year overall survival rate was higher with S-1 than with up-front surgery (96% vs. 81%, P = 0.002). Moreover, neoadjuvant chemotherapy significantly increased the overall survival rate of patients with poorly or moderately differentiated tumors, but not those with well-differentiated tumors. By analyzing a cohort of 523 head and neck squamous cell carcinoma (HNSCC) patients in the Cancer Genome Atlas, we identified genetic variants associated with histological differentiation. The frequency of pathogenic/likely pathogenic variants or deletions in 5 genes associated with HNSCC correlated with histological differentiation, some of which indicated the activation of the Wnt/β-catenin pathway in well-differentiated HNSCC. The vessel marker CD31 was highly expressed in poorly differentiated OSCC, whereas the anti-angiogenic molecule, LCN2, which is induced by the activation of the Wnt pathway, was highly expressed in well-differentiated OSCC. The present study showed that overall survival rates were higher in patients with poorly or moderately differentiated OSCC who received metronomic neoadjuvant chemotherapy, which was attributed to a difference in angiogenesis based on the characteristic landscape of pathogenic mutations according to histological differentiation.

Keywords: Metronomic neoadjuvant chemotherapy; distant metastasis; histological differentiation; oral squamous cell carcinoma.


Conflict of interest statement

None.

Figures

Figure 1
Figure 1
Flowchart of patients included in this study.
Figure 2
Figure 2
Overall survival and disease-free survival rates. A. Multivariable Cox proportional hazards regression for overall survival rate. The graph shows the HR of the Cox proportional hazards model, with error bars indicating two-sided 95% CIs (Cox regression multivariable analysis). P values were calculated using multivariable Cox proportional hazards regression. Two-sided P values were calculated. B. The primary endpoint was the 5-year overall survival rate. C. The secondary endpoint was the 5-year disease-free survival rate. Patients received neoadjuvant chemotherapy with S-1 orally or underwent up-front surgery.
Figure 3
Figure 3
Cumulative incidence of local recurrence, regional recurrence, and distant metastasis.
Figure 4
Figure 4
Primary outcome according to histological differentiation. A. Multivariable Cox proportional hazards regression for overall survival rate of patients with poorly or moderately differentiated OSCC. The graph shows the HR of the Cox proportional hazards model, with error bars indicating two-sided 95% CIs (Cox regression multivariable analysis). P values were calculated using multivariable Cox proportional hazards regression. Two-sided P values were calculated. B. Kaplan-Meier survival curves comparing OS between patients receiving neoadjuvant chemotherapy with S-1 and up-front surgery. Poorly or moderately differentiation (left) and well-differentiation (right). P values were calculated using the log-rank test. C. Kaplan-Meier survival curves comparing disease-free survival between poorly or moderately differentiated OSCC patients receiving neoadjuvant chemotherapy with S-1 and up-front surgery. P values were calculated using the log-rank test.
Figure 5
Figure 5
Overview of P/LP variants enriched in HNSCC genes. A. Allele counts of P/LP variants detected in 43 known HNSCC genes. B. P/LP variants in 4 genes were enriched in well-differentiated HNSCC relative to other differentiated HNSCC (well-differentiated cases n = 63; moderately differentiated cases n = 308; poorly differentiated cases n = 123). Genes with P<0.05 are shown. The graph shows the contribution rate of each P/LP variant in patients with different histological differentiation. P values for differences in the prevalence of P/LP variants between well-differentiated cases and other cases are generated by two-sided Fisher’s exact tests. C. The contribution rate of the CDKN2A deletion according to the histological differentiation of HNSCC. A deletion in the CDKN2A gene was enriched in well-differentiated HNSCC relative to other differentiated HNSCC (well-differentiated cases n = 63; moderately differentiated cases n = 308; poorly differentiated cases n = 123). Genes with P<0.05 are shown. The graph shows the contribution rate of each CDKN2A deletion in patients with different histological differentiation. P values for differences in the prevalence of the CDKN2A deletion between well-differentiated cases and other cases are generated by two-sided Fisher’s exact tests. D. Relationship between histological differentiation and CDKN2A expression in head and neck cancers. The RSEM values for CDKN2A are shown for head and neck cancers from the TCGA dataset. Data are shown as means ± s.e.m. CDKN2A expression positively correlated with histological differentiation using Spearman’s rank-based correlation. E. Relationship between P/LP variants or deletions and Wnt/β-catenin signaling-related gene expression in head and neck cancers. RNA-Seq by Expectation-Maximization (RSEM) values for Wnt7A and Wnt4 are shown for head and neck cancers from the TCGA dataset. Data are shown as means ± s.e.m. A two-sided t-test was used to assess significance. Numbers indicate P-values. *P<0.05, ***P<0.001. F. The contribution of well-differentiation-specific genes in 63 well-differentiated cases.
Figure 6
Figure 6
Molecular mechanisms underlying the development of well-differentiated HNSCC. A. The graph shows the allele frequency of P/LP variants in each gene. P values for differences in the frequencies of P/LP variants between genes were generated by the two-sided Student’s t-test. B. Pair relationships of genetic changes among P/LP variants or deletions in TCGA HNSCC. Genes with P<0.05 are shown. P values were generated by the two-sided Fisher’s exact tests. C. Western blots of β-catenin in OSCC cell lines. Band intensities were measured using the software ImageJ. Fold changes relative to the control were calculated using the β-catenin:β-actin ratio. D. Relationship between histological differentiation and Wnt7A or Wnt4 expression in head and neck cancers. The RSEM values for Wnt7A and Wnt4 are shown for head and neck cancers from the TCGA dataset. Data are shown as means ± s.e.m. Wnt7A and Wnt4 expression negatively correlated with histological differentiation using Spearman’s rank-based correlation. E. Overview of 5 genes with P/LP variants or deletions significantly enriched in well-differentiated HNSCC. The upper graph depicts the stage and molecular mechanisms throughout tumor development of 5 significantly enriched genes.
Figure 7
Figure 7
Increases in the angiogenesis suppressor LCN2 in well-differentiated HNSCC. A. Relationship between histological differentiation and CD31 protein expression in head and neck cancers. The Reverse Phase Protein Array (RPPA) values for CD31 are shown for head and neck cancers from the TCGA dataset. Labels indicate the minimum, 25th percentile, median, 75th percentile and maximum. CD31 expression correlated with histological differentiation using Spearman’s rank-based correlation. B. Immunohistochemistry stain of CD31 expression on biopsy sample from a patient with well-differentiated OSCC (left) versus poorly differentiated OSCC (right). White and black arrows denote mature and immature vessel, respectively. C. ICAM1 mRNA expression correlated with histological differentiation using Spearman’s rank-based correlation. Data are shown as means ± s.e.m. D. Differences in ICAM1 protein expression in well-, moderately, and poorly differentiated OSCC. Representative histopathology from well-, moderately, and poorly differentiated OSCC stained for ICAM1 (left). Differences in mean ICAM1-positive endothelial cell counts in core area of well-, moderately, and poorly differentiated OSCC are shown (right). Graphs of ICAM1 show the percentages of positive endothelial cells in core of the OSCC at each histological differentiation. Data are shown as means ± s.e.m. The percentage of ICAM1-positive endothelial cells in core area of tumors had mild trends with histological differentiation using Spearman’s rank-based correlation. E. LCN2 mRNA expression negatively correlated with histological differentiation using Spearman’s rank-based correlation. Data are shown as means ± s.e.m. F. Differences in LCN2 protein expression in well-, moderately, and poorly differentiated OSCC. Representative histopathology from well-, moderately, and poorly differentiated OSCC stained for LCN2 (left). Differences in mean LCN2-positive tumor cell counts in well-, moderately, and poorly differentiated OSCC are shown (right). Graphs of LCN2 show the percentages of positive tumor cells at each histological differentiation. Data are shown as means ± s.e.m. The percentage of LCN2-positive cells in tumors negatively correlated with histological differentiation using Spearman’s rank-based correlation. G. Scatterplots of the relationships between LCN2 expression, tumor purity, and the infiltration levels of endothelial cells. Scatterplots are calculated based on the TCGA data of 499 HNSCCs through the ‘Gene Module’ in Timer2.0. The line in each plot is the fitted linear model. H. Quantification of LCN2 mRNA levels normalized to β-actin (n = 5). Data are shown as means ± s.e.m. The two-sided t-test was used to assess significance. ***P<0.001. OSC19 cells were pretreated with 10 μM Wnt974 for 48 h. I. A Western blot analysis of OSC19 cell lines treated with 10 μM Wnt974 for 2 days. Cell lysates were collected for a Western blot analysis of LCN2 and β-actin. Band intensities were measured using the software ImageJ. Fold changes relative to the control were calculated using the LCN2:β-actin ratio.
Figure 8
Figure 8
Gene sets associated with poorly differentiated HNSCC. A. The contribution rate of CCND1 amplification according to the histological differentiation of HNSCC. The rate of CCND1 amplification between the different types of histological differentiation was calculated from two-sided Fisher’s exact tests and generated P values. B. The contribution rate of NAV3 and ASPM variants according to the histological differentiation of HNSCC. The rates of NVA3 and ASPM variants between the different types of histological differentiation were calculated from the two-sided Fisher’s exact test and generated P values. C. Relationship between minor variants and Wnt7A expression in head and neck cancers. RSEM values for Wnt7A are shown for head and neck cancers from the TCGA dataset. Data are shown as means ± s.e.m. A two-sided t-test was used to assess significance. Numbers indicate P-values. *P<0.05. D. Aneuploidy scores in patients with well-, moderately, and poorly differentiated HNSCC. We used the Kruskal-Wallis test for comparisons between the different types of histological differentiation. Labels indicate the minimum, 25th percentile, median, 75th percentile, and maximum. N on the x-axis represents the number of patients.

Similar articles

Cited by

References

    1. Kawakita D, Oze I, Iwasaki S, Matsuda T, Matsuo K, Ito H. Trends in the incidence of head and neck cancer by subsite between 1993 and 2015 in Japan. Cancer Med. 2022;11:1553–1560. - PMC - PubMed
    1. Fu JY, Wu CX, Zhang CP, Gao J, Luo JF, Shen SK, Zheng Y, Zhang ZY. Oral cancer incidence in Shanghai ---- a temporal trend analysis from 2003 to 2012. BMC Cancer. 2018;18:686. - PMC - PubMed
    1. Dhanuthai K, Rojanawatsirivej S, Thosaporn W, Kintarak S, Subarnbhesaj A, Darling M, Kryshtalskyj E, Chiang CP, Shin HI, Choi SY, Lee SS, Aminishakib P. Oral cancer: a multicenter study. Med Oral Patol Oral Cir Bucal. 2018;23:e23–e29. - PMC - PubMed
    1. Weckx A, Riekert M, Grandoch A, Schick V, Zöller JE, Kreppel M. Time to recurrence and patient survival in recurrent oral squamous cell carcinoma. Oral Oncol. 2019;94:8–13. - PubMed
    1. Farnsworth RH, Lackmann M, Achen MG, Stacker SA. Vascular remodeling in cancer. Oncogene. 2014;33:3496–3505. - PubMed

LinkOut - more resources