. 2024 Apr 4;13(1):2338965.
doi: 10.1080/2162402X.2024.2338965. eCollection 2024.

CCR2 and CCR5 co-inhibition modulates immunosuppressive myeloid milieu in glioma and synergizes with anti-PD-1 therapy

Affiliations

CCR2 and CCR5 co-inhibition modulates immunosuppressive myeloid milieu in glioma and synergizes with anti-PD-1 therapy

Ayush Pant et al. Oncoimmunology. .

Abstract

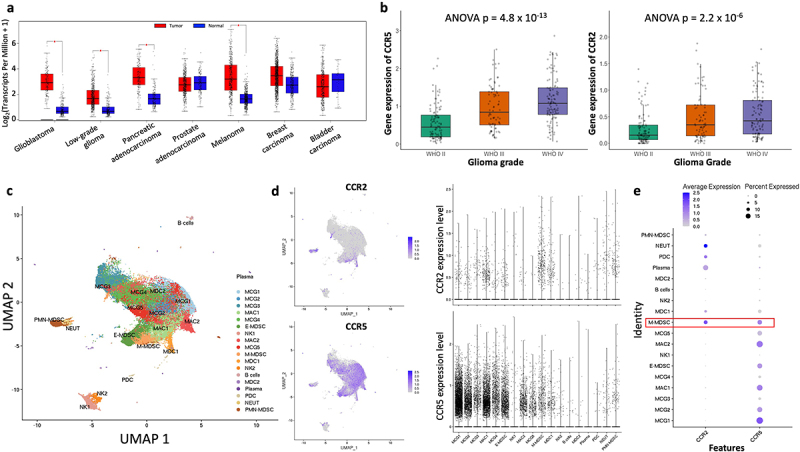
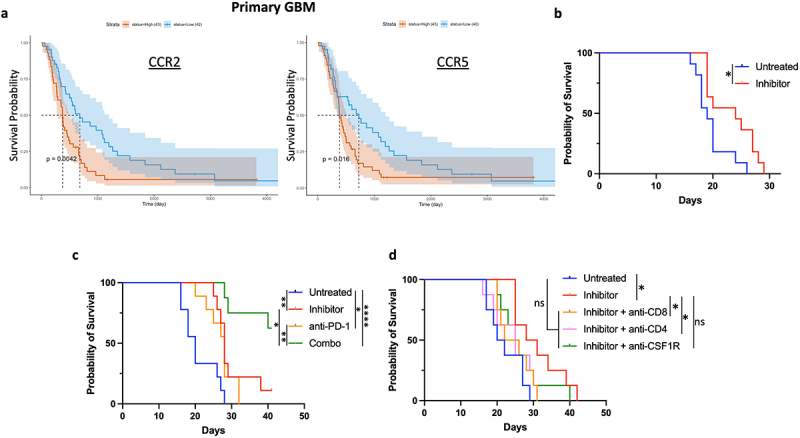
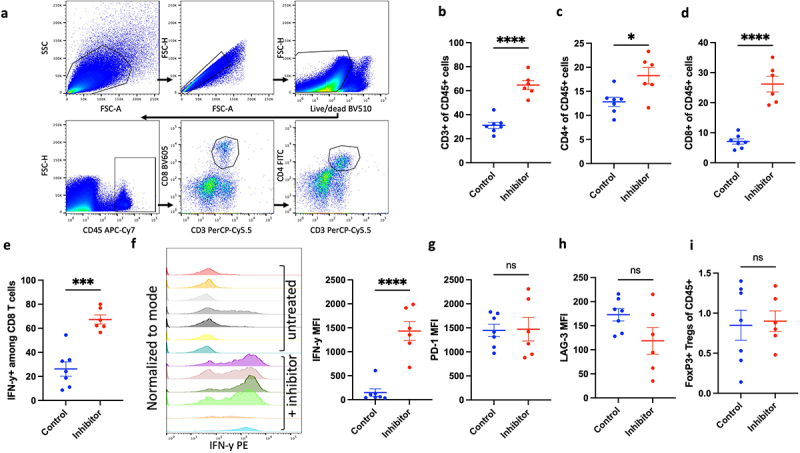
Immunotherapy has revolutionized the treatment of cancers. Reinvigorating lymphocytes with checkpoint blockade has become a cornerstone of immunotherapy for multiple tumor types, but the treatment of glioblastoma has not yet shown clinical efficacy. A major hurdle to treat GBM with checkpoint blockade is the high degree of myeloid-mediated immunosuppression in brain tumors that limits CD8 T-cell activity. A potential strategy to improve anti-tumor efficacy against glioma is to use myeloid-modulating agents to target immunosuppressive cells, such as myeloid-derived suppressor cells (MDSCs) in the tumor microenvironment. We found that the co-inhibition of the chemokine receptors CCR2 and CCR5 in murine model of glioma improves the survival and synergizes robustly with anti-PD-1 therapy. Moreover, the treatment specifically reduced the infiltration of monocytic-MDSCs (M-MDSCs) into brain tumors and increased lymphocyte abundance and cytokine secretion by tumor-infiltrating CD8 T cells. The depletion of T-cell subsets and myeloid cells abrogated the effects of CCR2 and CCR5 blockade, indicating that while broad depletion of myeloid cells does not improve survival, specific reduction in the infiltration of immunosuppressive myeloid cells, such as M-MDSCs, can boost the anti-tumor immune response of lymphocytes. Our study highlights the potential of CCR2/CCR5 co-inhibition in reducing myeloid-mediated immunosuppression in GBM patients.

Keywords: Glioma; Immunotherapy; MDSC.


Conflict of interest statement

M.L. has received research support from Arbor, BMS, Accuray, Tocagen, Biohaven, Kyrin-Kyowa and Biohaven, has been a consultant to Tocagen, VBI, InCephalo Therapeutics, Pyramid Bio, Merck, BMS, Insightec, Biohaven, Sanianoia, Hemispherian, Black Diamond Therapeutics, Novocure, is a shareholder of Egret Therapeutics and has patents for Focused radiation + checkpoint inhibitors, Local chemotherapy + checkpoint inhibitors and Checkpoint agonists for Neuro-Inflammation.

Figures

Figure 1.
Figure 1.
CCR2 and CCR5 are highly expressed in GBM. (a) Pan-cancer TCGA analysis comparing expression of CCR2, CCR5, CCL2 and CCL5 across multiple tumors. Red represents expression within tumors, and blue represents expression within normal tissue. (b) CGGA analysis comparing CCR2 and CCR5 expression across glioma grades. (c) UMAP of 96,132 CD45+/CD3- myeloid cells from 21 patients with Grade IV glioma (reanalysis of scRNA-Seq data from Jackson et al.). (d) CCR2 and CCR5 expression across all myeloid cell clusters. (e) Average expression and percent expressed of CCR2 and CCR5 in myeloid clusters, highlighting co-expression in M-MDSCs.
Figure 2.
Figure 2.
CCR2-CCR5 dual inhibitor improves survival in murine model of glioma. (a) Survival probability of GBM patients from CGGA database based on CCR2 and CCR5 expression. Blue represents low expression and red represents high expression. (b) Survival of C57BL/6 mice with intracranial orthotopic GL261 glioma (untreated n = 11, inhibitor n = 11). (c) Survival of C57BL/6 mice with intracranial orthotopic GL261 glioma (untreated n = 9, inhibitor n = 9, anti-PD-1 n = 9, anti-PD1 and inhibitor (combo) n = 8). (d) Survival of C57BL/6 mice with intracranial orthotopic GL261 glioma and depletion of CD4, CD8, and myeloid cells with anti-CSF1R antibodies (n = 8 for all groups). Differences in survival were calculated by the Mantel-Cox log-rank test. *p ≤ 0.05; **p ≤ 0.01; ****p ≤ 0.0001; ns, not significant. Survival experiments were repeated two times with similar results, and data from representative experiments are shown.
Figure 3.
Figure 3.
CCR2-CCR5 co-inhibitor reprograms immunosuppressive myeloid infiltration into glioma. (a) Flow cytometry plots showing gating scheme of myeloid cells from tumor-infiltrating immune cells. Flow cytometry analysis measuring percent of (b) CD11b+ myeloid cells (c) CD11b+F4/80+ macrophages (d) CD11c+ DCs among CD45+ immune cells infiltrating the tumor in the untreated, anti-PD1, CCR2/CCR5 co-inhibitor, and anti-PD1 + CCR2/CCR5 co-inhibitor group (combo) (n = 5 each). (e) Histograms depicting Ly6C expression among myeloid cells from tumors of untreated, anti-PD1, CCR2/CCR5 co-inhibitor, and combo groups. Flow cytometry analysis measuring polarization of CD11b+ myeloid cells into (f) M-MDSCs and (g) G-MDSCs within tumors from the four groups (n = 5 each). Flow cytometry analysis comparing percent of (h) M-MDSCs and (i) G-MDSCs infiltrating brain tumors across the four groups. Graphs show mean ± SEM. Statistical significance was analyzed by one-way ANOVA with Sidak’s multiple-comparisons post hoc test. *p ≤ 0.05; ***p ≤ 0.001; ns, not significant.
Figure 4.
Figure 4.
Inhibition of CCR2/CCR5 improves T-cell persistence and effector function in the tumors. (a) Flow cytometry plots showing gating scheme of lymphocytes from tumor-infiltrating immune cells. Flow cytometry analysis comparing abundance of (b) CD3+, (c) CD4+, (d) CD8+ TILs and (e) IFN-y+ CD8 TILs between control (n = 7) and inhibitor group (n = 6) in mice bearing GL261 orthotopic gliomas. (f) Mean fluorescence intensity (MFI) of IFN-y in CD8 TILs from untreated and inhibitor treated mice (g) Comparison of MFI of PD-1 and (h) LAG-3 between mice in control (n = 7) and inhibitor group (n = 6). (i) Comparison of FoxP3+ Tregs between control (n = 7) and inhibitor group (n = 6). Graphs show mean ± SEM. Statistical significance was analyzed by unpaired two-tailed Student’s t test (b-i), *p ≤ 0.05; ***p ≤ 0.001; ****p ≤ 0.0001; ns, not significant.

References

    1. Hughes CE, Nibbs RJB.. A guide to chemokines and their receptors. FEBS J. 2018;285(16):2944–8. doi:10.1111/febs.14466. - DOI - PMC - PubMed
    1. Bennett LD, Fox JM, Signoret N. Mechanisms regulating chemokine receptor activity. Immunology. 2011;134(3):246–256. doi:10.1111/j.1365-2567.2011.03485.x. - DOI - PMC - PubMed
    1. Baggiolini M. Chemokines in pathology and medicine. J Intern Med. 2001;250(2):91–104. doi:10.1046/j.1365-2796.2001.00867.x. - DOI - PubMed
    1. Proudfoot AEI. Chemokine receptors: multifaceted therapeutic targets. Nat Rev Immunol. 2002;2(2):106–115. doi:10.1038/nri722. - DOI - PMC - PubMed
    1. Fantuzzi L, Tagliamonte M, Gauzzi MC, Lopalco L. Dual CCR5/CCR2 targeting: opportunities for the cure of complex disorders. Cell Mol Life Sci. 2019;76(24):4869–4886. doi:10.1007/s00018-019-03255-6. - DOI - PMC - PubMed