. 2024 Aug 2;14(8):1496-1521.
doi: 10.1158/2159-8290.CD-23-0539.

ZNF397 Deficiency Triggers TET2-Driven Lineage Plasticity and AR-Targeted Therapy Resistance in Prostate Cancer

Affiliations

ZNF397 Deficiency Triggers TET2-Driven Lineage Plasticity and AR-Targeted Therapy Resistance in Prostate Cancer

Yaru Xu et al. Cancer Discov. .

Abstract

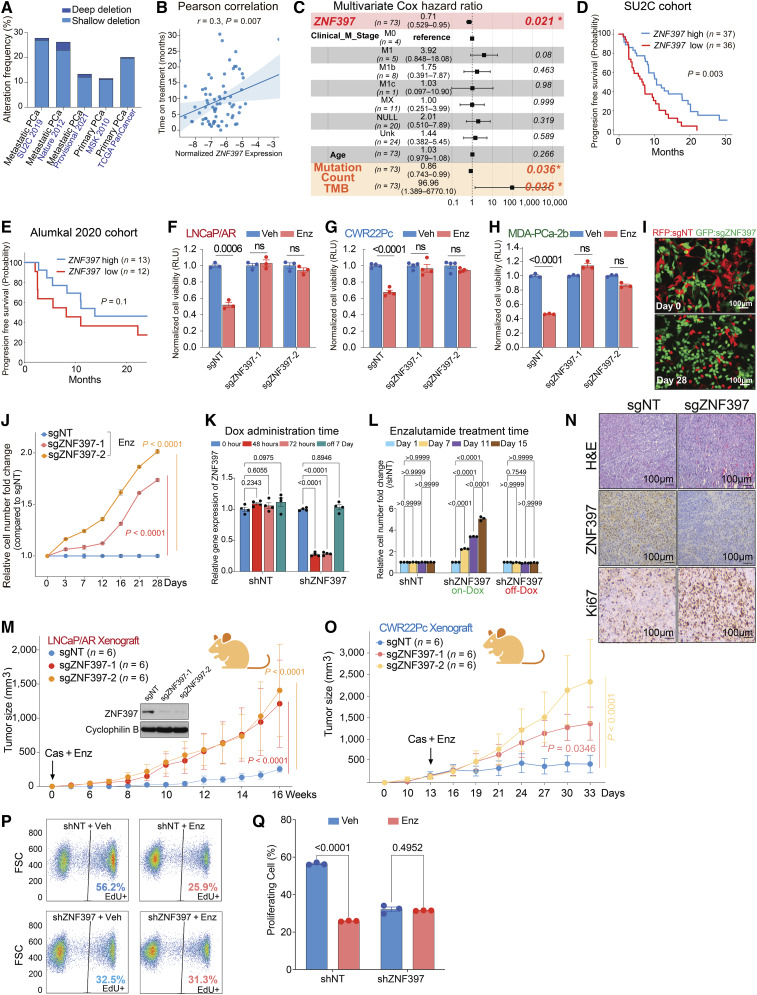
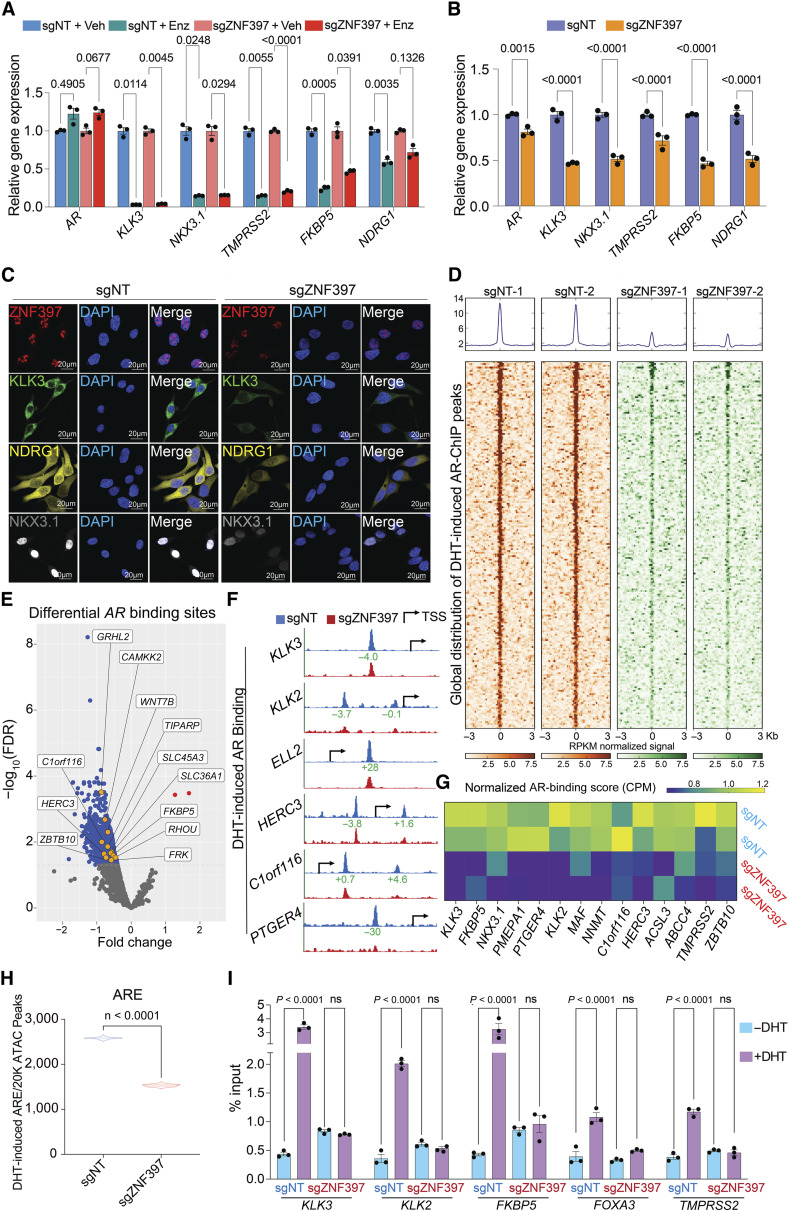
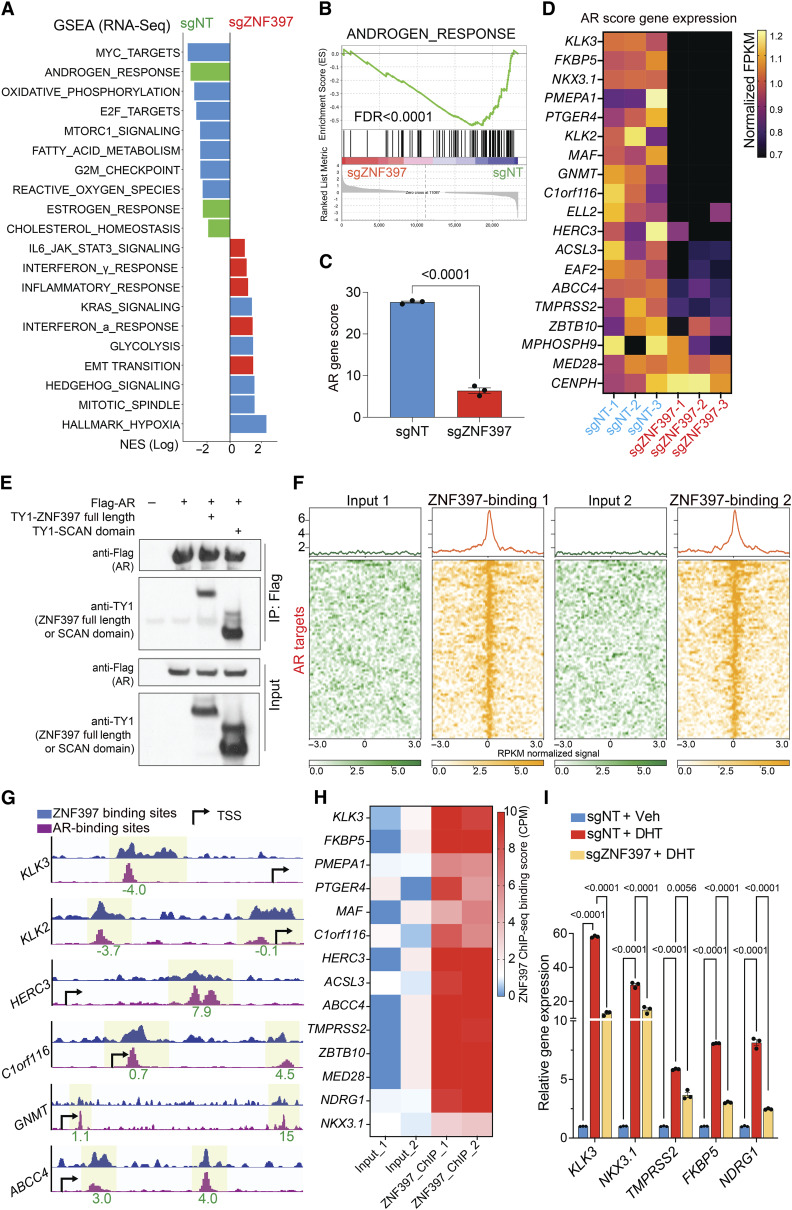
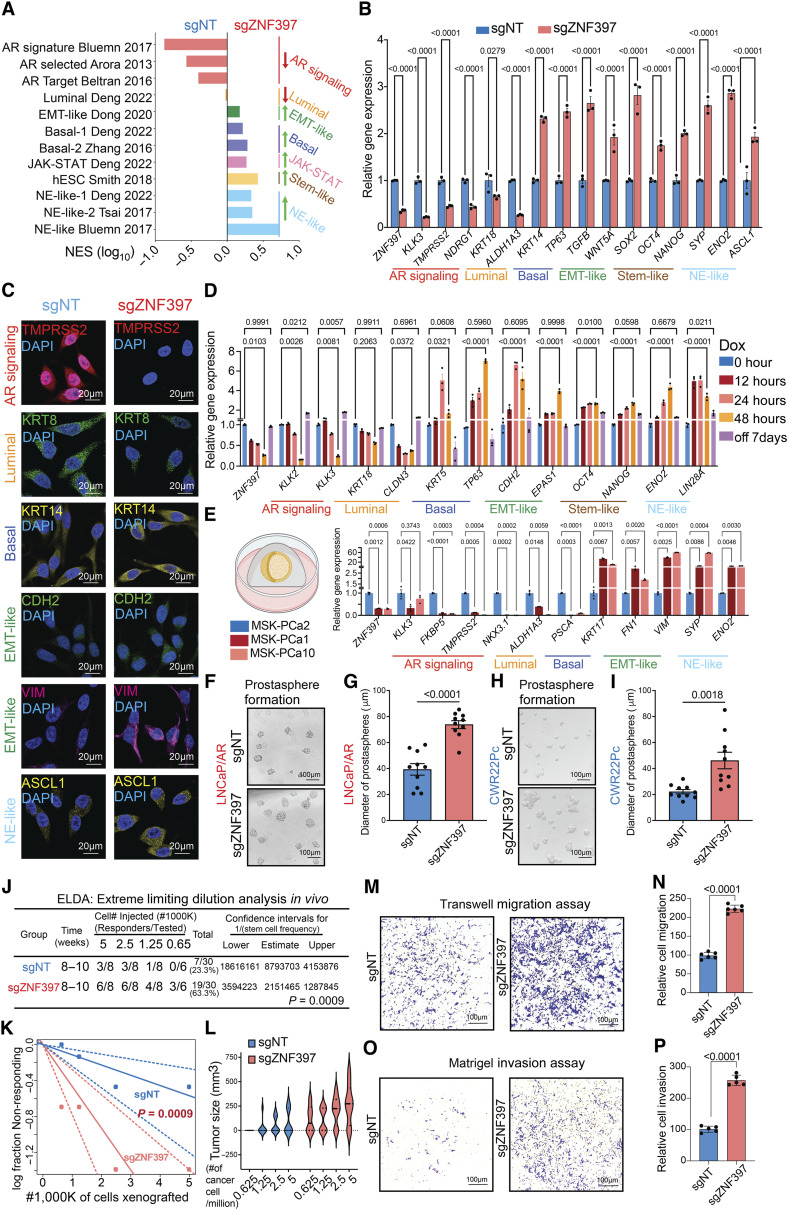
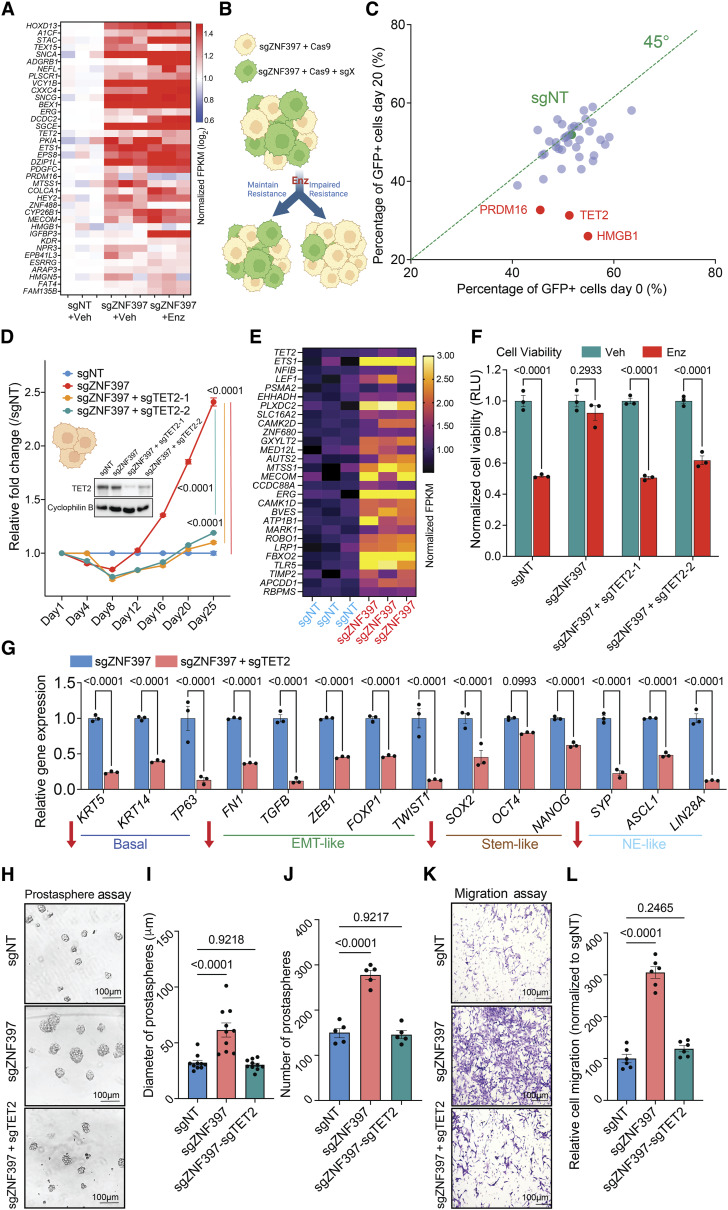
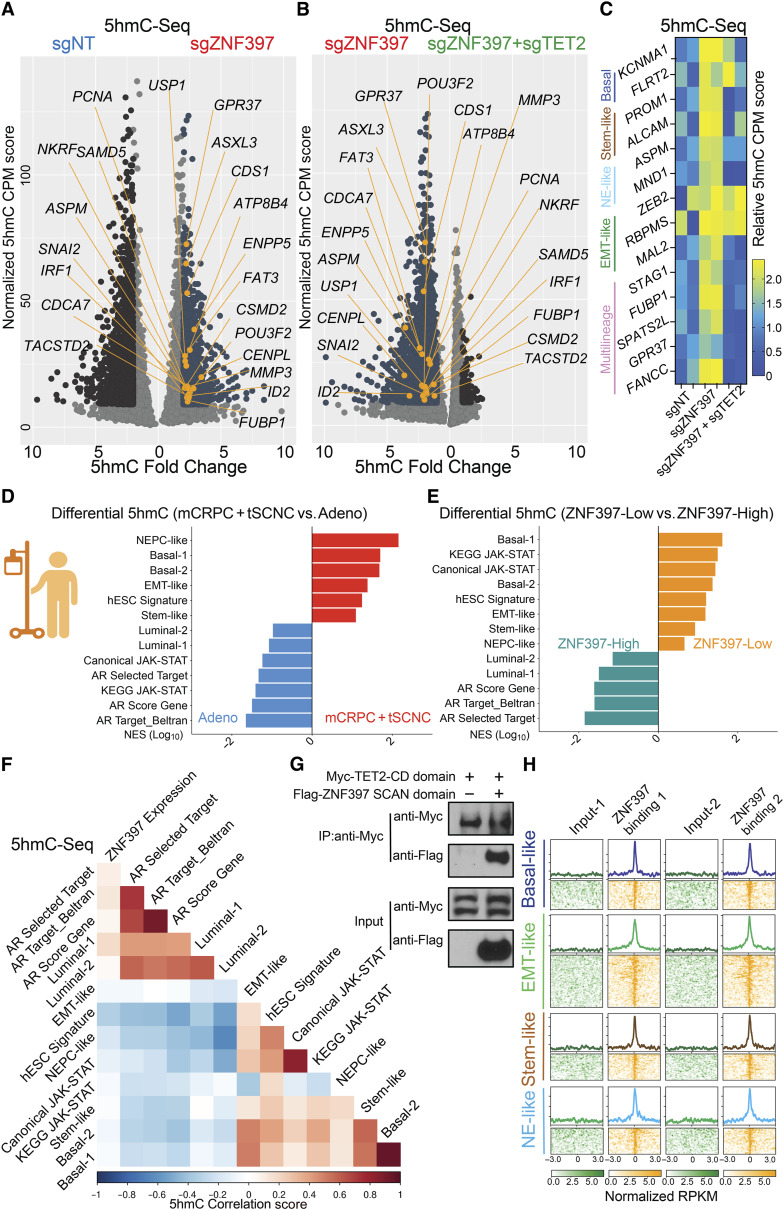
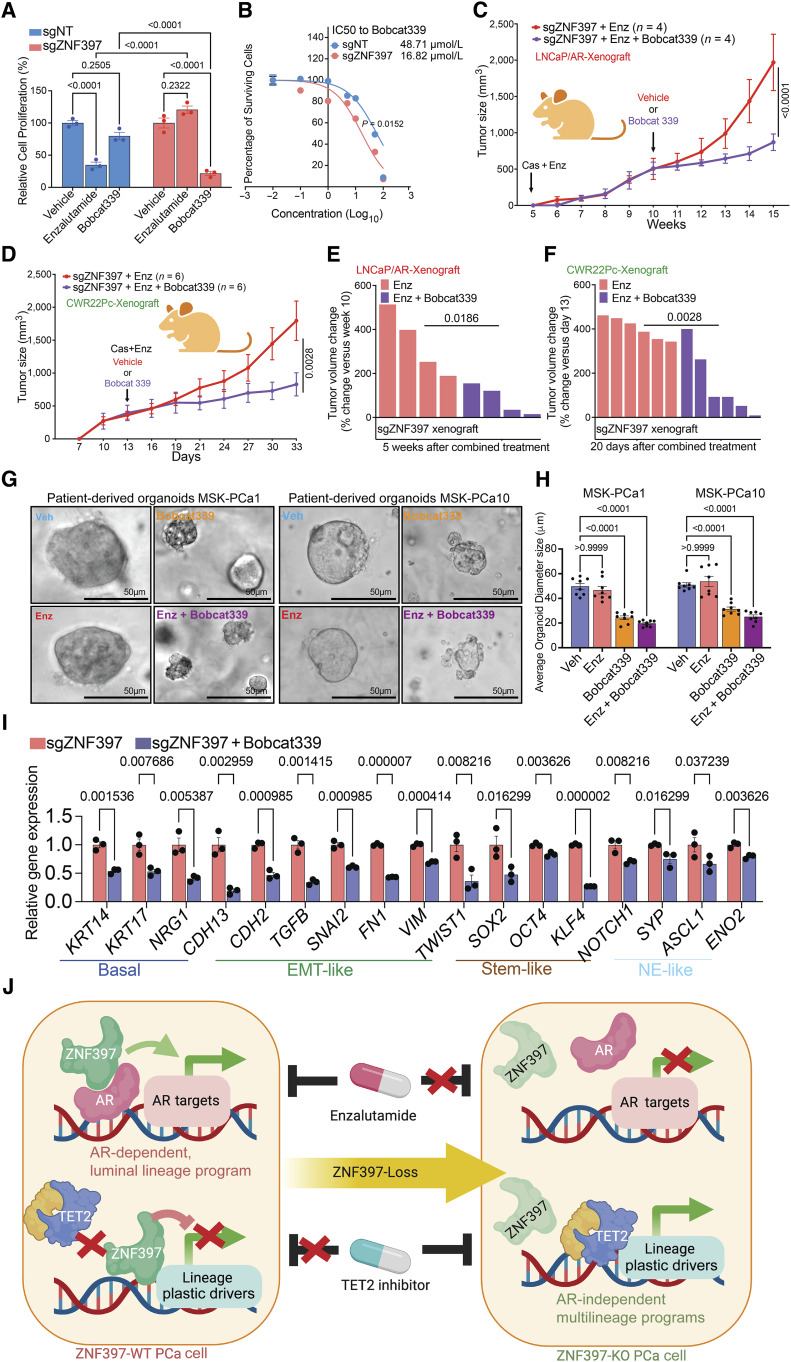
Cancer cells exhibit phenotypical plasticity and epigenetic reprogramming that allows them to evade lineage-dependent targeted treatments by adopting lineage plasticity. The underlying mechanisms by which cancer cells exploit the epigenetic regulatory machinery to acquire lineage plasticity and therapy resistance remain poorly understood. We identified zinc finger protein 397 (ZNF397) as a bona fide coactivator of the androgen receptor (AR), essential for the transcriptional program governing AR-driven luminal lineage. ZNF397 deficiency facilitates the transition of cancer cell from an AR-driven luminal lineage to a ten-eleven translocation 2 (TET2)-driven lineage plastic state, ultimately promoting resistance to therapies inhibiting AR signaling. Intriguingly, our findings indicate that a TET2 inhibitor can eliminate the resistance to AR-targeted therapies in ZNF397-deficient tumors. These insights uncover a novel mechanism through which prostate cancer acquires lineage plasticity via epigenetic rewiring and offer promising implications for clinical interventions designed to overcome therapy resistance dictated by lineage plasticity. Significance: This study reveals a bifurcated role of ZNF397, and a TET2-driven epigenetic mechanism regulating tumor lineage plasticity and therapy response in prostate cancer, enhances the understanding of drug resistance, and unveils a new therapeutic strategy for overcoming androgen receptor-targeted therapy resistance.


Conflict of interest statement

M. Sjöström reports grants from the Prostate Cancer Foundation during the conduct of the study. Y. Chen reports grants from NCI and Prostate Cancer Foundation during the conduct of the study; grants from Foghorn Pharmacetuicals and personal fees and other support from ORIC Pharmaceuticals outside the submitted work. A.B. Hanker reports grants from NIH/NCI during the conduct of the study; grants from Breast Cancer Research Foundation, non-financial support from Tempus and Daiichi Sankyo; grants from Takeda and Lilly; non-financial support from Puma Biotechnology outside the submitted work. G.V. Raj reports other support from Etirarx, Bayer, and Pfizer; other support from Astellas outside the submitted work. Zhao Wang reports grants from NIGMS R01GM143380, and NHLBI R01HL162842; grants from Welch Fundation Q-2173-20230405 outside the submitted work. C.L. Arteaga reports personal fees from Sanofi, OrigiMed, TAIHO Oncology, AstraZeneca, Daiichi Sankyo, Laekna Therapeutics; grants from Pfizer; personal fees from Komen Foundation outside the submitted work. H. Liang reports H. Liang is a shareholder and scientific advisor of Precision Scientific Ltd. F.Y. Feng reports F.Y. Feng is an advisor and holds equity in Artera, and has served as an advisor to Astellas, Bayer, Blue Earth Diagnostics, BMS, ClearNote, Janssen, Myovant, Point Biopharma, Novartis, Roivant, Sanofi, SerImmune and Amgen. T. Wang reports other support from NightStar Biotechnologies, Inc. and personal fees from Merck, Inc. outside the submitted work. P. Mu reports grants from National Cancer Institute, Department of Defense, Cancer Prevention Research Institute, Prostate Cancer Foundation, and Welch Foundation during the conduct of the study; personal fees from Accutar Biotechnology outside the submitted work. No disclosures were reported by the other authors.

Figures

Figure 1.
Figure 1.
ZNF397 deficiency confers resistance to AR-targeted therapy. A, Stacked bar plot shows the percentage of cancer samples with genomic alterations within the ZNF397 locus in different patient cohorts with prostate cancer, as created using cbioportal.org. B, Pearson correlation analysis shows the relationship between ZNF397 mRNA and time of treatment on Abi/Enz/Apa in the SU2C mCRPC patient subcohort. Abi, abiraterone; Enz, enzalutamide; Apa, apalutamide. ZNF397 expression was normalized to a collection of housekeeping genes. C, Multivariate Cox hazard ratio analysis represents the significant risk factors associated with resistance to Abi/Enz/Apa in the subcohort of patients with SU2C mCRPC. The P value was calculated with the log-rank test. D and E, Kaplan–Meier curve represents the treatment duration on AR-targeted therapies of patients with high (above median) or low (below median) expression of ZNF397 in (D) SU2C and (E) Alumkal 2020 cohorts. The P value was calculated with the log-rank test. F–H, Bar plots represent the relative cell viability of LNCaP/AR (F), CWR22Pc (G), and MDA-PCa-2b cells (H) transduced with Cas9 and annotated CRISPR guide RNAs, measured as values of relative luminescence units and normalized to vehicle-treated conditions. Enz denotes enzalutamide treatment (10 µmol/L for LNCaP/AR and MDA-PCa-2b, 1 µmol/L for CWR22Pc) for several days (7 days for LNCaP/AR, 5 days for CWR22Pc, and MDA-PCa-2b). Veh denotes vehicle, DMSO. I, Fluorescence microscope imaging shows the cell mixtures of sgZNF397 cells (green) and sgNT cells (red) on day 0 and day 28 of the FACS-based competition assay cultured with 10 µmol/L enzalutamide; representative pictures of n = 3 independently treated cell cultures are shown. J, Relative cell number fold change of LNCaP/AR cells transduced with Cas9 and annotated CRISPR guide RNAs, measured by FACS-based competition assay. Enz denotes 10 µmol/L enzalutamide treatment for 28 days. K, Relative gene expression levels of ZNF397 in the inducible shZNF397 LNCaP/AR cells treated with doxycycline (Dox) for various lengths of time. Data are normalized to 0 hour. L, Relative cell number fold change of LNCaP/AR cells transduced with inducible shZNF397. On-Dox cells were consistently exposed to Dox during the Enz treatment period, while Off-Dox cells were treated with Dox for 3 days and removed from Dox for 7 days before growth measurement. Data are normalized to day 1, measured by FACS-based competition assay. M, Tumor growth curve of xenografted LNCaP/AR cells transduced with annotated guide RNAs in castrated mice. Enz denotes enzalutamide treatment at 10 mg/kg from day 1 of grafting. Cas denotes castration. The number of tumors in each group was annotated. N, H&E and immunohistochemical staining of ZNF397 and Ki67 on sgNT and sgZNF397 xenograft tumor slides. Scale bar represents 100 μm. O, Tumor growth curve of xenografted CWR22Pc cells transduced with annotated guide RNAs in intact mice, which were castrated and treated with enzalutamide when average tumor burden reached 300 mm3. Enz denotes enzalutamide treatment at 1 mg/kg. Cas denotes castration. The number of tumors in each group was annotated. P, Representative FACS results showing the percentage of activated proliferating LNCaP/AR cells (EdU+) transduced with annotated hairpins under various treatment conditions, measured by a FACS-based EdU-incorporation assay. Q, Bar plots represent the quantification of panel P, displaying the percentage of EdU-positive and actively proliferating cells under annotated conditions. Veh denotes DMSO, and Enz denotes Enzalutamide. For all panels unless otherwise noted, n = 3 independently treated cell cultures and mean ± SEM are presented. P values were calculated using two-way ANOVA with Bonferroni multiple-comparison test. Schematic figure was created with BioRender.com. See also Supplementary Fig. S1.
Figure 2.
Figure 2.
ZNF397-KO impairs AR-driven signaling and alters the AR cistrome. A, Relative gene expression levels of AR and AR target genes in LNCaP/AR cells transduced with Cas9 and annotated gRNAs and treated with vehicle (Veh, DMSO) or enzalutamide (Enz, 10 µmol/L) for 7 days, normalized to sgNT + Veh group. B, Relative gene expression levels of AR and AR target genes in LNCaP/AR cells transduced with Cas9 and annotated guide RNAs, normalized to sgNT + Veh group. P values were calculated using multiple t tests with Benjamini correction. C, Representative IF staining images of LNCaP/AR cells transduced with Cas9 and annotated guide RNAs with annotated antibodies; n = 3 independent treated cell cultures. D, Global distribution of AR binding peaks based on AR ChIP-seq results. Reads from two independently cultured cell samples were plotted. E, Volcano plot represents the genomic loci with most significantly depleted or gained AR peaks, in ZNF397-KO cells compared to the control cells. Significantly changed gene loci were annotated as blue dots and identified AR target genes were annotated as yellow dots. Reads from two independently cultured cell samples were pooled for analysis. F, Representative AR binding sites in the genomic loci of canonical AR gene loci in the LNCaP/AR cell transduced with Cas9 and annotated guide RNAs, based on AR ChIP-seq analysis. The binding peak distances (kilo base pair) to TSS (Transcriptional Start Site) are annotated in green. G, Heatmap represents the AR binding peak score (CPM, see “Methods”) in the genomic loci of AR Score genes (14 of 20) in the sgZNF397 cells compared to sgNT cells. Reads from two independent cell cultures/guides, matching input controls were used for analysis. H, Violin plot represents the number of DHT-induced ARE peaks per 20k ATAC-seq peaks in annotated cells and treatment conditions. P values were calculated using two-tailed t test. I, AR ChIP-qPCR of the genomic loci of canonical AR target genes in LNCaP/AR cells transduced with annotated constructs, treated with Veh (−DHT) or DHT (+DHT). For all panels unless otherwise noted, n = 3 independently treated cell cultures and mean ± SEM are presented. P values were calculated using two-way ANOVA with Bonferroni multiple-comparison test. See also Supplementary Fig. S2, S3 and Supplementary Table S1.
Figure 3.
Figure 3.
ZNF397 acts as a transcriptional coactivator essential for AR-driven signaling. A, GSEA Pathways analysis shows cancer-related signaling pathways significantly altered in ZNF397-KO cells compared to wild-type cells, lineage specific pathways were highlighted with color: green-AR dependent and luminal lineage pathways, red-lineage plastic signaling pathways. B, GSEA analysis of androgen response gene expression in ZNF397-KO cells compared to wild-type cells. C, AR gene score based on the expression of canonical AR target genes (AR Score Gene) in ZNF397-KO and wild-type cells. mean ± SEM are presented. P values were calculated using two-tailed t test. D, Heatmap represents the relative gene expression of AR Score genes in ZNF397-KO cells compared to wild-type cells, measured by RNA-seq. E, Co-IP of AR (with Flag tag) and full length or the SCAN domain of ZNF397 (with TY1 tag) in HEK293T cells. F, Global distribution of ZNF397 binding peaks at known AR binding sites (as determined by AR ChIP-seq), based on ZNF397 ChIP-seq in LNCaP/AR cells. Reads from two independently cultured cell samples were plotted and matching input controls were used for analysis. G, Representative AR-binding sites (as determined by AR ChIP-seq) and ZNF397-binding sites (as determined by ZNF397 ChIP-seq) in the genomic loci of canonical AR gene loci in the LNCaP/AR cell. The binding peak distances (kilo base pair) to TSS (transcriptional start site) are annotated in green. H, ZNF397-binding peak score (CPM, see “Methods”) in the genomic loci of AR Score genes (14 of 20) in LNCaP/AR cells. Reads from two independent cell cultures/guide were plotted, matching input controls were used for analysis. I, Relative gene expression levels of AR target genes in LNCaP/AR cells transduced with Cas9 and annotated guide RNAs, and treated with Veh (EtOH) or 10 nmol/L DHT for 12 hours, normalized and compared to sgNT + Veh group. For all panels unless otherwise noted, mean ± SEM are presented. P values were calculated using two-way ANOVA with Bonferroni multiple-comparison test. See also Supplementary Fig. S4 and Supplementary Table S2.
Figure 4.
Figure 4.
ZNF397-KO promotes lineage plasticity and multilineage transcriptional programs. A, GSEA pathway analysis shows lineage-specific gene signatures significantly altered in ZNF397-KO cells compared to wild-type cells, lineage-specific pathways were highlighted with various colors. B, Bar plots represent relative gene expression levels of canonical lineage-specific marker genes in LNCaP/AR cells transduced with Cas9 and annotated guide RNAs, as measured by qPCR assay. Data are normalized to sgNT cells. C, IF staining of LNCaP/AR cells transduced with Cas9 and annotated guide RNAs using antibodies against lineage-specific markers; representative images from n = 3 independent treated cell cultures are shown. D, Bar plots represent relative gene expression of canonical lineage-specific marker genes in inducible shZNF397 LNCaP/AR cells treated with Dox for varying lengths of time. Data are normalized to 0 hour. E, Bar plots represent relative gene expression of canonical lineage-specific marker genes in ZNF397-high PDOs compared to ZNF397-low PDOs, measured by qPCR. F, Representative images of LNCaP/AR cell prostasphere formation assay across independently treated cell cultures. G, Quantitative analysis presenting the number of LNCaP/AR prostaspheres formed from independently treated cell cultures for each annotated cell line. H, Representative images of a CWR22Pc cell prostasphere formation assay across independently treated cell cultures. I, Quantitative analysis presenting the number of CWR22Pc prostaspheres formed from independently treated cell cultures for each cell line. J, Number of tumors generated by xenografting various dilutions and numbers of annotated LNCaP/AR cells. Estimates for ELDA 1/(stem cell frequency), top and bottom confidence intervals, and P-value are presented. K, Log-fraction plot represents the ELDA limiting dilution model fitted to the data in J. The slope of the line indicates the log-active cell fraction. Dotted lines represent the 95% confidence interval. L, Violin plot represents the tumor sizes of tumors generated by xenografting various dilutions and numbers of annotated LNCaP/AR cells. All data points and P-values in J–L were calculated using established ELDA software, as described in the experimental procedures. M, Representative images of an LNCaP/AR cell transwell migration assay from three independently treated cell cultures. N, Quantification of migrated cell numbers from representative images, taken from three independently treated cell cultures for each of the cell lines. O, Representative images of an LNCaP/AR cell invasion assay from three independently treated cell cultures. P, Quantification of the numbers of invading cells from representative images, taken from three independently treated cell cultures for each of the cell lines. For G, I, N, and P, P-values were calculated using a two-tailed t test. For all panels unless otherwise noted, mean ± SEM are presented. P values were calculated using two-way ANOVA with Bonferroni multiple-comparison test. Schematic figure was created with BioRender.com. See also Supplementary Figs. S5, S6 and Supplementary Table S3.
Figure 5.
Figure 5.
TET2 is the crucial driver of lineage plasticity and AR-targeted therapy resistance. A, Unsupervised hierarchical clustering of normalized expression of differentially expressed genes whose expression was changed in ZNF397-KO cells treated with vehicle or enzalutamide, comparing to sgNT + Veh group. B, Schematic representation of the functional CRISPR library screen in ZNF397-KO LNCaP/AR cells. sgZNF397 cells (GFP negative) were transduced with Cas9 and sgRNAs targeting individual candidate resistance driver genes (GFP positive). Then these sgZNF397 + Cas9 + sgX (GFP positive) cells were mixed with sgZNF397 (GFP negative) cells to achieve a cell mixture of 40%–70% GFP positive cells. C, Scatter plot summarizing the results of the screen. Each dot represents gRNAs targeting a specific gene. The X axis is the percentage of GFP cells at day 0 and the Y axis is the percentage at day 20. The green dot identifies the sgNT control. Genes that scored positive in the screen are highlighted in red and labeled. Green dotted represents the 45° line. D, Relative cell number fold change of LNCaP/AR cells transduced with Cas9 and annotated CRISPR guide RNAs, measured by FACS-based competition assay. Enz denotes 10 µmol/L enzalutamide treatment for 25 days. E, Relative gene expression levels of canonical TET2 target genes in the LNCaP/AR cells transduced with Cas9 and annotated guide RNAs, measured by RNA-seq analysis. Data are normalized to sgNT. F, Bar plots represent the relative cell viability of LNCaP/AR cells transduced with Cas9 and annotated CRISPR guide RNAs, measured as values of RLU and normalized to vehicle-treated conditions. Enz denotes 10 µmol/L enzalutamide treatment for 7 days and Veh denotes DMSO. G, Bar plots represent the relative gene expression levels of canonical lineage specific marker genes in the LNCaP/AR cells transduced with Cas9 and annotated guide RNAs, measured by qPCR assay, normalized to sgZNF397. H, Representative images of a LNCaP/AR cell prostasphere formation assay across independently treated cell cultures. I, Quantitative analysis presenting the diameter of LNCaP/AR prostaspheres formed from each annotated cell line. J, Quantitative analysis presenting the number of LNCaP/AR prostaspheres formed from each annotated cell line. K, Representative images of an LNCaP/AR cell transwell migration assay of independently treated cell cultures. L, Quantification of the number of migrated cells based on representative images from three separate treated cell cultures for each cell line. For all panels unless otherwise noted, n = 3 independently treated cell cultures and mean ± SEM are presented. P values were calculated using two-way ANOVA with Bonferroni multiple-comparison test. Schematic figure was created with BioRender.com. See also Supplementary Fig. S7 and Supplementary Table S4.
Figure 6.
Figure 6.
ZNF397-KO results in TET2-driven epigenetic and 5hmC rewiring. A, Volcano plot represents the genomic loci with most significantly enriched or depleted 5hmC modification, in ZNF397-KO cells compared to the control sgNT cells, according to genomic 5hmC-seal seq. Significantly changed gene loci were annotated as dark blue dots, and lineage-plastic signature genes with most significantly enriched 5hmC were annotated as yellow dots. Reads from two independently cultured cell samples were pooled for analysis. B, Volcano plot represents the genomic loci with most significantly enriched or depleted 5hmC modifications, in ZNF397/TET2-double-KO (sgZNF397 + sgTET2) cells compared to the ZNF397-KO (sgZNF397) cells, according to genomic 5hmC–seal seq. Significantly changed gene loci were annotated as dark blue, and lineage-plastic signature genes with most significantly depleted 5hmC were annotated as yellow dots. Reads from two independently cultured cell samples were pooled for analysis. C, Heatmap represents the 5hmC enrichment score (CPM, see “Methods”) in the genomic loci of lineage plastic marker genes in the sgNT, sgZNF397 and sgZNF397 + sgTET2 cells. D, Bar plot presents the lineage gene signatures with most enriched or depleted 5hmC modification in patients with AR-independent mCRPC and t-SCNC compared to patients with AR-dependent adenocarcinoma in a cohort of patients with prostate cancer, based on the results of genomic 5hmC-seq. E, Bar plot presents the lineage gene signatures with most enriched or depleted 5hmC modifications in patients with ZNF397-high (ZNF397 expression above median) compared to patients with ZNF397-low (ZNF397 expression below median) in a cohort of patients with prostate cancer, based on the results of genomic 5hmC-seq. F, Heatmap represents the correlation between ZNF397 expression and the 5hmC modification in the genomic loci of those marker genes of lineage-specific gene signatures, based on the results of genomic 5hmC-seq. G, Co-IP of ZNF397 SCAN domain and the TET2 CD domain with a Flag or Myc tag in HEK293T cells. H, Global distribution of ZNF397 binding peaks at known lineage-plastic and multilineage signature gene loci, based on ZNF397 ChIP-seq in LNCaP/AR cells. Reads from two independently cultured cell samples were plotted and matching input controls were used for analysis. Schematic figure was created with BioRender.com.See also Supplementary Figs. S8, S9 and Supplementary Table S5.
Figure 7.
Figure 7.
Targeting TET2-driven epigenetic rewiring to overcome resistance. A, Relative cell proliferation of LNCaP/AR cells transduced with annotated guide RNAs and treated with vehicle (DMSO), enzalutamide (10 µmol/L for 7 days), or Bobcat339 (10 µmol/L for 7 days). B, Dose–response curve of ZNF397-KO and wild-type cells treated with TET2 inhibitor Bobcat339. P values were calculated by non-linear regression with extra sun-of-squares F test. C, Tumor growth curve of xenografted ZNF397-KO LNCaP/AR cells in castrated mice treated with enzalutamide. The mice were randomly separated into two groups when their tumors reached 500 mm3 and treated with vehicle or Bobcat339. D, Tumor growth curve of xenografted ZNF397-KO CWR22Pc cells in intact mice. The mice were randomly separated into two groups and castrated when their tumors reached 500 mm3 and treated with vehicle + enzalutamide or Bobcat339 + enzalutamide. E, Waterfall plot displaying changes in tumor size of xenografted ZNF397-KO LNCaP/AR cells after 5 week of combined treatments. F, Waterfall plot displaying changes in tumor size of xenografted ZNF397-KO LNCaP/AR cells after 20 days of combined treatments. For C–F, Enz denotes enzalutamide treatment at 10 mg/kg. Bobcat 339 denotes Bobcat339 treatment at 10 mg/kg. n = number of independent xenografted tumors in each group. G, Bright field pictures represent the 3D-cultured patient derived organoid models, treated with vehicle (Veh), 5 µmol/L enzalutamide (Enz), 10 µmol/L Bobcat339 or enzalutamide + Bobcat339 for 7 days. H, Bar plots represent the size of the 3D-cultured patient derived organoids, treated with vehicle (Veh), 5 µmol/L enzalutamide (Enz), 10 µmol/L Bobcat339 or enzalutamide + Bobcat339 for 7 days. I, Relative gene expression levels of canonical lineage specific marker genes in ZNF397-KO and wild-type LNCaP/AR cells treated with vehicle (DMSO) or Bobcat339 (10 µmol/L for 5 days), measured by qPCR assay. Data are normalized to vehicle-treated cells. J, A schematic figure illustrates the bifurcated role of ZNF397 as a critical coactivator of AR and a suppressor of TET2-dependent lineage plasticity. ZNF397 deficiency in prostate cancer facilitates the transition of prostate cancer cells from an AR-driven luminal lineage to a TET2-driven, multilineage, and lineage-plastic state, which no longer responded to AR-targeted therapy. A yet-to-be identified TET2 cofactor is depicted as a yellow protein. For all panels unless otherwise noted, n = 3 independently treated cell cultures and mean ± SEM are presented. P values were calculated using two-way ANOVA with Bonferroni multiple-comparison test. Schematic figure was created with BioRender.com. See also Supplementary Fig. S10.

Update of

References

    1. Hanahan D. Hallmarks of cancer: new dimensions. Cancer Discov 2022;12:31–46. - PubMed
    1. Beltran H, Hruszkewycz A, Scher HI, Hildesheim J, Isaacs J, Yu EY, et al. . The role of lineage plasticity in prostate cancer therapy resistance. Clin Cancer Res 2019;25:6916–24. - PMC - PubMed
    1. Deng S, Wang C, Wang Y, Xu Y, Li X, Johnson NA, et al. . Ectopic JAK-STAT activation enables the transition to a stem-like and multilineage state conferring AR-targeted therapy resistance. Nat Cancer 2022;3:1071–87. - PMC - PubMed
    1. Ellis L. Understanding cancer lineage plasticity: reversing therapeutic resistance in metastatic prostate cancer. Pharmacogenomics 2017;18:597–600. - PubMed
    1. Mu P, Zhang Z, Benelli M, Karthaus WR, Hoover E, Chen C-C, et al. . SOX2 promotes lineage plasticity and antiandrogen resistance in TP53- and RB1-deficient prostate cancer. Science 2017;355:84–8. - PMC - PubMed