. 2024 Mar 1;13(5):1437.
doi: 10.3390/jcm13051437.

Thrombosis and Bleeding Risk Scores Are Strongly Associated with Mortality in Hospitalized Patients with COVID-19: A Multicenter Cohort Study

Affiliations

Thrombosis and Bleeding Risk Scores Are Strongly Associated with Mortality in Hospitalized Patients with COVID-19: A Multicenter Cohort Study

Kunapa Iam-Arunthai et al. J Clin Med. .

Abstract

Background: Internationally established guidelines mention pharmacological prophylaxis for all hospitalized COVID-19 patients. However, there are concerns regarding the efficacy and safety of anticoagulants. This study investigated the associations between thrombosis/bleeding risk scores and clinical outcomes. Methods: We conducted a retrospective review of adult patients admitted to two hospitals between 2021 and 2022. We analyzed clinical data, laboratory results, low molecular weight heparin (LMWH) use, thrombosis, bleeding, and 30-day survival. Results: Of the 160 patients, 69.4% were female, and the median age was 59 years. The rates of thrombotic complications and mortality were 12.5% and 36.3%, respectively. LMWH prophylaxis was administered to 73 of the patients (45.6%). The patients with high Padua prediction scores (PPS) and high IMPROVEVTE scores had a significantly higher risk of venous thromboembolism (VTE) compared to those with low scores (30.8% vs. 9.0%, p = 0.006 and 25.6% vs. 7.7%, p = 0.006). Similarly, elevated IMPROVEVTE and IMPROVEBRS scores were associated with increased mortality (hazard ratios of 7.49 and 6.27, respectively; p < 0.001). Interestingly, LMWH use was not associated with a decreased incidence of VTE when stratified by risk groups. Conclusions: this study suggests that COVID-19 patients with high thrombosis and bleeding risk scores have a higher mortality rate.

Keywords: COVID-19; IMPROVE score; Padua prediction score; mortality; venous thromboembolism.


Conflict of interest statement

The authors declare that this research was conducted in the absence of any commercial or financial relationships that could be construed as potential conflicts of interest.

Figures

Figure 1
Figure 1
Receiver operating characteristic (ROC) curves of the venous thromboembolism (PPSVTE, IMPROVEVTE) and bleeding (IMPROVEBRS) risk score models for mortality prediction. The areas under the curves (AUC) were 0.68 (PPSVTE), 0.79 (IMPROVEVTE), 0.67 (IMPROVEBRS), and 0.82 (IMPROVEDDVTE).
Figure 2
Figure 2
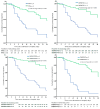
Kaplan–Meier curve for cumulative survival according to difference venous thromboembolism and bleeding risk scores among 160 patients. (A) Comparison of cumulative survival rates between a Padual prediction score of VTE of <4 and ≥4 subgroup; p-value < 0.001. (B) Comparison of cumulative survival rates between an IMPROVE prediction score of VTE of <2 and ≥2 subgroup; p-value < 0.001. (C) Comparison of cumulative survival rates between an IMPROVEDD prediction score of VTE of <2 and ≥2 subgroup; p-value < 0.001. (D) Comparison of cumulative survival rates between an IMPROVE prediction score of bleeding of <7 and ≥7 subgroup; p-value < 0.001. (E) Comparison of cumulative survival rates between a combination of PPSVTE (≥4) + IMPROVEBRS (≥7) (high risk) and a combination of PPSVTE (<4) or IMPROVEBRS (<7) (low risk) prediction score subgroups; p-value < 0.001. (F) Comparison of cumulative survival rates between a combination of IMPROVEVTE (≥2) + IMPROVEBRS (≥7) (high risk) and a combination of IMPROVEVTE (<2) or IMPROVEBRS (<7) (low risk) prediction score subgroups; p-value < 0.001. (G) Comparison of cumulative survival rates between a combination of IMPROVEDDVTE (≥2) + IMPROVEBRS (≥7) (high risk) and a combination of IMPROVEDDVTE (<2) or IMPROVEBRS (<7) (low risk) prediction score subgroups; p-value < 0.001.
Figure 2
Figure 2
Kaplan–Meier curve for cumulative survival according to difference venous thromboembolism and bleeding risk scores among 160 patients. (A) Comparison of cumulative survival rates between a Padual prediction score of VTE of <4 and ≥4 subgroup; p-value < 0.001. (B) Comparison of cumulative survival rates between an IMPROVE prediction score of VTE of <2 and ≥2 subgroup; p-value < 0.001. (C) Comparison of cumulative survival rates between an IMPROVEDD prediction score of VTE of <2 and ≥2 subgroup; p-value < 0.001. (D) Comparison of cumulative survival rates between an IMPROVE prediction score of bleeding of <7 and ≥7 subgroup; p-value < 0.001. (E) Comparison of cumulative survival rates between a combination of PPSVTE (≥4) + IMPROVEBRS (≥7) (high risk) and a combination of PPSVTE (<4) or IMPROVEBRS (<7) (low risk) prediction score subgroups; p-value < 0.001. (F) Comparison of cumulative survival rates between a combination of IMPROVEVTE (≥2) + IMPROVEBRS (≥7) (high risk) and a combination of IMPROVEVTE (<2) or IMPROVEBRS (<7) (low risk) prediction score subgroups; p-value < 0.001. (G) Comparison of cumulative survival rates between a combination of IMPROVEDDVTE (≥2) + IMPROVEBRS (≥7) (high risk) and a combination of IMPROVEDDVTE (<2) or IMPROVEBRS (<7) (low risk) prediction score subgroups; p-value < 0.001.
Figure 3
Figure 3
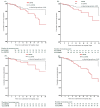
Kaplan–Meier curve for cumulative survival rates between patients with and without low molecular weight heparin, according to each low venous thromboembolism and bleeding risk score. (A) Comparison of cumulative survival rates among patients with Padual prediction scores of VTE ≥ 4 subgroup; p-value = 0.054. (B) Comparison of cumulative survival rates among patients with IMPROVE prediction scores of VTE ≥ 2; p-value = 0.035. (C) Comparison of cumulative survival rates among patients with IMPROVEDD prediction scores of VTE ≥ 2; p-value = 0.123. (D) Comparison of cumulative survival rates among patients with IMPROVE prediction scores of bleeding ≥ 7; p-value = 0.002. (E) Comparison of cumulative survival rates among patients with PPSVTE (≥4) + IMPROVEBRS (≥7) (high risk) prediction score subgroup; p-value = 0.022. (F) Comparison of cumulative survival rates among patients with IMPROVEVTE (≥2) + IMPROVEBRS (≥7) (high risk) prediction score subgroup; p-value < 0.003. (G) Comparison of cumulative survival rates among patients with IMPROVEDDVTE (≥2) + IMPROVEBRS (≥7) (high risk) prediction score subgroup; p-value < 0.003.
Figure 3
Figure 3
Kaplan–Meier curve for cumulative survival rates between patients with and without low molecular weight heparin, according to each low venous thromboembolism and bleeding risk score. (A) Comparison of cumulative survival rates among patients with Padual prediction scores of VTE ≥ 4 subgroup; p-value = 0.054. (B) Comparison of cumulative survival rates among patients with IMPROVE prediction scores of VTE ≥ 2; p-value = 0.035. (C) Comparison of cumulative survival rates among patients with IMPROVEDD prediction scores of VTE ≥ 2; p-value = 0.123. (D) Comparison of cumulative survival rates among patients with IMPROVE prediction scores of bleeding ≥ 7; p-value = 0.002. (E) Comparison of cumulative survival rates among patients with PPSVTE (≥4) + IMPROVEBRS (≥7) (high risk) prediction score subgroup; p-value = 0.022. (F) Comparison of cumulative survival rates among patients with IMPROVEVTE (≥2) + IMPROVEBRS (≥7) (high risk) prediction score subgroup; p-value < 0.003. (G) Comparison of cumulative survival rates among patients with IMPROVEDDVTE (≥2) + IMPROVEBRS (≥7) (high risk) prediction score subgroup; p-value < 0.003.

References

    1. Hadid T., Kafri Z., Al-Katib A. Coagulation and anticoagulation in COVID-19. Blood Rev. 2021;47:100761. doi: 10.1016/j.blre.2020.100761. - DOI - PMC - PubMed
    1. Dorgalaleh A. Seminars in Thrombosis and Hemostasis. Volume 46. Thieme Medical Publishers; New York, NY, USA: 2020. Bleeding and Bleeding Risk in COVID-19; pp. 815–818. - DOI - PMC - PubMed
    1. Kaptein F.H.J., Stals M.A.M., Huisman M.V., Klok F.A. Prophylaxis and treatment of COVID-19 related venous thromboembolism. Postgrad. Med. 2021;133:27–35. doi: 10.1080/00325481.2021.1891788. - DOI - PMC - PubMed
    1. Demelo-Rodriguez P., Farfan-Sedano A.I., Pedrajas J.M., Llamas P., Siguenza P., Jaras M.J., Quintana-Diaz M., Fernandez-Capitan C., Bikdeli B., Jimenez D., et al. Bleeding risk in hospitalized patients with COVID-19 receiving intermediate- or therapeutic doses of thromboprophylaxis. J. Thromb. Haemost. 2021;19:1981–1989. doi: 10.1111/jth.15400. - DOI - PMC - PubMed
    1. Chen S., Zheng T., Wang S., Yu Y., Wang P., Song Y., Jiang J. Association between risk of venous thromboembolism and mortality in patients with COVID-19. Int. J. Infect. Dis. 2021;108:543–549. doi: 10.1016/j.ijid.2021.06.005. - DOI - PMC - PubMed

LinkOut - more resources