. 2024 May 15;30(10):2193-2205.
doi: 10.1158/1078-0432.CCR-24-0027.

Targeting SMAD3 Improves Response to Oxaliplatin in Esophageal Adenocarcinoma Models by Impeding DNA Repair

Affiliations

Targeting SMAD3 Improves Response to Oxaliplatin in Esophageal Adenocarcinoma Models by Impeding DNA Repair

Farah Ballout et al. Clin Cancer Res. .

Abstract

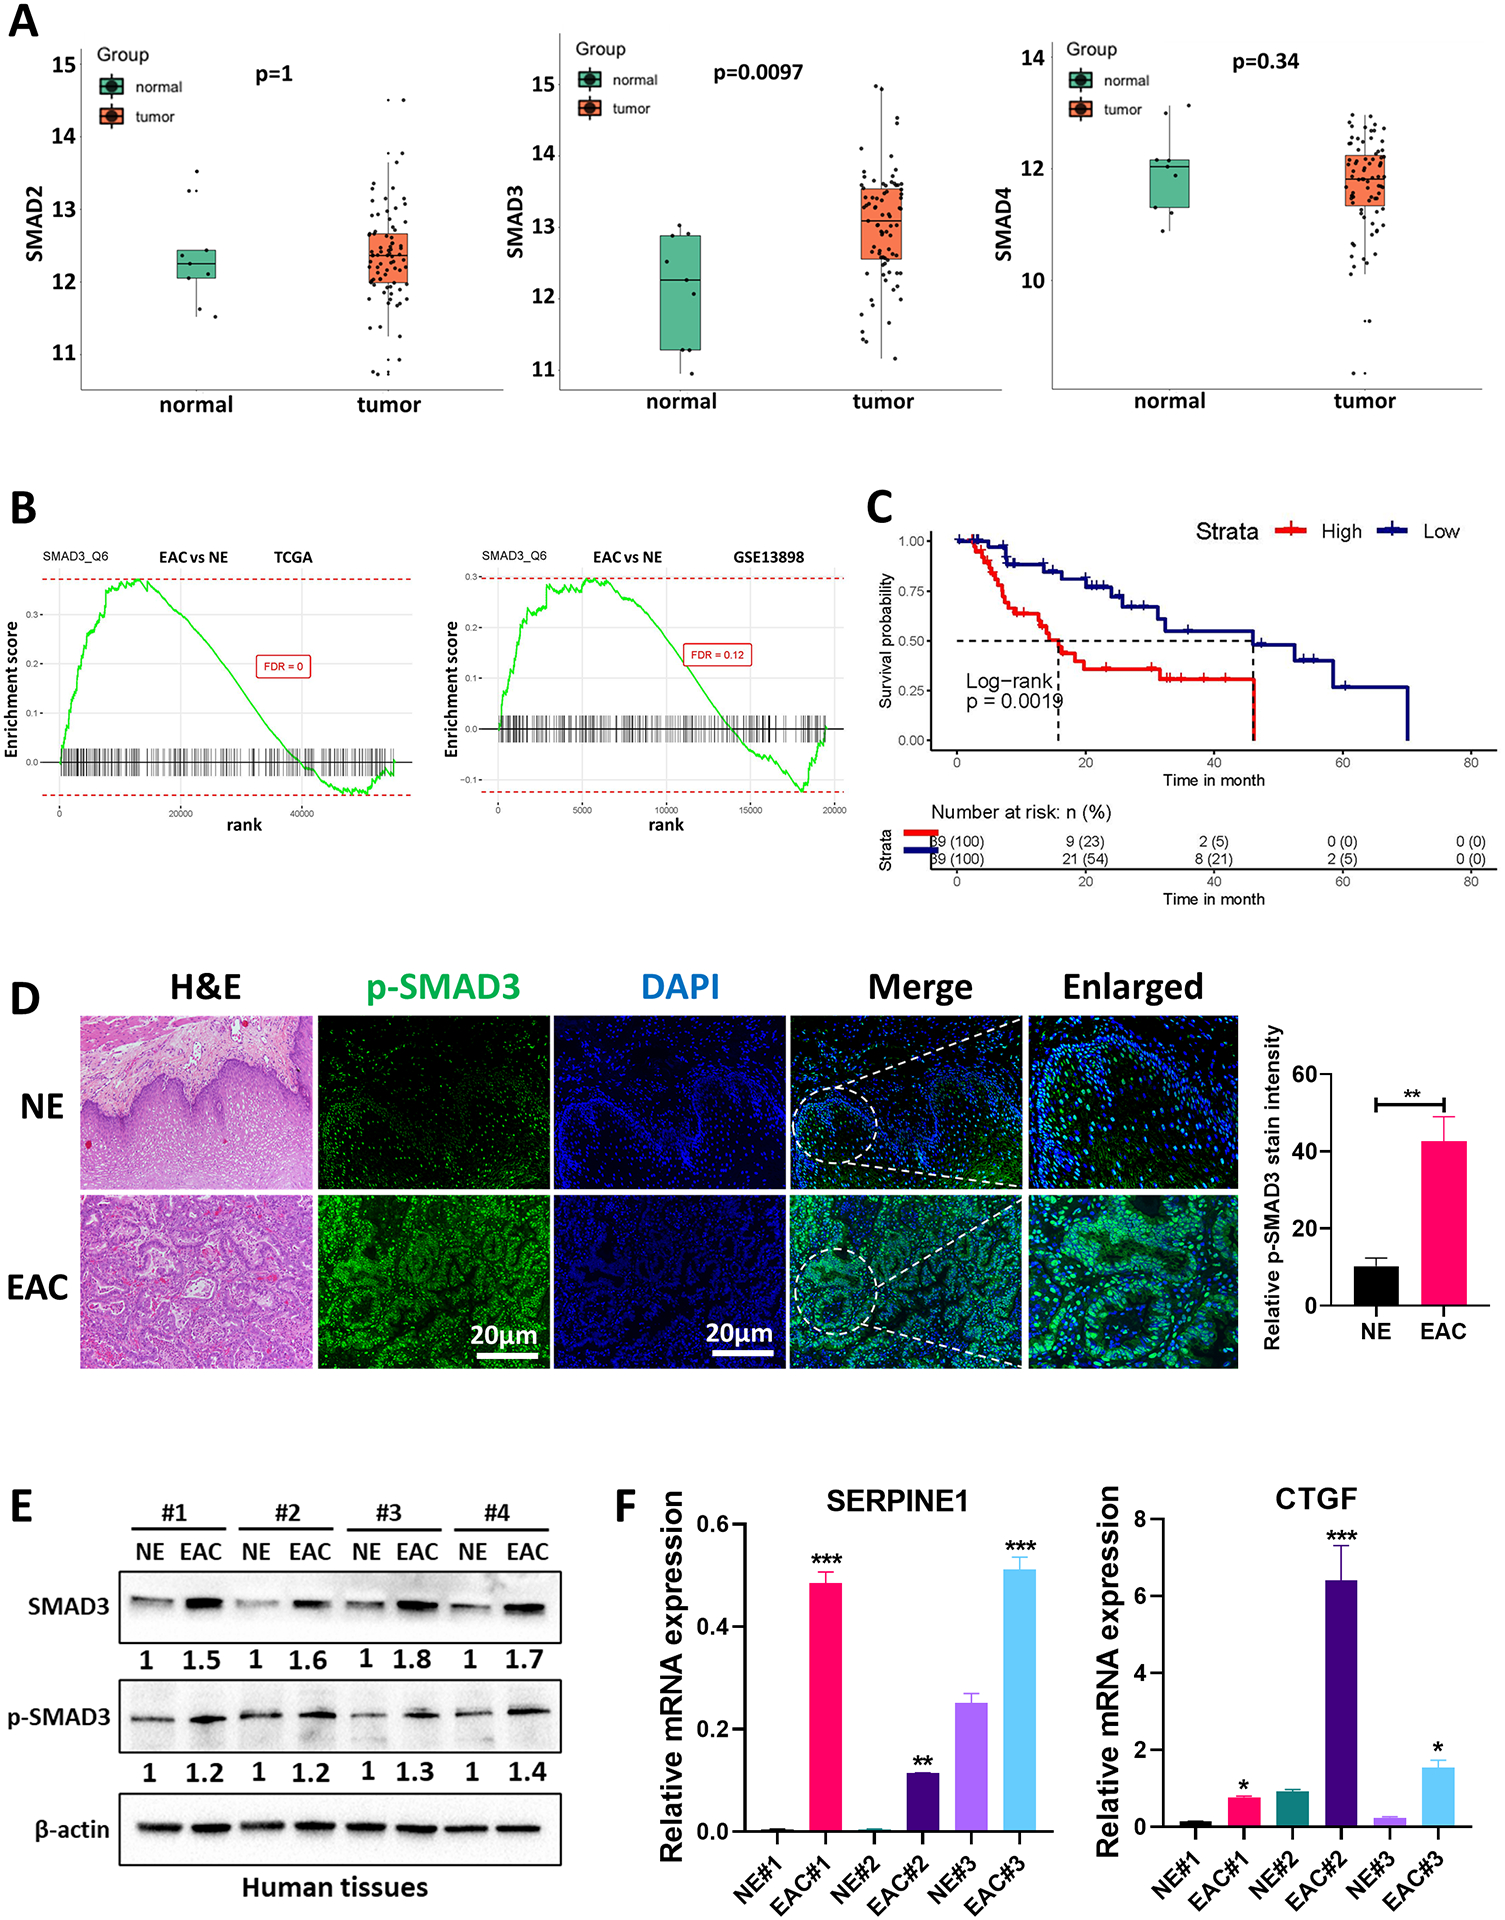
Purpose: TGFβ signaling is implicated in the progression of most cancers, including esophageal adenocarcinoma (EAC). Emerging evidence indicates that TGFβ signaling is a key factor in the development of resistance toward cancer therapy.

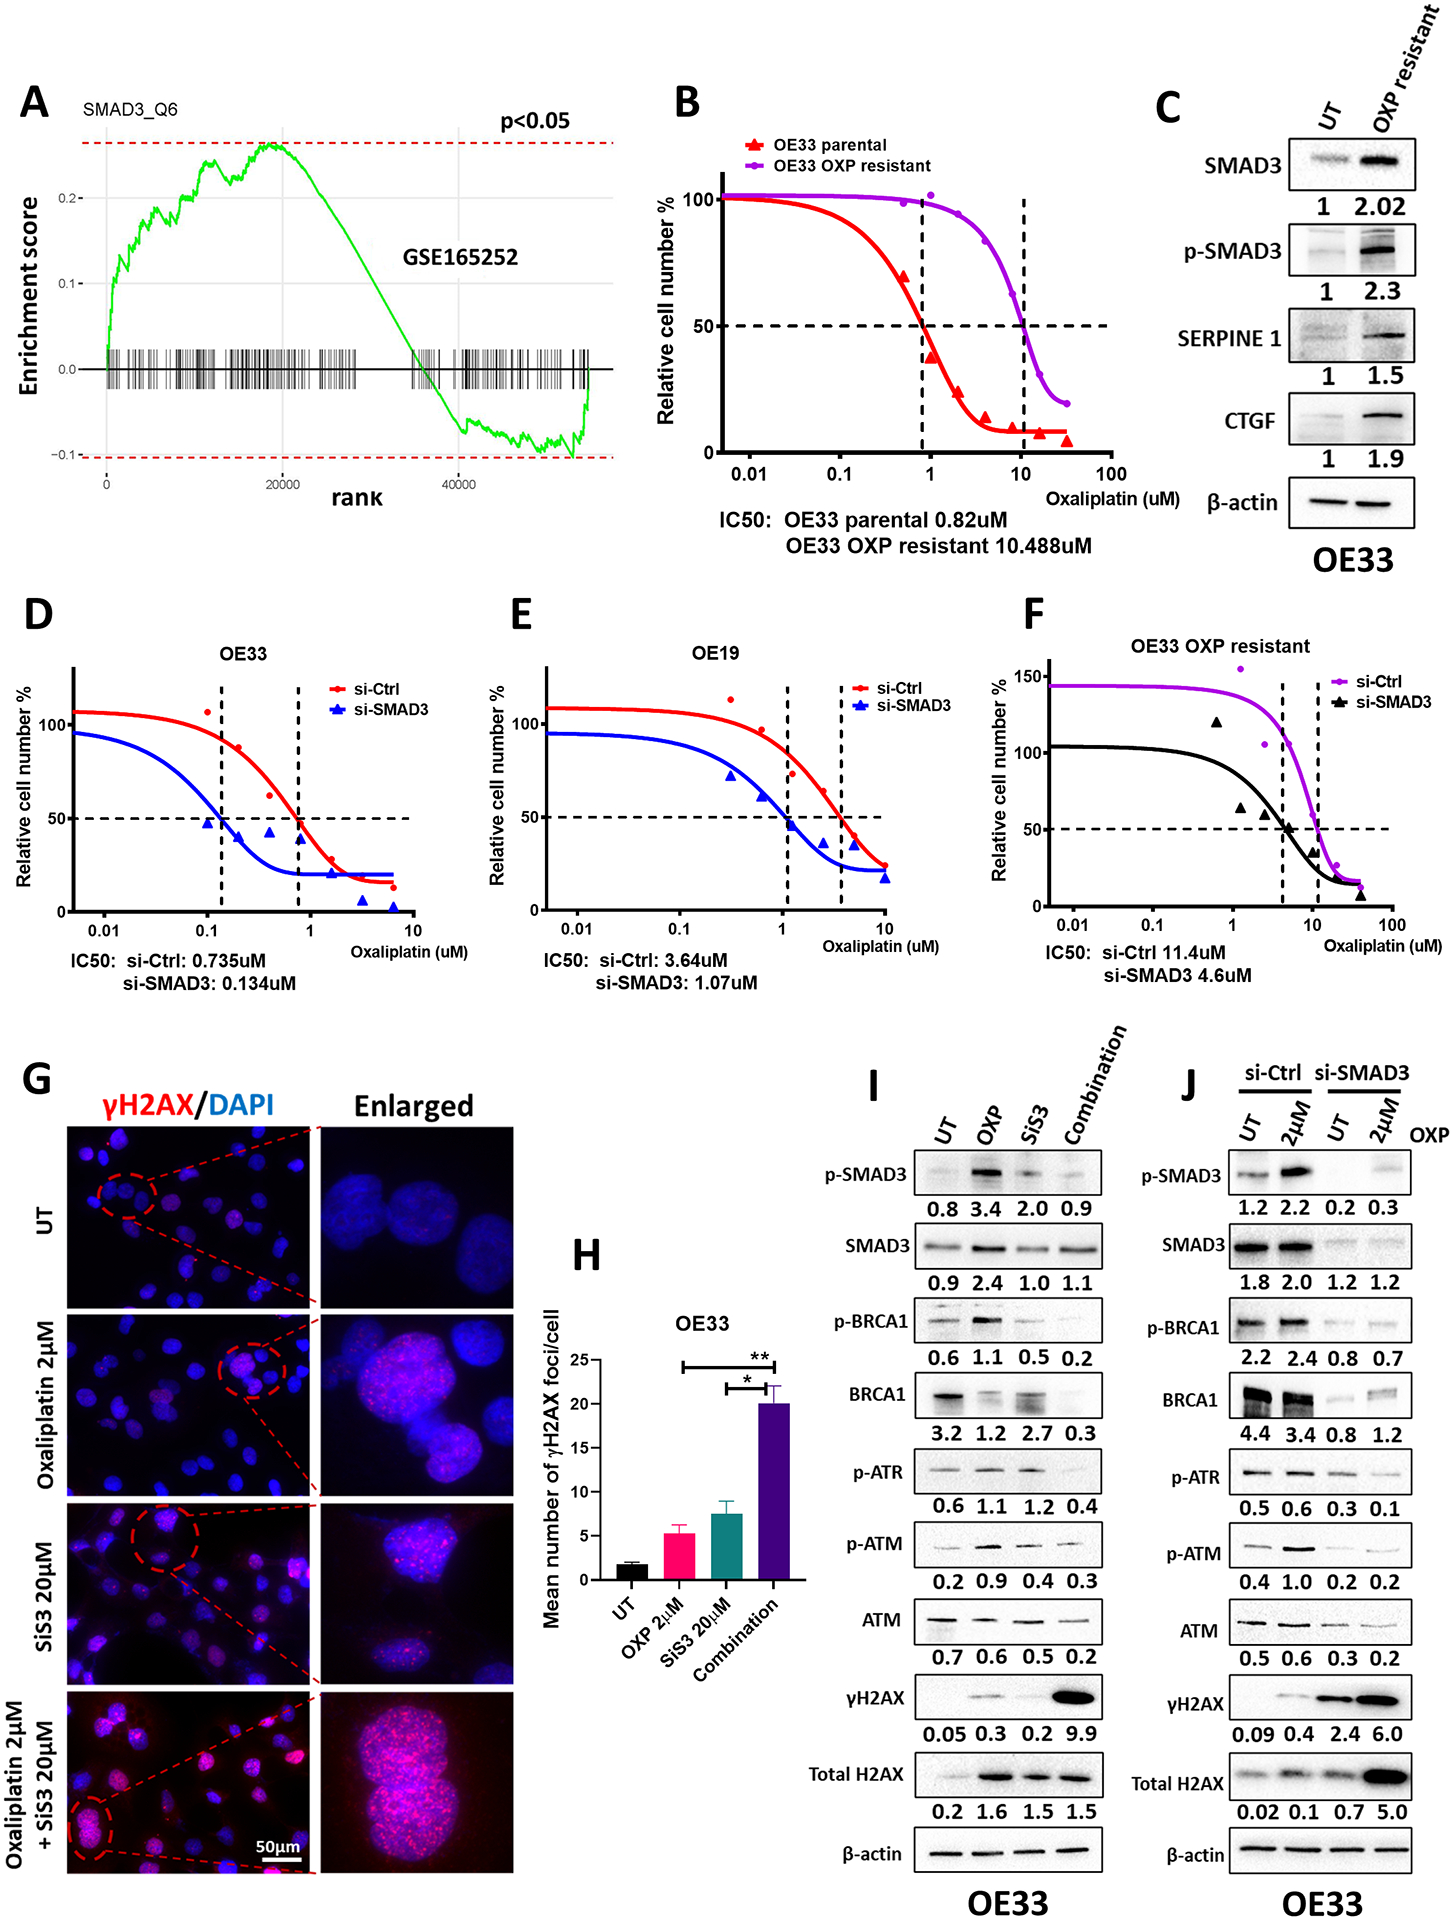
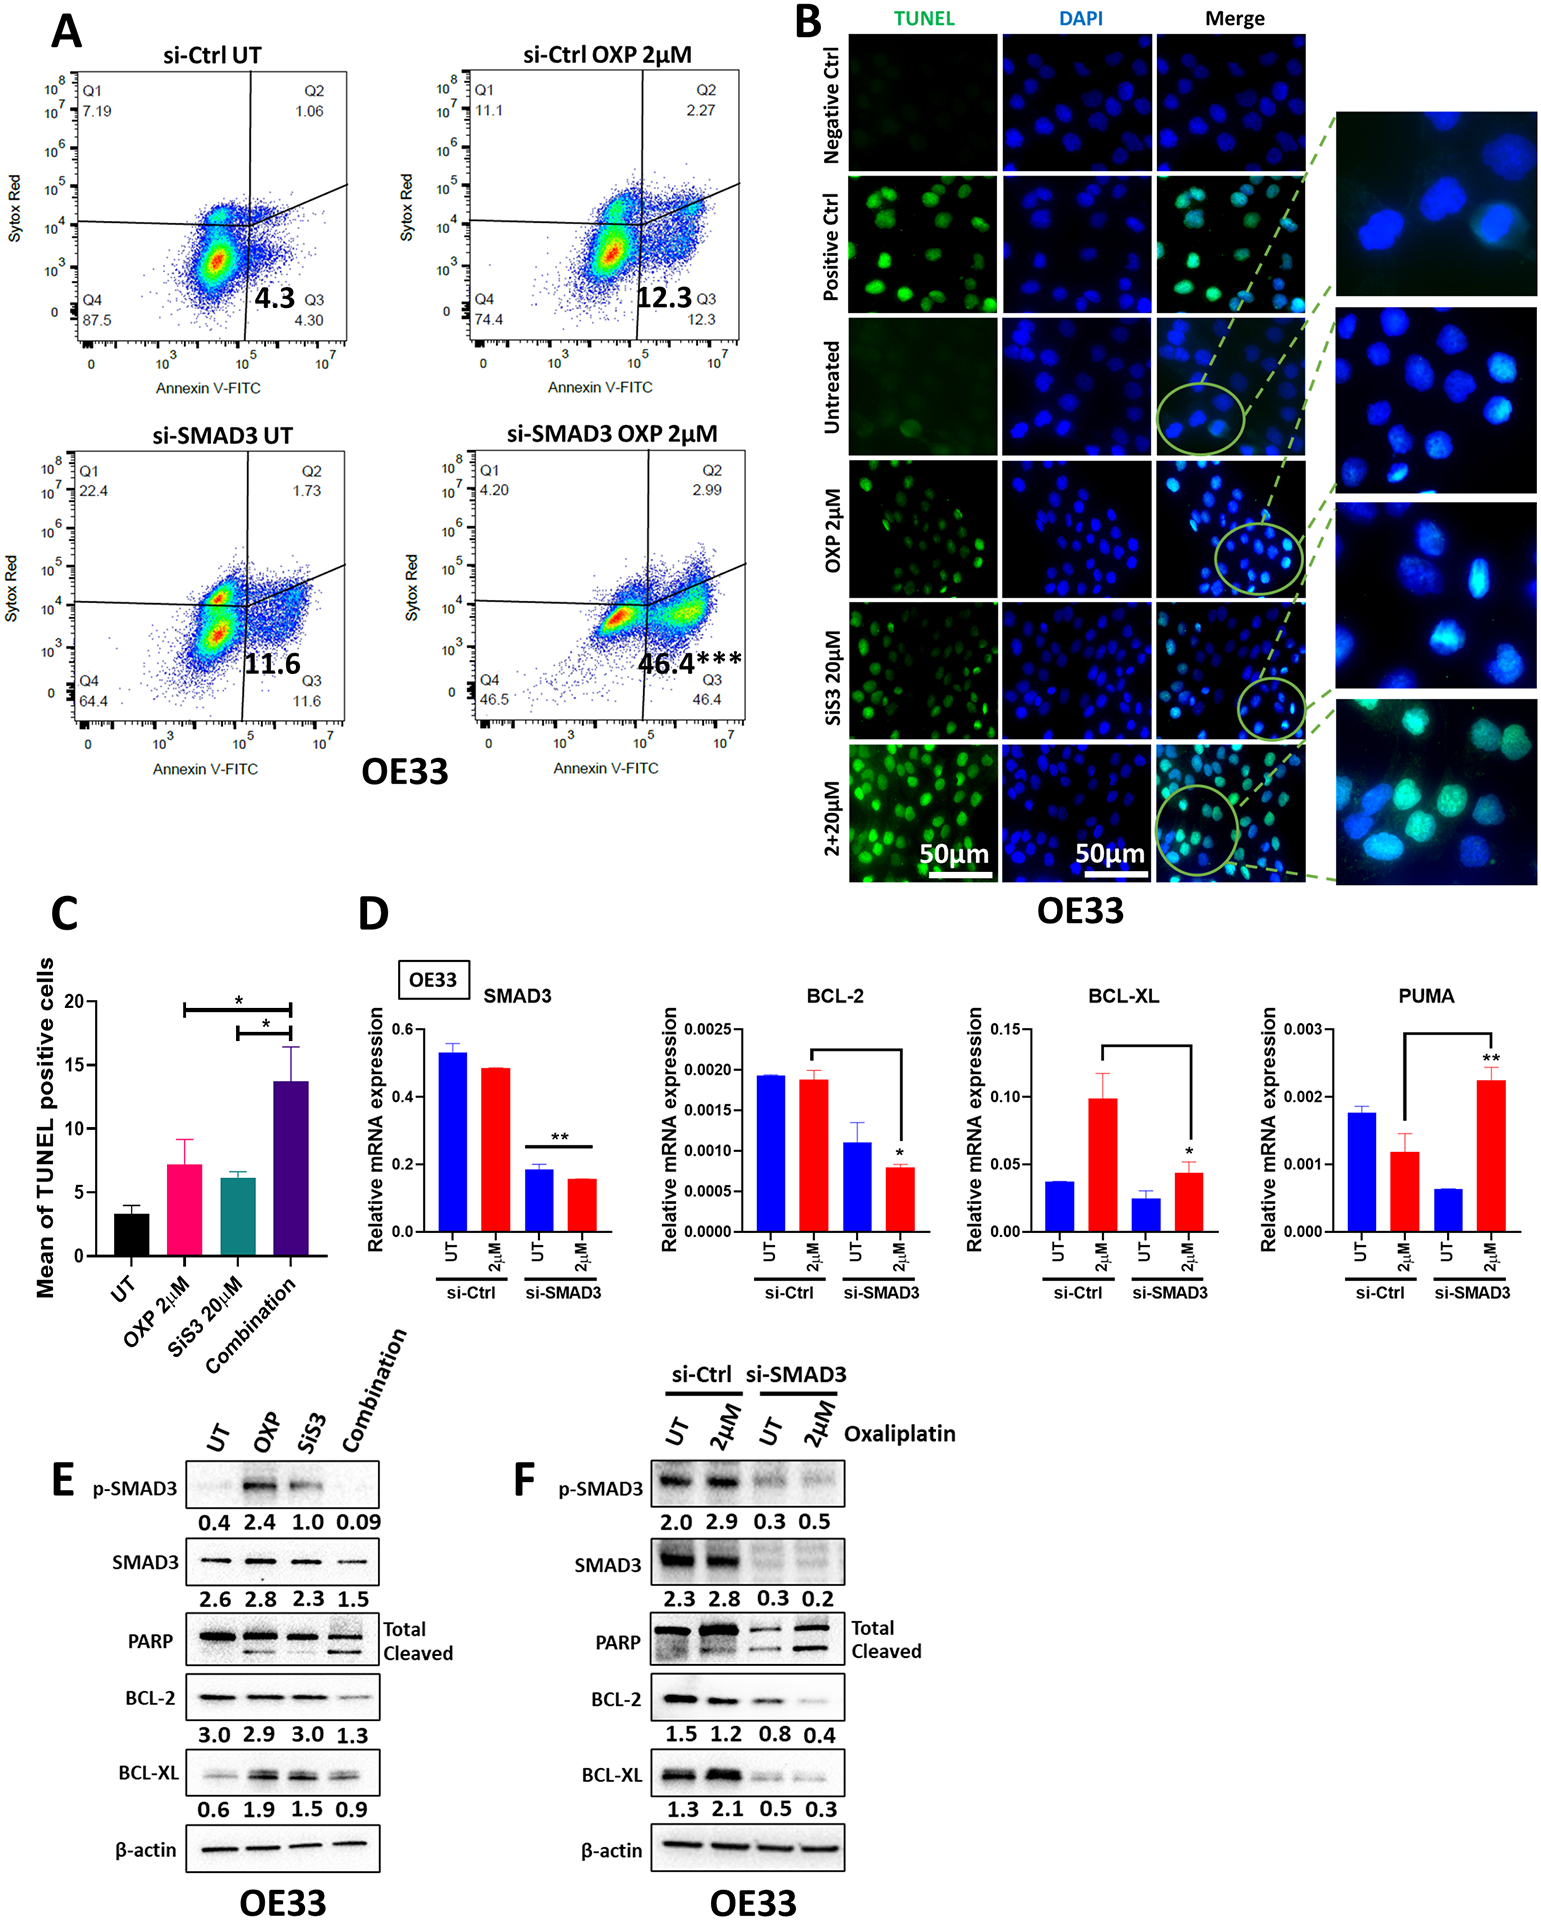
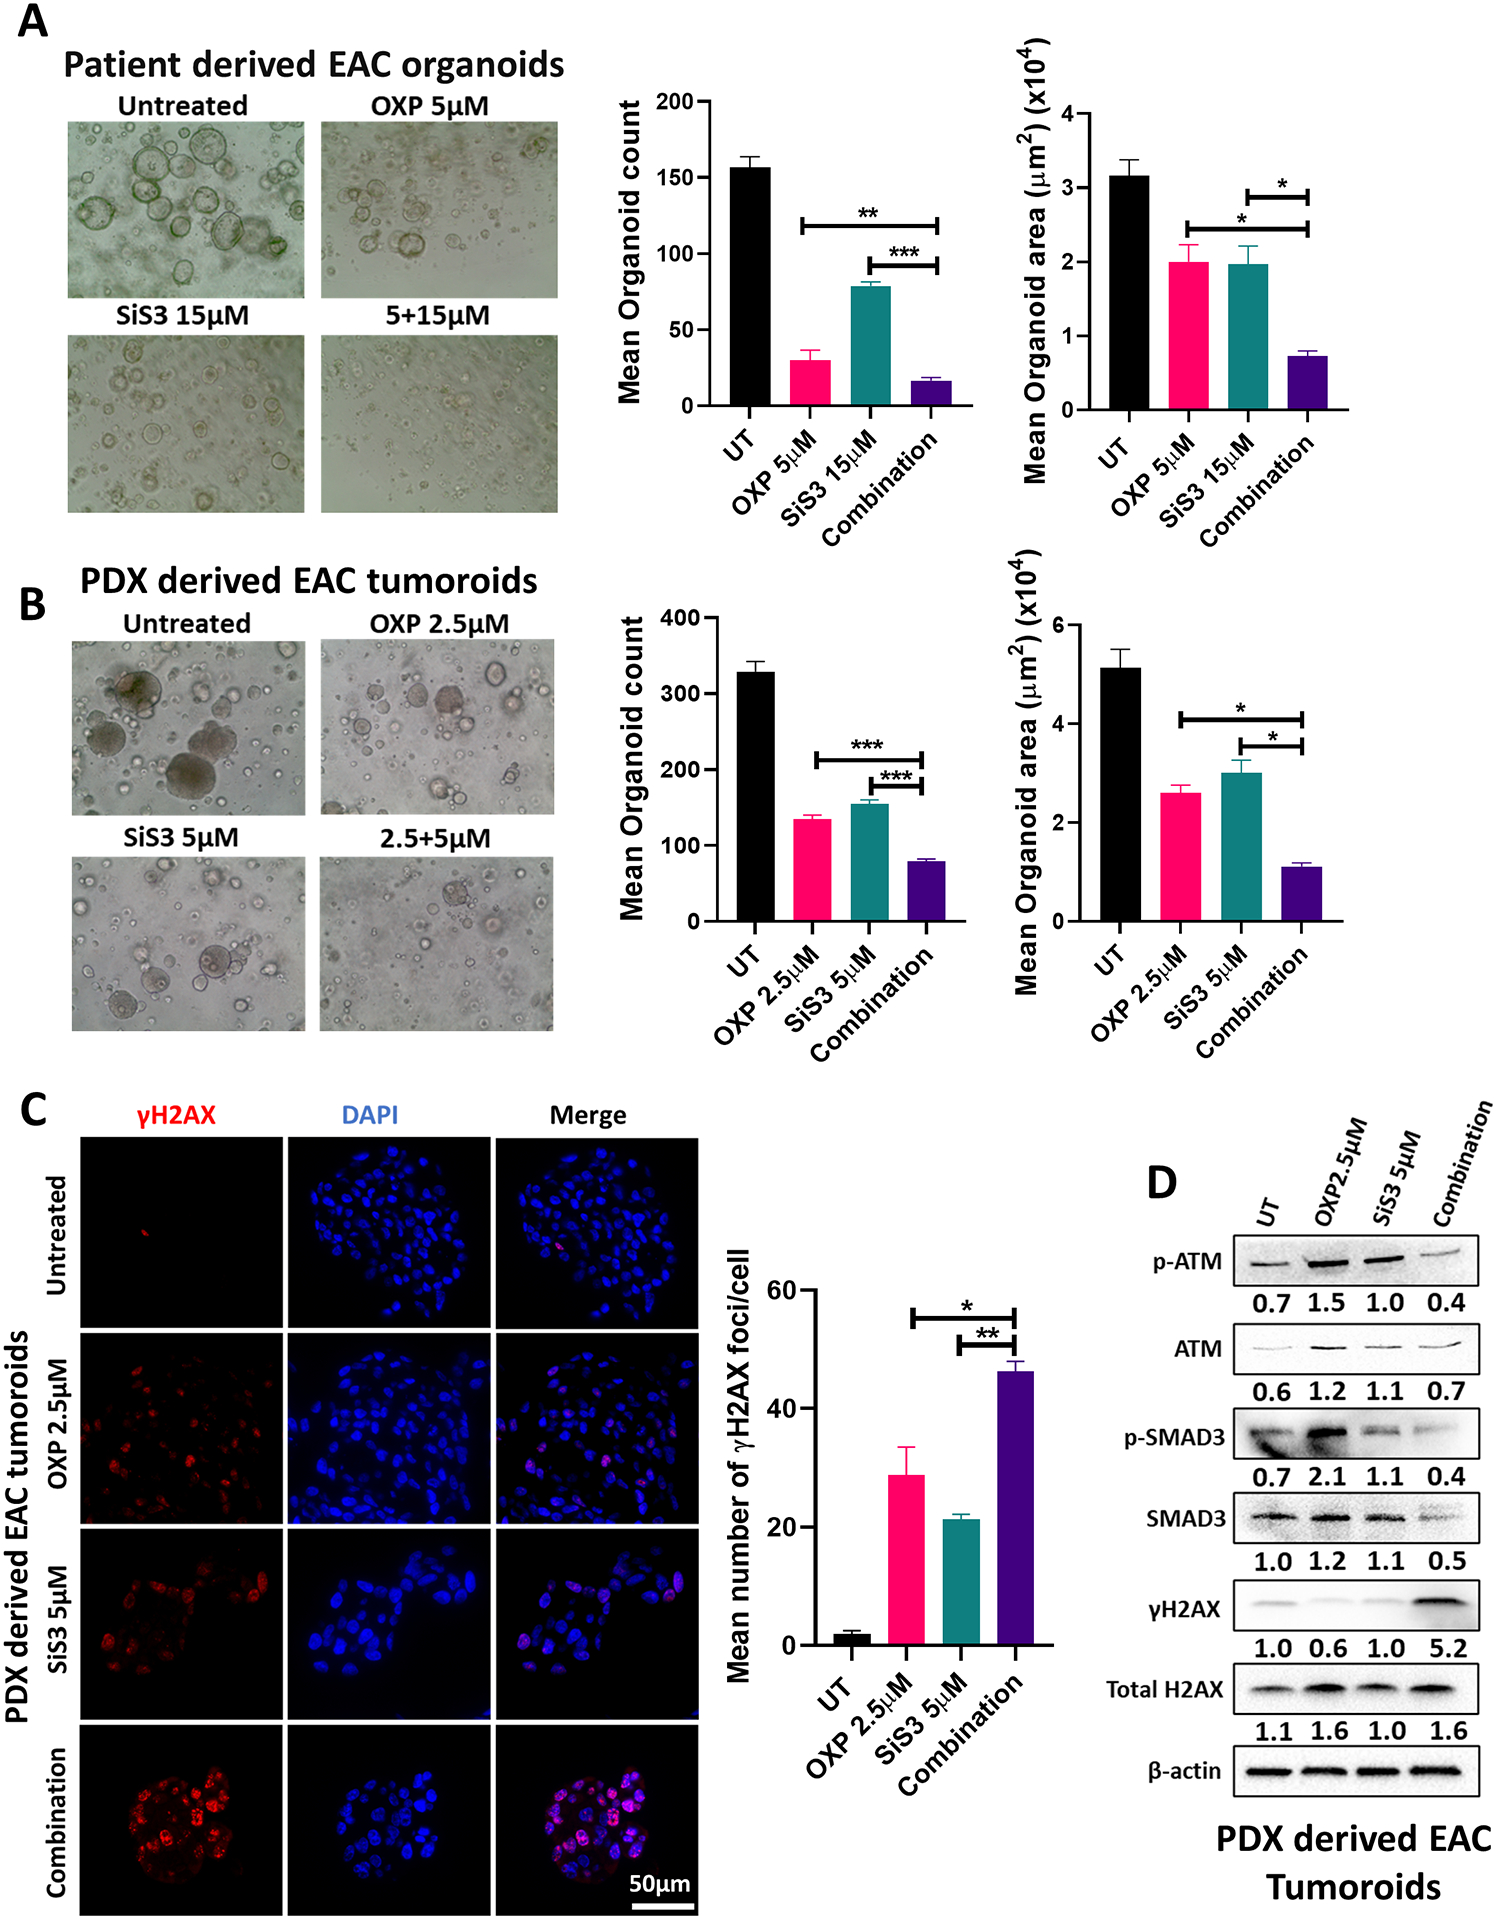
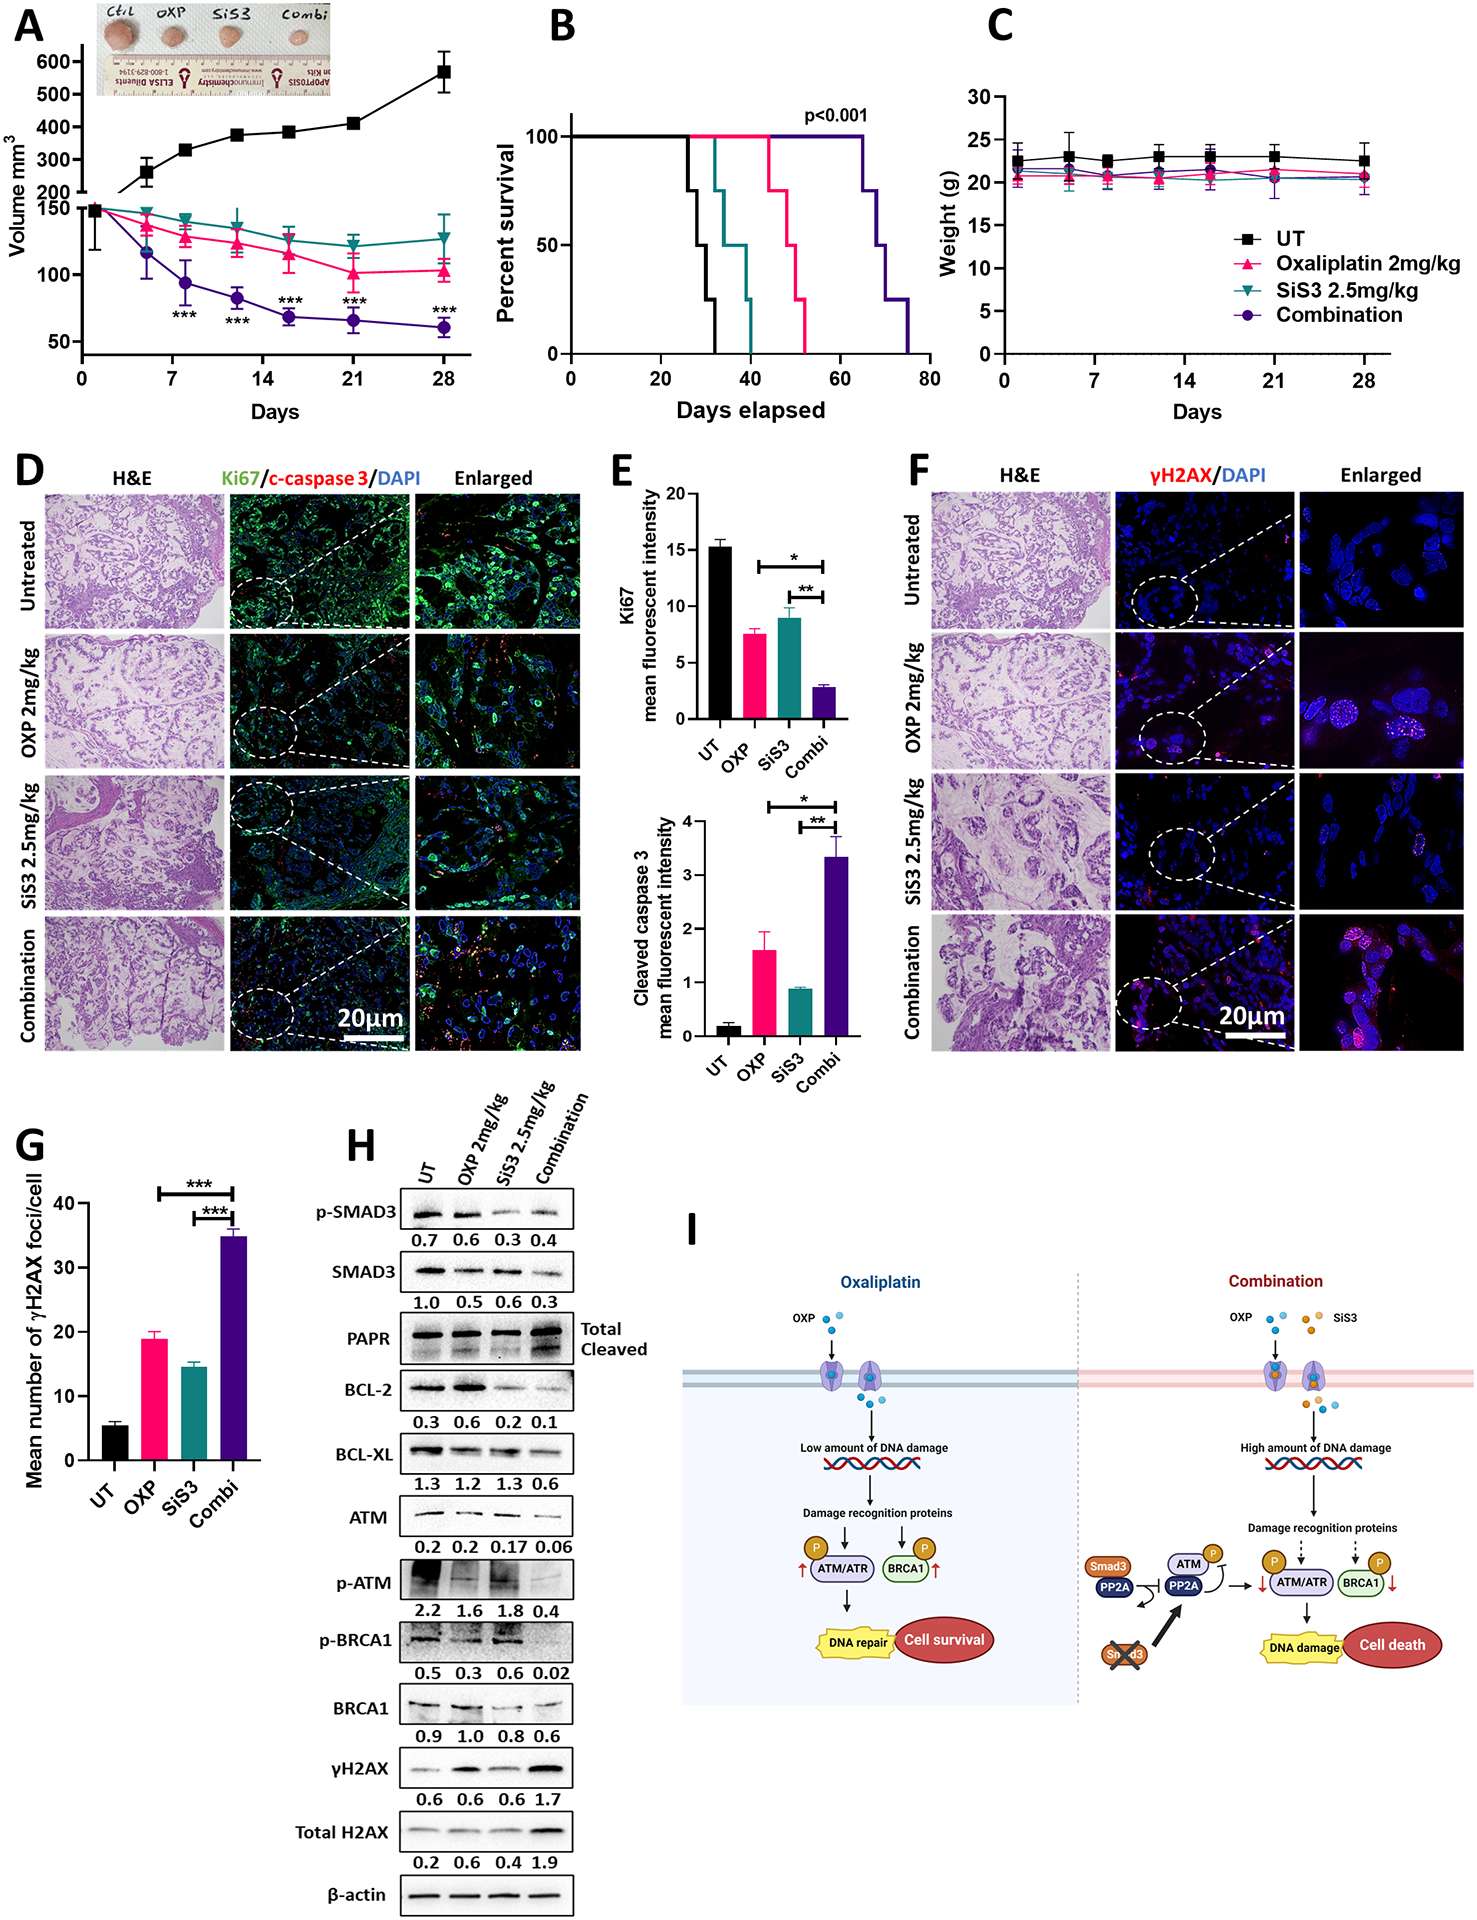
Experimental design: In this study, we developed patient-derived organoids and patient-derived xenograft models of EAC and performed bioinformatics analysis combined with functional genetics to investigate the role of SMAD family member 3 (SMAD3) in EAC resistance to oxaliplatin.

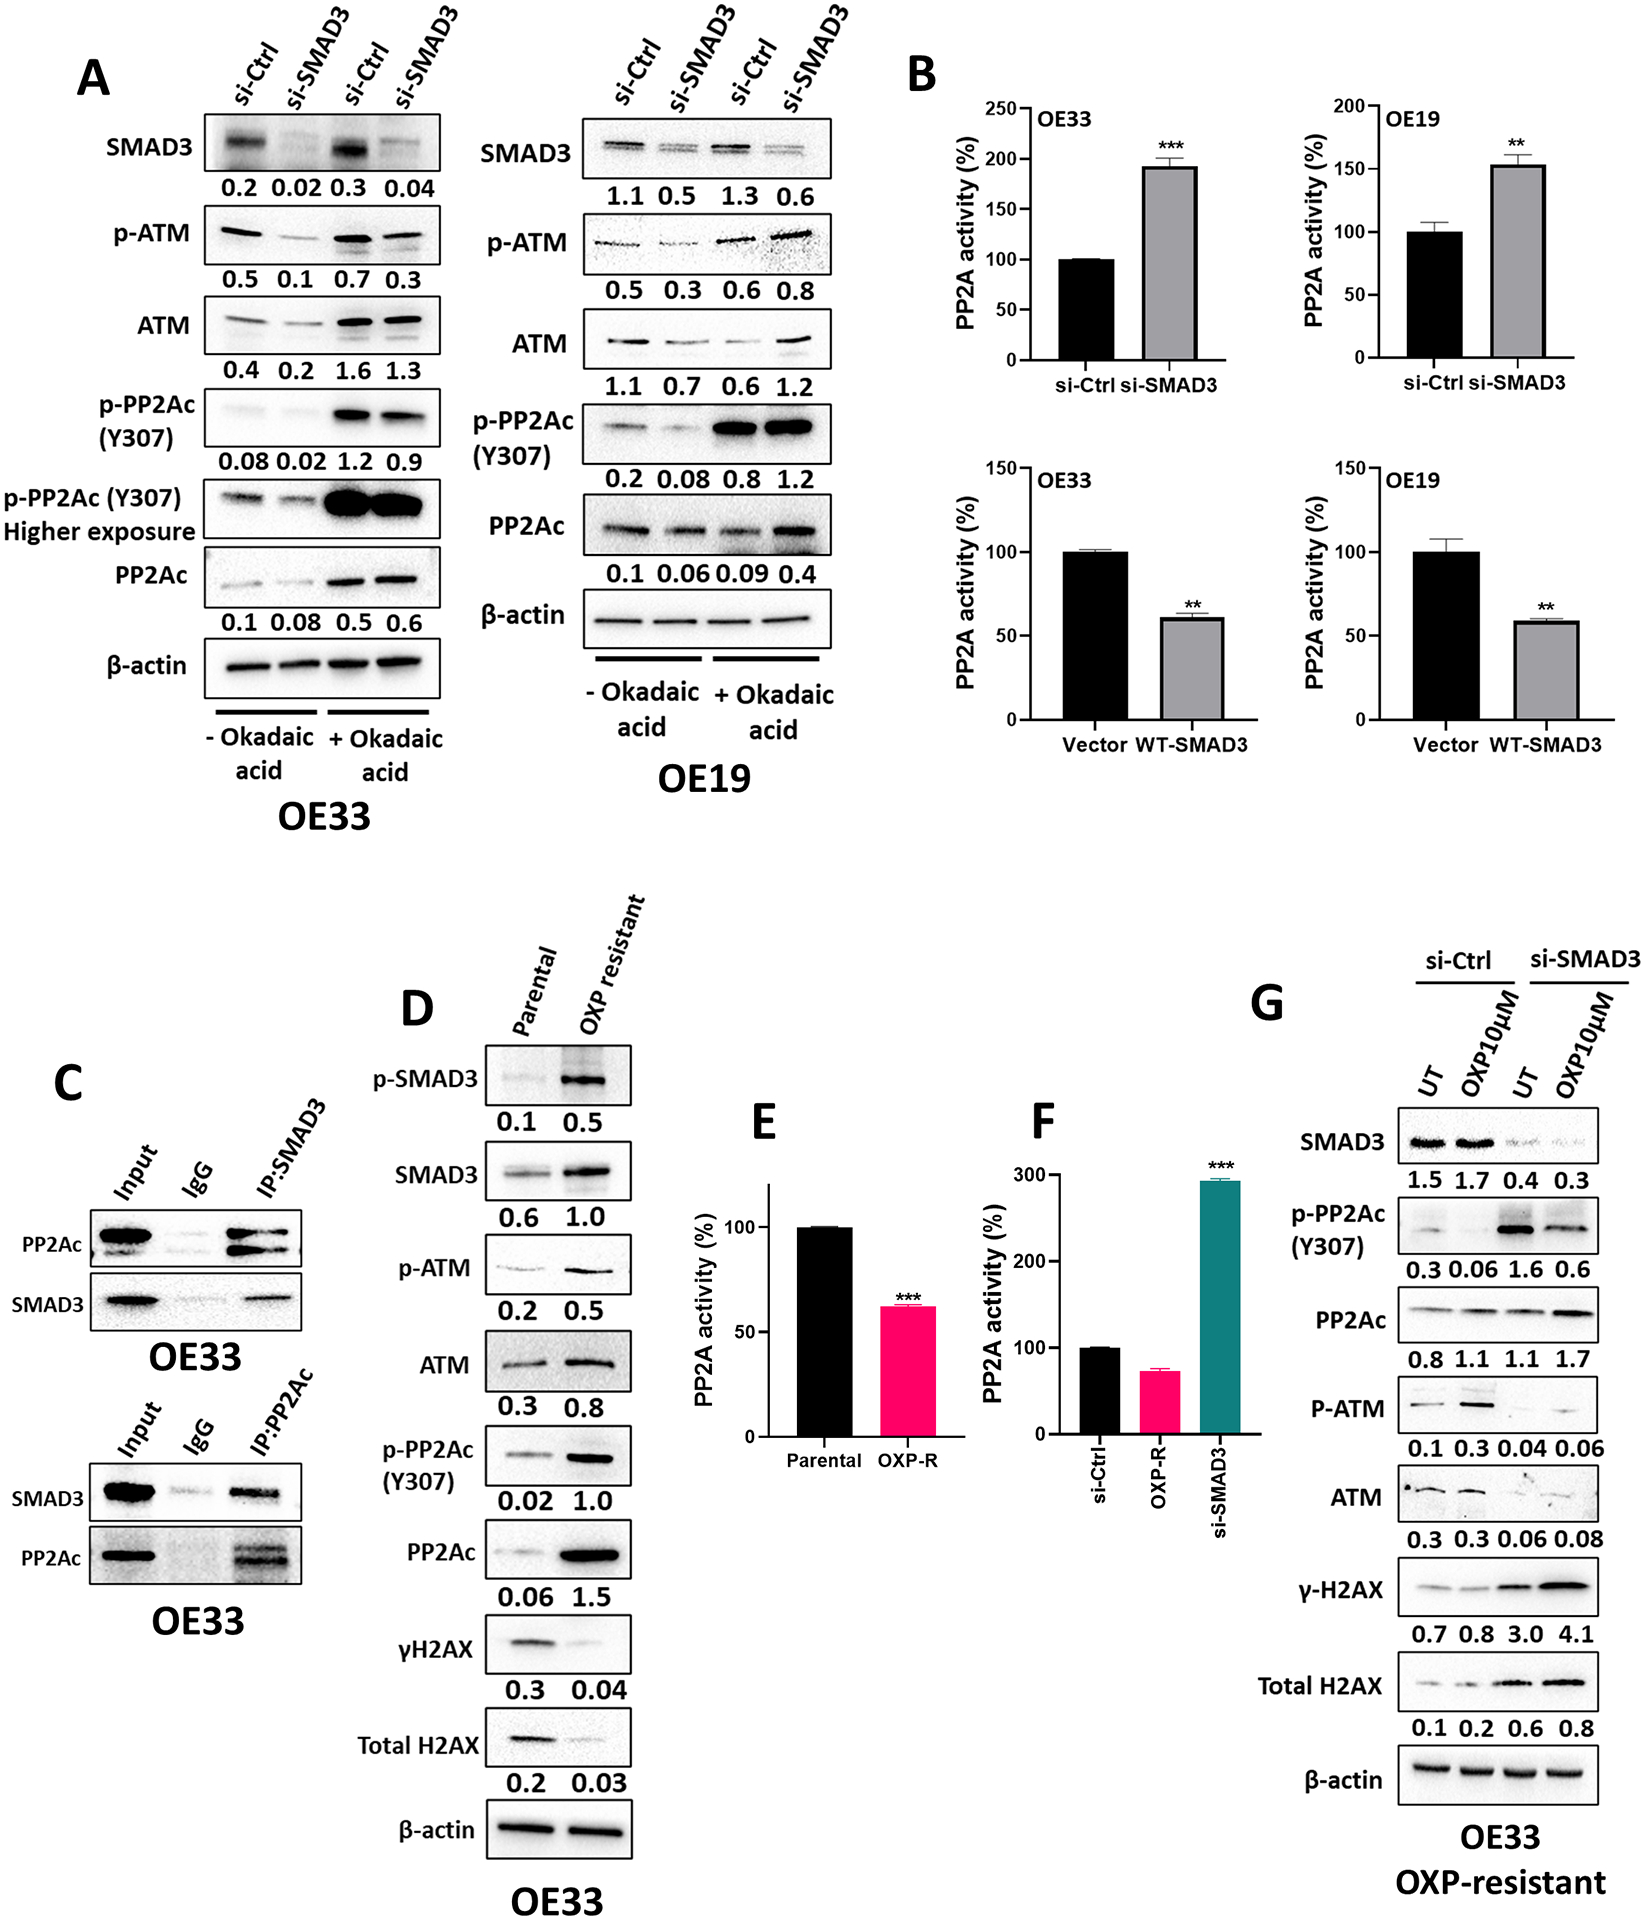
Results: Chemotherapy nonresponding patients showed enrichment of SMAD3 gene expression when compared with responders. In a randomized patient-derived xenograft experiment, SMAD3 inhibition in combination with oxaliplatin effectively diminished tumor burden by impeding DNA repair. SMAD3 interacted directly with protein phosphatase 2A (PP2A), a key regulator of the DNA damage repair protein ataxia telangiectasia mutated (ATM). SMAD3 inhibition diminished ATM phosphorylation by enhancing the binding of PP2A to ATM, causing excessive levels of DNA damage.

Conclusions: Our results identify SMAD3 as a promising therapeutic target for future combination strategies for the treatment of patients with EAC.


Conflict of interest statement

The authors declare no potential conflicts of interest.

Figures

Fig. 1.
Fig. 1.. SMAD3 is upregulated in EAC and associated with poor survival.
(A) Boxplot showing the gene expression of SMAD2, SMAD3 and SMAD4 between esophageal adenocarcinoma (EAC) (n=79) and normal esophagus (NE) (n=9) in the TCGA dataset. The expression levels are presented as Log2 of the read counts in the TCGA dataset. (B) GSEA of SMAD3 comparing EAC with NE in the TCGA dataset and GEO GSE13898 dataset. (C) Kaplan‒Meier plot analyzing the association between SMAD3 gene expression levels and EAC patients’ overall survival in the TCGA database. (D) Immunofluorescence staining and quantification of phosphorylated SMAD3 (p-SMAD3) (green) in a representative NE and EAC human tissue. DAPI was used for nuclear staining. (E) Western blot analysis of total and phosphorylated SMAD3 protein expression in NE and EAC human tissues. β-actin was used for normalization and a representative β-actin was shown. Quantitative analysis of protein expression is included under the corresponding blot. (F) Quantitative RT‒PCR of representative SMAD target gene (SERPINE1 and CTGF) expression in primary tissue samples from NE and EAC. The gene expression levels are presented as relative gene expression levels normalized to the HPRT of the same samples. All quantification data represent n = 3 biologically independent samples; data are presented as mean ± SEM; *P<0.05; **P<0.01; ***P<0.001.
Fig. 2.
Fig. 2.. SMAD3 is associated with a poor response to chemotherapy and mediates resistance to oxaliplatin by regulating DNA damage/repair in EAC.
(A) GSEA of SMAD3 comparing therapy responders with non-responders in the GEO GSE165252 dataset. (B) CellTiter Glo cell viability assay showing the IC50 of oxaliplatin treatment in OE33 parental cells (0.82 μM) and OE33 oxaliplatin-resistant cells (10.48 μM). (C) Western blot analysis of total SMAD3, phosphorylated SMAD3, and representative SMAD target (SERPINE1 and CTGF) protein expression in OE33 parental cells and OE33 oxaliplatin-resistant cells. β-actin was used for normalization and a representative β-actin was shown. Quantitative analysis of protein expression is included under the corresponding blot. (D–F) CellTiter Glo cell viability assay showing the IC50 of oxaliplatin treatment in OE33 (D), OE19 (E), and OE33 oxaliplatin-resistant cells (F) with and without SMAD3 knockdown. The black dotted lines in (B) and (D–F) indicate the cross-points between the 50% survival line and the dose‒response curve. (G) Immunofluorescence staining of phosphorylated H2AX (γH2AX) (red) in OE33 cells treated with oxaliplatin, SiS3 or their combination. DAPI was used for nuclear staining. (H) Quantification of γH2AX immunofluorescence results from (G) (n = 3 biologically independent samples; data are presented as mean ± SD; *P<0.05; **P<0.01; ***P<0.001). (I–J) Western blot analysis of total and phosphorylated SMAD3, total and phosphorylated BRCA1, p-ATR, total and phosphorylated ATM, and total and phosphorylated H2AX protein expression in OE33 cells treated with oxaliplatin (2 μM), SiS3 (20 μM) or a combination (2 μM oxaliplatin and 20 μM SiS3) (I) and OE33 cells with or without SMAD3 knockdown and oxaliplatin treatment (J). β-actin was used for normalization and a representative β-actin was shown. Quantitative analysis of protein expression is included under the corresponding blot (n = 3 biologically independent samples). Similar results were obtained with OE19 cells (Supplementary Figure 2).
Fig. 3.
Fig. 3.. SMAD3 inhibition sensitizes oxaliplatin-treated EAC cells to apoptosis.
(A) Annexin V and Sytox Red flow cytometric analysis of OE33 cells transfected with si-Ctrl or si-SMAD3 with or without oxaliplatin treatment. (B) Representative TUNEL staining images of OE33 cells untreated or treated with oxaliplatin, SiS3 or the combination. (C) TUNEL-positive cells were counted and are represented as the mean ± SEM (n = 3 biologically independent samples; *P<0.05; **P<0.01; ***P<0.001). (D) Quantitative RT‒PCR of SMAD3, BCL-2, BCL-XL, and PUMA in OE33 cells transfected with si-Ctrl or si-SMAD3 with or without oxaliplatin treatment. The gene expression levels are presented as relative gene expression normalized to the HPRT of the same samples (n = 3 biologically independent samples; data are presented as mean ± SEM; *P<0.05; **P<0.01; ***P<0.001). (E–F) Western blot analysis of total and phosphorylated SMAD3, PARP, BCL-2, and BCL-XL protein expression in OE33 cells treated with oxaliplatin (2 μM), SiS3 (20 μM) or a combination (2 μM oxaliplatin and 20 μM SiS3) (E) and OE33 cells with or without SMAD3 knockdown and oxaliplatin treatment (F). β-actin was used for normalization and a representative β-actin is shown. Quantitative analysis of protein expression is included under the corresponding blot (n = 3 biologically independent samples). Similar results were obtained with OE19 cells (Supplementary Figure 3 and 4).
Fig. 4.
Fig. 4.. SMAD3 regulates ATM-mediated DNA repair by interacting with PP2A.
(A) Western blot analysis of SMAD3, total and phosphorylated ATM and total and phosphorylated PP2Ac protein expression in OE33 and OE19 cells transfected with si-Ctrl or si-SMAD3 with or without okadaic acid treatment. β-actin was used for normalization and a representative β-actin is shown. Quantitative analysis of protein expression is included under the corresponding blot (n = 3 biologically independent samples). (B) PP2A activity assay in OE33 and OE19 cells transfected with si-Ctrl or si-SMAD3 and vector or wild-type (WT) SMAD3 plasmid (n = 3 biologically independent samples; data are presented as % change relative corresponding control group ± SD; *P<0.05; **P<0.01; ***P<0.001). (C) Western blot analysis of SMAD3- or PP2A-immunoprecipitated proteins in OE33 cells showing the interaction between SMAD3 and PP2Ac. (D) Western blot analysis of total and phosphorylated SMAD3, total and phosphorylated ATM, total and phosphorylated H2AX, and total and phosphorylated PP2Ac protein expression in OE33 parental and oxaliplatin-resistant cells. β-actin was used for normalization and a representative β-actin was shown. Quantitative analysis of protein expression is included under the corresponding blot (n = 3 biologically independent samples). (E–F) PP2A activity assay in OE33 parental and oxaliplatin-resistant cells (E) and in OE33 oxaliplatin-resistant cells with and without SMAD3 knockdown (F) (n = 3 biologically independent samples; data are presented as % change relative corresponding control group ± SD; *P<0.05; **P<0.01; ***P<0.001). (G) Western blot analysis of SMAD3, total and phosphorylated ATM, total and phosphorylated H2AX, and total and phosphorylated PP2Ac protein expression in OE33 oxaliplatin-resistant cells with and without SMAD3 knockdown. β-actin was used for normalization and a representative β-actin was shown. Quantitative analysis of protein expression is included under the corresponding blot (n = 3 biologically independent samples).
Fig. 5.
Fig. 5.. SMAD3 inhibition and oxaliplatin treatment reduce the count and size of patient-derived organoids/tumoroids.
(A–B) Representative images, counts and sizes of EAC patient-derived organoids (A)/tumoroids (B) treated with oxaliplatin, SiS3 or their combination (data are presented as mean ± SD; *P<0.05; **P<0.01; ***P<0.001). (C) Immunofluorescence staining and quantification of phosphorylated H2AX (γH2AX) (red) in EAC patient-derived tumoroids treated with oxaliplatin, SiS3 or their combination (data are presented as mean ± SD; *P<0.05; **P<0.01; ***P<0.001). DAPI was used for nuclear staining. (D) Western blot analysis of total and phosphorylated SMAD3, total and phosphorylated ATM, and total and phosphorylated H2AX protein expression in EAC patient-derived tumoroids treated with oxaliplatin, SiS3 or their combination. β-actin was used for normalization and a representative β-actin was shown. Quantitative analysis of protein expression is included under the corresponding blot (n = 3 biologically independent samples).
Fig. 6.
Fig. 6.. SMAD3 inhibition enhances the response to oxaliplatin in a PDX model.
(A) Average tumor volume of PDX with or without oxaliplatin 2 mg/kg, SiS3 2.5 mg/kg or combination treatment for 28 days (n = 6 mice/group; data are presented as mean ± SD; *P<0.05; **P<0.01; ***P<0.001). Representative image of tumors is shown above the graph. (B) Kaplan–Meier survival curve for PDXs following the treatment endpoint. (C) Average weight of untreated and treated (oxaliplatin, SiS3 or combination) PDXs over 28 days of treatment (n = 6 mice/group; data are presented as mean ± SD; *P<0.05; **P<0.01; ***P<0.001). (D) Representative dual immunofluorescence staining images of the cell proliferation marker (Ki67, green) and apoptosis marker (cleaved caspase 3, red) in the PDX tumor tissues. DAPI was used for nuclear staining. (E) Quantification of the data from (D) (data are presented as mean ± SD; *P<0.05; **P<0.01; ***P<0.001). (F) Representative immunofluorescence staining images of phosphorylated H2AX (γH2AX) staining (red) in the PDX tumor tissues. DAPI was used for nuclear staining. Images in (D) and (F) represent sequential slides from the same paraffin embedded tissue block and have the same reference H&E slide. (G) Quantification of the data from (F) (data are presented as mean ± SD; *P<0.05; **P<0.01; ***P<0.001). (H) Western blot analysis of total and phosphorylated SMAD3, total and phosphorylated ATM, total and phosphorylated BRCA1, total and phosphorylated H2AX, PARP, BCL-2, and BCL-XL protein expression in PDX tumor tissues untreated or treated with oxaliplatin, SiS3 or their combination. β-actin was used for normalization and a representative β-actin is shown. Quantitative analysis of protein expression is included under the corresponding blot. (I) Schematic illustration showing the proposed mechanism of SMAD3 mediated oxaliplatin resistance in EAC. Exposure to oxaliplatin induces a low amount of DNA damage in EAC cells that can be overcome by upregulating DNA repair mechanisms, leading to oxaliplatin resistance and cell survival. Inhibition of SMAD3 in combination with oxaliplatin augments DNA damage in EAC cells and decreases DNA repair by inhibiting major repair proteins, including ATM and ATR. Mechanistically, SMAD3 directly interacts with PP2A, reducing its ability to bind to and inhibit ATM phosphorylation. Inhibiting SMAD3 reverses this effect (Created with BioRender.com).

References

    1. Siegel RL, Miller KD, Wagle NS, Jemal A, Cancer statistics, 2023. CA: A Cancer Journal for Clinicians 73, 17–48 (2023). - PubMed
    1. Yang J et al. , Understanding Esophageal Cancer: The Challenges and Opportunities for the Next Decade. Front Oncol 10, 1727 (2020). - PMC - PubMed
    1. SEER Cancer Stat Facts: Esophageal Cancer.
    1. Moon SU et al. , Effect of Smad3/4 on chemotherapeutic drug sensitivity in colorectal cancer cells. Oncol Rep 33, 185–192 (2015). - PubMed
    1. Jung B, Staudacher JJ, Beauchamp D, Transforming Growth Factor β Superfamily Signaling in Development of Colorectal Cancer. Gastroenterology 152, 36–52 (2017). - PMC - PubMed

MeSH terms