. 2024 Sep 2;196(1):409-431.
doi: 10.1093/plphys/kiae196.

Direct and indirect responses of the Arabidopsis transcriptome to an induced increase in trehalose 6-phosphate

Affiliations

Direct and indirect responses of the Arabidopsis transcriptome to an induced increase in trehalose 6-phosphate

Omri Avidan et al. Plant Physiol. .

Abstract

Trehalose 6-phosphate (Tre6P) is an essential signal metabolite that regulates the level of sucrose, linking growth and development to the metabolic status. We hypothesized that Tre6P plays a role in mediating the regulation of gene expression by sucrose. To test this, we performed transcriptomic profiling on Arabidopsis (Arabidopsis thaliana) plants that expressed a bacterial TREHALOSE 6-PHOSPHATE SYNTHASE (TPS) under the control of an ethanol-inducible promoter. Induction led to a 4-fold rise in Tre6P levels, a concomitant decrease in sucrose, significant changes (FDR ≤ 0.05) of over 13,000 transcripts, and 2-fold or larger changes of over 5,000 transcripts. Comparison with nine published responses to sugar availability allowed some of these changes to be linked to the rise in Tre6P, while others were probably due to lower sucrose or other indirect effects. Changes linked to Tre6P included repression of photosynthesis-related gene expression and induction of many growth-related processes including ribosome biogenesis. About 500 starvation-related genes are known to be induced by SUCROSE-NON-FERMENTING-1-RELATED KINASE 1 (SnRK1). They were largely repressed by Tre6P in a manner consistent with SnRK1 inhibition by Tre6P. SnRK1 also represses many genes that are involved in biosynthesis and growth. These responded to Tre6P in a more complex manner, pointing toward Tre6P interacting with other C-signaling pathways. Additionally, elevated Tre6P modified the expression of genes encoding regulatory subunits of the SnRK1 complex and TPS class II and FCS-LIKE ZINC FINGER proteins that are thought to modulate SnRK1 function and genes involved in circadian, TARGET OF RAPAMYCIN, light, abscisic acid, and other hormone signaling.


Conflict of interest statement

Conflict of interest statement. None declared.

Figures

Figure 1.
Figure 1.
Changes of Tre6P and sucrose after induction of bacterial TPS in the light. Arabidopsis iTPS29.2 and alcR plants (for details see Materials and Methods and Supplementary text) were grown in long-day conditions (16 h light/8 h dark, 160 µmol m−2 s−1 irradiance) for 22 d and were then sprayed at 0.5 h after dawn (Zeitgeber time 0.5, ZT0.5, red arrow) with either 2% (v/v) ethanol (EtOH) or water, and harvested 2, 4 and 6 h later (ZT2.5, 4.5, 6.5). The light period is indicated in the upper gray (dark) and orange (light) bar. Measurements were carried out on three controls (alcR and iTPS sprayed with water and alcR sprayed with 2% (v/v) ethanol) and on iTPS29.2 sprayed with 2% (v/v) ethanol to induce bacterial TPS. A) Tre6P, B) Sucrose, nmol or µmol per g fresh weight (FW). The results are plotted as mean ± Sd. (n = 4) (each replicate contained four to five whole rosettes). Significant differences (one-way ANOVA, Holm-Sidak) are denoted by asterisks (*P < 0.05, **P < 0.01, ***P < 0.001) when the ethanol-induced iTPS samples were significantly different from all three controls in pairwise comparisons. Data for additional metabolites are shown in Supplementary Fig. S4 and the original data are provided in Supplementary Data Set S3.
Figure 2.
Figure 2.
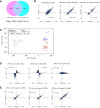
Changes of transcript abundance 4 and 6 h after induction of bacterial TPS in the light. Arabidopsis iTPS29.2 and alcR plants (for details see Materials and Methods, Supplementary text) were grown and treated with ethanol (EtOH) or water as described in Fig. 1 and RNA was extracted for RNAseq analysis. A) DEGs were identified by comparing the transcript abundance in the ethanol-sprayed samples to their water-sprayed control, using RPKM values (see Materials and Methods). The VENN diagram compares DEGs that passed FDR < 0.05 and FC ≥ 2 filters (FDR, false discovery rate; FC, fold change) in the 4 and 6 h datasets; the numbers at the bottom represent total DEGs, while numbers located within circles represent shared and nonshared responses. B) Comparison of transcript responses at 4 and 6 h for all 23.8K detected genes (left), the 10,867 transcripts that passed the FDR < 0.05 filter (middle), and the 4,273 transcripts that passed the FDR < 0.05 and FC ≥ 2 filter (right). C) PC analysis performed on all detected transcripts. Genotype (29.2, alcR) is indicated in the figure, red and blue are the 4 and 6 h treatments, circles and crosses are water- and ethanol-sprayed (see insert). D) Deconvoluted response to elevated Tre6P plotted against the CRF for iTPS 4 h (analogous plots for the response at 6 h are provided in Supplementary Fig. S5B). The CRF summarizes the response of a given Arabidopsis gene transcript to a change in sugar levels across a set of treatments. They included addition of exogenous glucose or sucrose to starved seedlings in liquid culture under continuous low light (Bläsing et al. 2005, Osuna et al. 2007), comparison of the starchless pgm mutant with wild-type plants at four times in the diel cycle (Gibon et al. 2004; Bläsing et al. 2005; Usadel et al. 2008), and illumination of wild-type plants for 4 h with ambient or low CO2 (Bläsing et al. 2005). An increasingly positive sign denotes an increasingly large average increase in abundance, an increasingly negative sign denotes an increasingly large average decrease in abundance and a value around zero indicates that average transcript abundance does not respond to sugar status. Group 1 (G1) denotes transcripts where the iTPS response and CRF are qualitatively the same and, by inference, the iTPS response may be a direct response to elevated Tre6P. Group 2 (G2) denotes transcripts where the iTPS response and CRF are qualitatively opposed and by inference the iTPS response is unlikely to be a direct response to elevated Tre6P. Group 0 (G0) denotes transcripts that respond in the iTPS response but cannot be assigned to G1 or G2 because they do not show a consistent response to changes in sugars (for details see Supplementary Fig. S2 and Supplementary Data Set S2). E) Comparability of the response of transcript assigned to G1, G2 and G0 in the 4 and 6 h data set.
Figure 3.
Figure 3.
Enrichment analysis of responses at 4 and 6 h after induction of TPS. The analysis was conducted using PageMan (Usadel et al. 2006) and MapMan software (version 3.6.0RC1; https://mapman.gabipd.org/; Ath_AGI_LOCUS_TAIR10_Aug2012). The analysis was performed separately for the sets of genes that were assigned to the CRF groups G1, G2, and G0 (see Supplementary Fig. S2) and for the responses at 4 and 6 h after spraying. The CFR groups are shown from left to right in the block in which the 4 and 6 h response is displayed. The analyses used the log2FC values for all genes in a given category. These were filtered (FDR < 0.05, FC ≥ 2; all values that did not pass the filter were set to zero) and all individual FC values in a given BIN (including the values set to zero) were then averaged. The average log2FC values for each BIN (the upper category in the MapMan ontology) are displayed as a heat map (for scale see insert). An analysis in which a lower FC filter was used and analyses in which several higher-level categories (photosynthesis, gluconeogenesis/glyoxylate, N metabolism, nucleotide metabolism, secondary metabolism, protein, cell wall) are broken down into subcategories (subBINS) are provided in Supplementary Fig. S7. iTPS, induction of TPS; CHO, carbohydrate, OPP, oxidative pentose phosphate pathway; TCA, tricarboxylic acid cycle; N, nitrogen; S, sulfur.
Figure 4.
Figure 4.
Induction of TPS leads to upregulation of ribosome biogenesis at the transcript level. The plots show changes in transcript abundance after induction of TPS (iTPS) for genes assigned to ribosomal proteins, ribosome biogenesis, and ribosomal RNA in the MapMan ontology. For each transcript, the response was calculated as the average change in ethanol-sprayed iTPS plants (induced) compared to water-sprayed iTPS plants (control) at 4 or 6 h after spraying. A) Coordinated responses in subBINs associated with ribosome biogenesis. The analysis was performed using PageMan (Usadel et al. 2006); the shading indicates the average change in transcript abundance for genes assigned to a given subBIN. As in Fig. 3, for genes that did not pass the combined FDR < 0.05 and log2FC ≥ 2 the FC value was set as zero before calculating the average response. An analysis using a lower FC filter is provided in Supplementary Fig. S7G. B) Comparison of iTPS response for genes assigned to ribosome biogenesis compared to their CRF (see Supplementary Fig. S2), both on a log2 scale. The iTPS responses at 4 and at 6 h after spraying are shown in brown and blue, respectively.
Figure 5.
Figure 5.
Summary of the metabolic and growth-related responses to an increase in Tre6P. Categories of genes that respond directly to elevated Tre6P were inferred from their assignment to CRF G1, while categories of genes that respond to the concomitant fall in sucrose were inferred from their assignment to CRF G2. Upregulated and downregulated gene categories are shown in blue and red, respectively (see Supplementary Fig. S2 and Supplementary Data Set S4).
Figure 6.
Figure 6.
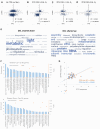
Comparison of the response to an induced increase in Tre6P and constitutive overexpression of a bacterial TPS. The response of transcript abundance to constitutive overexpression of a bacterial TPS (oeTPS) is taken from Zhang et al. (2009) who harvested 7-d-old seedlings growing in liquid culture under continuous light. A) oeTPS response plotted against the iTPS response (response to an induced increase in Tre6P) at 4 h after induction of TPS. Of the 5.2K responsive transcripts reported by Zhang et al. (2009), 4,966 were found in the iTPS response data set. No FDR filter was applied to the iTPS dataset for this plot. B to D) oeTPS response plotted against the iTPS response for the 2,437 transcripts that responded significantly (FDR < 0.05) at both 4 and 6 h after spraying (termed “iTPS 4-6h” in the display). Data were plotted separately for each CRF group of genes: (B) 1,596 transcripts assigned to CRF G1, (C) 494 transcripts that were assigned to CRF G2, and (D) 347 transcripts that were assigned to CRF G0. Transcripts were assigned to CRF G1, G2, and G0 as explained in Supplementary Fig. S2. The iTPS response of transcripts in G1 is probably a direct response to elevated Tre6P, in G2 to lower sugar and GO to more complex interactions. Plots of oeTPSA against the individual 4 and 6 h iTPS responses are provided in Supplementary Fig. S12, A and B. E, F) Enriched pathways based on GO. The analysis was performed for DEGs from the oeTPS data set of Zhang et al. (2009) that were assigned to G1 in both iTPS datasets (4 and 6 h). E) This shared set of transcripts was analyzed using the TagCrowd online tool (https://tagcrowd.com/) to identify frequently occurring terms among the gene names and descriptions and are shown in a word map with the font size representing the frequency. F) Histogram depicting the fold enrichment (left y-axis) and P-value (right y-axis) of the top 30 enriched processes. An analysis of all enriched processes is provided in Supplementary Fig. S12D. G) Comparison of the oeTPS (Zhang et al. 2009) and iTPS responses for genes assigned to ribosome biogenesis, both plotted on a log2 scale. The plot shows the iTPS response at 4 and at 6 h after spraying. The number of genes shown in this display is less that in panel B because not all of the genes in the iTPS response were present in the data set of Zhang et al. (2009). Although the oeTPS data of Zhang et al. (2009) showed the strong response of ribosome biogenesis, this was not explicitly noted at the time because assignment of genes to the ribosome biogenesis category was very incomplete in the ontology that they used.
Figure 7.
Figure 7.
Schematic overview summarizing responses of transcript encoding proteins involved in Tre6P metabolism and subunits of the SnRK1 complex. TPS and TPP genes and SnRK1 subunit genes whose transcripts responded to elevated Tre6P were assigned to CRF groups G1, G2, and G0. All showed a significant change (FDR < 0.05), transcripts showing a FC ≥ 2 are highlighted as bold. Based on responses to transient overexpression of SnRK1α1 (Baena-González et al. 2007), it could be inferred that most of the genes in CRF group G1 were responding due to inhibition of SnRK1 by Tre6P. The genes in CRF group G2 are probably responding to the decrease in sucrose and other sugars that follows an induced rise in Tre6P levels, rather than the rise in Tre6P per se. Genes in CRF group G0 respond to Tre6P but their expression appears not to be regulated by sugars. The response of SnRK1β3 is shown in brackets because it is inconsistent at 4 and 6 h. Upregulated and downregulated genes are shown in blue and red, respectively. The display is based on data provided in Supplementary Figs. S13 and S14A.
Figure 8.
Figure 8.
Response of SnRK1-regulated transcripts to elevation of Tre6P levels. A list of SnRK1-regulated transcripts was drawn up based on the data for the response to transient overexpression of SnRK1α1 in Arabidopsis mesophyll protoplasts (Baena-Gonzalez et al. 2007, here termed the tSnRK1 α1 response). A total of 1,001 of these transcripts was retrieved in the unfiltered iTPS data set. A) Regression plot for all 1001 genes of the tSnRK1α1 response versus the response at 4 h (left and 6 h (right) after spraying iTPS29.2 with ethanol (iTPS response). In the 4 and 6 h iTPS samples, 763 and 762 transcripts, respectively, showed a qualitatively opposite response to their tSnRKα1 response, whilst 242 and 243 transcripts, respectively, showed a qualitatively similar response to their tSnRK1α1 response. B) Regression plot for all 1,001 DEGs of the tSnRK1α1 response versus the filtered G1 iTPS response. Transcripts were filtered (FDR > 0.05, log2FC ≥ 0.2) and then compared with the CRF (Supplementary Fig. S2) to assign transcripts to G1 (i.e. transcripts whose iTPS response is qualitatively similar to their CRF and probably a direct effect of elevated Tre6P). A total of 580 and 541 transcripts were assigned to G1 in the iTPS 4 and iTPS 6 h data sets, respectively. Of these transcripts, at 4 and 6 h iTPS, the vast majority (571 and 532, respectively) showed a qualitatively opposite response to their tSnRK1α1 response, whilst at both times only nine transcripts showed a qualitatively similar response to their tSnRK1α1 response. Further information about these analyses and the correlations between tSnRK1α1 response and transcripts assigned to iTPS CRF groups G2 and GO is provided in Supplementary Fig. S14 and Supplementary Table S6. C) Regression plots of the tSnRK1α1 response and the iTPS and oeTPS1 response (response to constitutive overexpression of TPS, see Fig. 6) of genes encoding ribosome assembly factor. The plot shows all 74 genes assigned to the subBIN “ribosome biogenesis” in the MapMan TAIR10 ontology. Of these, 54 were assigned to CRF group G1 and 10 to CRF group G0, respectively, in at least one of the two iTPS treatments, and only four were unassigned. The responses in the 4 and 6 h iTPS treatments were similar and those in the oeTPS response were qualitatively similar but stronger than in the induced treatments. As reported in Baena-González et al. (2007), tSnRK1α1 represses ribosome assembly genes (see also Supplementary Fig. S14I). The vast majority of the changes in response to overexpression of TPS were therefore reciprocal to the response to tSnRK1α1.
Figure 9.
Figure 9.
Interactions between Tre6P and SnRK1 signaling. The known inhibitory effect of Tre6P in SnRK1 activity is shown as a solid black line. In addition, Tre6P regulates the expression of the two regulatory β-subunits of SnRK1, repressing SnRK1β1 and inducing SnRK1β2, which will probably lead to changes in SnRK1 complex composition. Tre6P also represses expression of several TPS Class II genes, in particular clade 2 (TPS8, TPS9, TPS10, TPS11) that were shown to physically interact with and at least in some cases may inhibit SnRK1 activity (van Leene et al. 2022). Furthermore, Tre6P induces FLZ group 3 genes, which also regulate SnRK1 activity (see Jamsheer et al. 2015, 2022; Nietzsch et al. 2016). These interactions are shown as dotted lines. The action of Tre6P on the SnRK1 β-subunits, TPS class II and FLZ group 3 expression may be mediated via inhibition of SnRK1 activity. The arrows to “various SnRK1 outputs” indicate that the changes in SnRK1 composition and interacting proteins may modify if and how they operate. In addition, it has been shown that increased expression of tSnRK1α1 dampens the response of Tre6P to sucrose (Peixoto et al. 2021) (gray line).
Figure 10.
Figure 10.
Regulation of metabolism and growth by Tre6P. Flows of C, N, and S are indicated by open arrows, transcriptional regulation, and post-translational regulation by Tre6P and thick solid arrows and thick dotted arrows, respectively. Thin solid arrows denote further C signaling. Tre6P represses expression of genes encoding components of the photosynthetic machinery and post-translationally modified starch and sucrose breakdown. Tre6P exerts positive transcriptional regulation on biosynthesis- and growth-related processes, in part by action via inhibition of SnRK1 and via links to TOR. Tre6P inhibits starvation responses via inhibition of SnRK1. The action of Tre6P on SnRK1 involves not only inhibition but also alteration of SnRK1 composition, and modification of the expression of genes encoding TPS Class II proteins and S1/C FLZ proteins that interact with SnRK1 and presumably modify its activity and functionality (see also Fig. 9) as well as links and overlap with type S1/C bZIP signaling. The induction of ribosome biogenesis may be at least partly explained by inhibition of SnRK1 by elevated Tre6P, but other mor direct links to TOR (TARGET OF RIFAMYCIN) cannot be excluded (indicated by gray arrows) The action of Tre6P on C metabolism is probably reinforced by other sugar-signaling pathways. Tre6P is not directly involved in the transcriptional regulation of N and S assimilation, but acts at a post-translational level to promote C flux to organic acids (OA) and amino acids (AA). The synthesis of major sets of specialized metabolites like glucosinolates, phenylpropanoids, and flavonoids appears to be regulated by sugar-signaling pathways other than Tre6P, which may nevertheless make a small contribution (not depicted in this summary display). Links from sugar-signaling (largely Tre6P-independent) to cell wall modification and expansion growth, and links from Tre6P to light-signaling, the circadian clock and various hormone-signaling pathways are not depicted in this summary display.

Similar articles

Cited by

References

    1. Allemeersch J, Durinck S, Vanderhaeghen R, Alard P, Maes R, Seeuws K, Bogaert T, Coddens K, Deschouwer K, Van Hummelen P, et al. . Benchmarking the CATMA microarray. A novel tool for Arabidopsis transcriptome analysis. Plant Physiol. 2005:137(2):588–601. 10.1104/pp.104.051300 - DOI - PMC - PubMed
    1. Annunziata MG, Apelt F, Carillo P, Krause U, Feil R, Mengin V, Lauxmann MA, Köhl K, Nikoloski Z, Stitt M, et al. . Getting back to nature: a reality check for experiments in controlled environments. J Exp Bot. 2017:68(16):4463–4477. 10.1093/jxb/erx220 - DOI - PMC - PubMed
    1. Avidan O, Moraes TA, Mengin VA, Feil R, Rolland F, Stitt M, Lunn JE. In-vivo protein kinase activity of SnRK1 fluctuates in Arabidopsis rosettes during light-dark cycles. Plant Physiol. 2023:192(1):387–408. 10.1093/plphys/kiad066 - DOI - PMC - PubMed
    1. Baena-González E, Lunn JE. SnRK1 and trehalose 6-phosphate—two ancient pathways converge to regulate plant metabolism and growth. Curr Opin Plant Biol. 2020:55:52–59. 10.1016/j.pbi.2020.01.010 - DOI - PubMed
    1. Baena-González E, Rolland F, Thevelein JM, Sheen J. A central integrator of transcription networks in plant stress and energy signaling. Nature. 2007:448(7156):938–942. 10.1038/nature06069 - DOI - PubMed

MeSH terms