

Correlation between estimated pulse wave velocity values from two equations in healthy and under cardiovascular risk populations
- PMID: 38593112
- PMCID: PMC11003621
- DOI: 10.1371/journal.pone.0298405
Correlation between estimated pulse wave velocity values from two equations in healthy and under cardiovascular risk populations
Abstract
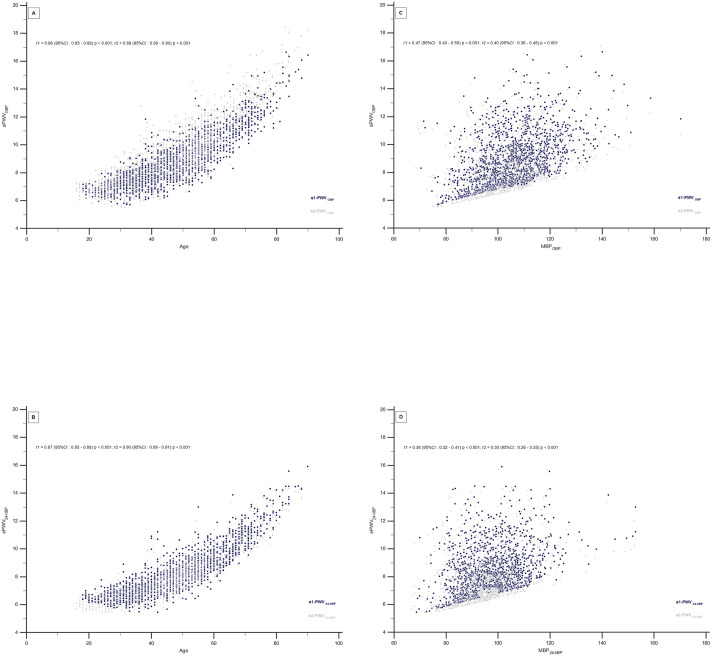
Introduction: Equations can calculate pulse wave velocity (ePWV) from blood pressure values (BP) and age. The ePWV predicts cardiovascular events beyond carotid-femoral PWV. We aimed to evaluate the correlation between four different equations to calculate ePWV.
Methods: The ePWV was estimated utilizing mean BP (MBP) from office BP (MBPOBP) or 24-hour ambulatory BP (MBP24-hBP). We separated the whole sample into two groups: individuals with risk factors and healthy individuals. The e-PWV was calculated as follows: [Formula: see text] [Formula: see text] We calculated the concordance correlation coefficient (Pc) between e1-PWVOBP vs e2-PWVOBP, e1-PWV24-hBP vs e2-PWV24-hBP, and mean values of e1-PWVOBP, e2-PWVOBP, e1-PWV24-hBP and e2-PWV24-hBP. The multilevel regression model determined how much the ePWVs are influenced by age and MBP values.
Results: We analyzed data from 1541 individuals; 1374 ones with risk factors and 167 healthy ones. The values are presented for the entire sample, for risk-factor patients and for healthy individuals respectively. The correlation between e1-PWVOBP with e2-PWVOBP and e1-PWV24-hBP with e2-PWV24-hBP was almost perfect. The Pc for e1-PWVOBP vs e2-PWVOBP was 0.996 (0.995-0.996), 0.996 (0.995-0.996), and 0.994 (0.992-0.995); furthermore, it was 0.994 (0.993-0.995), 0.994 (0.994-0.995), 0.987 (0.983-0.990) to the e1-PWV24-hBP vs e2-PWV24-hBP. There were no significant differences between mean values (m/s) for e1-PWVOBP vs e2-PWVOBP 8.98±1.9 vs 8.97±1.8; p = 0.88, 9.14±1.8 vs 9.13±1.8; p = 0.88, and 7.57±1.3 vs 7.65±1.3; p = 0.5; mean values are also similar for e1-PWV24-hBP vs e2-PWV24-hBP, 8.36±1.7 vs 8.46±1.6; p = 0.09, 8.50±1.7 vs 8.58±1.7; p = 0.21 and 7.26±1.3 vs 7.39±1.2; p = 0.34. The multiple linear regression showed that age, MBP, and age2 predicted more than 99.5% of all four e-PWV.
Conclusion: Our data presents a nearly perfect correlation between the values of two equations to calculate the estimated PWV, whether utilizing office or ambulatory blood pressure.
Copyright: © 2024 Silva et al. This is an open access article distributed under the terms of the Creative Commons Attribution License, which permits unrestricted use, distribution, and reproduction in any medium, provided the original author and source are credited.
Conflict of interest statement
The authors have declared that no competing interests exist.
Figures


Similar articles
-
Estimated carotid-femoral pulse wave velocity has similar predictive value as measured carotid-femoral pulse wave velocity.J Hypertens. 2016 Jul;34(7):1279-89. doi: 10.1097/HJH.0000000000000935. J Hypertens. 2016. PMID: 27088638
-
Association of Estimated Pulse Wave Velocity With Survival: A Secondary Analysis of SPRINT.JAMA Netw Open. 2019 Oct 2;2(10):e1912831. doi: 10.1001/jamanetworkopen.2019.12831. JAMA Netw Open. 2019. PMID: 31596491 Free PMC article.
-
Association of Blood Pressure Variability Ratio With Glomerular Filtration Rate Independent of Blood Pressure and Pulse Wave Velocity.Am J Hypertens. 2017 Nov 6;30(12):1177-1188. doi: 10.1093/ajh/hpx122. Am J Hypertens. 2017. PMID: 28992192
-
Estimated Pulse Wave Velocity and All-Cause and Cardiovascular Mortality in the General Population.J Clin Med. 2024 Jun 7;13(12):3377. doi: 10.3390/jcm13123377. J Clin Med. 2024. PMID: 38929906 Free PMC article.
-
Relationship of home blood pressure with target-organ damage in children and adolescents.Hypertens Res. 2011 May;34(5):640-4. doi: 10.1038/hr.2011.10. Epub 2011 Feb 17. Hypertens Res. 2011. PMID: 21326307
Cited by
-
The correlation between age, blood pressure variability and estimated pulse wave velocity.Sci Rep. 2025 Feb 27;15(1):6990. doi: 10.1038/s41598-025-91023-x. Sci Rep. 2025. PMID: 40011569 Free PMC article.
References
-
- Franklin SS, Gustin W, Wong ND, Larson MG, Weber MA, Kannel WB, et al.. Hemodynamic Patterns of Age-Related Changes in Blood Pressure. Circulation. 1997. Jul;96(1):308–15. - PubMed
-
- Lewington S, Clarke R, Qizilbash N, Peto R, Collins R. Age-specific relevance of usual blood pressure to vascular mortality: a meta-analysis of individual data for one million adults in 61 prospective studies. The Lancet. 2002. Dec;360(9349):1903–13. doi: 10.1016/s0140-6736(02)11911-8 - DOI - PubMed
MeSH terms
LinkOut - more resources
Full Text Sources
Medical
Miscellaneous
