. 2024 Apr 9;19(4):e0301713.
doi: 10.1371/journal.pone.0301713. eCollection 2024.

Local contribution to the somatosensory evoked potentials in rat's thalamus

Affiliations

Local contribution to the somatosensory evoked potentials in rat's thalamus

Władysław Średniawa et al. PLoS One. .

Abstract

Local Field Potential (LFP), despite its name, often reflects remote activity. Depending on the orientation and synchrony of their sources, both oscillations and more complex waves may passively spread in brain tissue over long distances and be falsely interpreted as local activity at such distant recording sites. Here we show that the whisker-evoked potentials in the thalamic nuclei are of local origin up to around 6 ms post stimulus, but the later (7-15 ms) wave is overshadowed by a negative component reaching from cortex. This component can be analytically removed and local thalamic LFP can be recovered reliably using Current Source Density analysis. We used model-based kernel CSD (kCSD) method which allowed us to study the contribution of local and distant currents to LFP from rat thalamic nuclei and barrel cortex recorded with multiple, non-linear and non-regular multichannel probes. Importantly, we verified that concurrent recordings from the cortex are not essential for reliable thalamic CSD estimation. The proposed framework can be used to analyze LFP from other brain areas and has consequences for general LFP interpretation and analysis.


Conflict of interest statement

The authors have declared that no competing interests exist.

Figures

Fig 1
Fig 1. Whisker evoked activity in rat’s thalamus and cortex.
A: Schematic picture of the sensory pathway from the whisker pad to the thalamus (PoM and VPM) and somatosensory barrel cortex (BCx, both clearly visible on cytochrome oxidase stained coronal slice of a rat brain). Blue arrows indicate information flow from periphery to the cortex and a recurrent connection back to the thalamus. In the thalamus, whisker responsive area can be found in the upper-lateral sector of both VPM and PoM nuclei (near arrow heads). Trigeminal ganglion and brain stem nuclei are not marked for clarity of the schema. B: Depth profile of average LFP responses (EPs) to whisker stimulation obtained from Neuropixels inserted at ∼30 deg through the cortex to deep thalamic locations (approximate). Out of 384 Neuropixels channels, uppermost contacts were above the cortical surface while the deepest recording level was around 7.5 mm in the brain. C: Comparison of EPs from a medial cortical channel (indicated by the solid blue line in B) and a thalamic channel (indicated by the dashed red line in B). Vertical dashed line marks the stimulation time (note a bipolar wave of the stimulus artifact around zero, which increases the correlation between thalamic and cortical waveforms presented in D). Circles mark the components of early thalamic negative wave N11 (o) and N12 (oo); the second coincides with strong cortical potential. Note the difference in magnitudes of the cortical and thalamic EPs—left ordinate for cortex, right ordinate for thalamus. D: Average rolling correlation across all experiments (n = 11) computed between the central cortical channel and the central thalamic channel (chosen from the histology). Values computed in 3 ms window (represented by gray area in C) were attached at a time point corresponding to the beginning of that window (indicated by the horizontal arrow in C). The blue band along the plot indicates the standard error of the mean across all experiments. Gray shading marks the time when the mean correlation is above 0.5. A similar effect before whisker deflection marked in pink is a consequence of the stimulus artifact.
Fig 2
Fig 2. Field potential spread from cortex to the tahalamus.
A: Example spatiotemporal EP profile from Neuropixels probe (same data as in Fig 1B) presented as a 3D color map. B: Spatiotemporal CSD profile estimated from data in A. Note evident current sinks and sources in the thalamic region. C: Spatiotemporal profile of EPs estimated in the whole cortico-thalamic space from recordings restricted to cortical area marked in B by a gray rectangle. Note a stripe of negative (purple) potential around 10 ms spreading from cortical sources to deep subcortical levels, which may modify thalamic waveforms. In all panels, horizontal axis shows the time with respect to the stimulus (applied at t = 0); left vertical axis shows recording depth; colorbars on the right of each panel show the magnitude of potential (A and C, [mV]) and current source density (B, [μA/mm3]). Vertical dotted lines at time 0 mark the stimulus onset and related artefact in the data.
Fig 3
Fig 3. Comparison of measured EPs with their counterparts computed from subsets of current sources.
Example from an experiment using 8x8 Neuronexus probes. Panels in the first row (A1, B1 and C1) show schematic representations of sources reconstruction space (black dots: electrode positions; blue dots: subset of CSD used for computation of cortical (B) and thalamic (C) contributions to the EPs. Measured EPs and computed contributions are overlaid in the second (for cortical channels) and third row (for thalamic channels). Note a lateral gradient of EP amplitude in the cortex—NeuroNexus A8x8 silicon probe was inserted on the edge of barrel field (see S1 Text, Fig 2B). In the thalamus (A3, B3, C3) we can spot two clusters of early evoked responses—one (middle-right area) around the main whisker representation in VPM/PoM complex, the other (lower edge) corresponding to zona incerta nucleus. (A) All the cortical and thalamic sources were used for computed EPs shown in A2, A3 panels. Obtained EPs are consistent with the measurements which shows the method is self-consistent. (B) Cortical contributions to the measured EPs (B2, B3). Estimated potentials fit well cortical measurements (B2) and show similarities with thalamic recordings (B3). (C) Thalamic contributions to the measured EPs (C2, C3). As expected, the thalamic contributions to the cortical channels are negligible. On the other hand, the truly local part of the thalamic LFP, which is that estimated from thalamic sources (dashed orange line), is different from the measured EPs, which are contaminated by passively propagated strong cortical signal (dashed blue line in B3).
Fig 4
Fig 4. Group comparison of measured and reconstructed potentials.
A: Examples of measured and reconstructed potential from central cortical (cyan and dotted-blue, left Y axis) and thalamic sites (orange and dashed-red, right Y axis) from Fig 3B2 and 3C3 panels. Solid lines represent measured potentials, dotted/dashed lines represent potential reconstructed from local sources. B: Potential values at 10 ms after whisker stimulation in recorded thalamic EPs and their reconstructions. Note significantly less negative values in reconstructed data (permutation paired-test, p-value = 0.002, n = 11). C: Reconstructed-minus-measured values for thalamic (red) and cortical (blue) potential wave at 10 ms post-stimulus. There is a significant difference from 0 in the thalamic area, (1 sample ttest, t = 3.03, p-value = 0.013, n = 11) but not in the cortex (1 sample ttest, t = 0.8, p-value = 0.44, n = 11) D: Average correlation score in cortical channels between measured EPs and EPs reconstructed from cortical (blue) or thalamic (red) sources. E: The same as B but for thalamic channels. Shaded corridor along line-plots in B and C represent SEM (n = 11 rats).
Fig 5
Fig 5. Four variants of the experimental setups and reconstruction space.
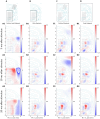
The first row shows drawing of a coronal slice of rat brain with schematic representation of the setup used in the analysis presented in a given column. The dots represent the electrodes taken into consideration. The frame indicates area where sources were assumed (i.e. where basis sources were placed). A: Recordings from the thalamus and cortex considered; sources assumed only in the thalamus. B: Only thalamic recordings considered; sources assumed only in the thalamus. C: Recordings from the thalamus and cortex considered; reconstruction in a large block of tissue covering thalamus and cortex (same as in D). D: Only thalamic recordings considered; reconstruction in a large block of tissue covering thalamus and cortex (same as in C). Rows 2–4 (denoted by numbers 1–3 and adequate letters A-D) show CSD reconstructions snapshots at 5, 10 and 20 ms after stimulus that were analyzed assuming setups indicated in the first row. CSD spatial maps are overlaid on a drawing representing histological verification of recording points (dots) location within thalamic structures. X and Y axes are scaled in millimeters with horizontal zero at cortical surface above thalamus and lateral (X axis) values measured from mid-line. Coronal plane corresponds to ∼3 mm posterior from bregma point. Note the different color scales shown next to each panel.

Similar articles

Cited by

References

    1. Nunez PL, Srinivasan R. Electric Fields of the Brain. Oxford University Press; 2006.
    1. Buzsáki G, Anastassiou CA, Koch C. The origin of extracellular fields and currents—EEG, ECoG, LFP and spikes. Nature Reviews Neuroscience. 2012;13(6):407–420. doi: 10.1038/nrn3241 - DOI - PMC - PubMed
    1. Einevoll GT, Kayser C, Logothetis NK, Panzeri S. Modelling and analysis of local field potentials for studying the function of cortical circuits. Nature reviews Neuroscience. 2013;14:770–785. doi: 10.1038/nrn3599 - DOI - PubMed
    1. Głąbska H, Chintaluri C, Wójcik DK. Collection of Simulated Data from a Thalamocortical Network Model. Neuroinformatics. 2017;15(1):87–99. doi: 10.1007/s12021-016-9319-4 - DOI - PMC - PubMed
    1. Mitzdorf U. Current source-density method and application in cat cerebral cortex: investigation of evoked potentials and EEG phenomena. Physiological Reviews. 1985;65:37–100. doi: 10.1152/physrev.1985.65.1.37 - DOI - PubMed