

Heterogeneous risk attitudes and waves of infection
- PMID: 38593169
- PMCID: PMC11003633
- DOI: 10.1371/journal.pone.0299813
Heterogeneous risk attitudes and waves of infection
Abstract
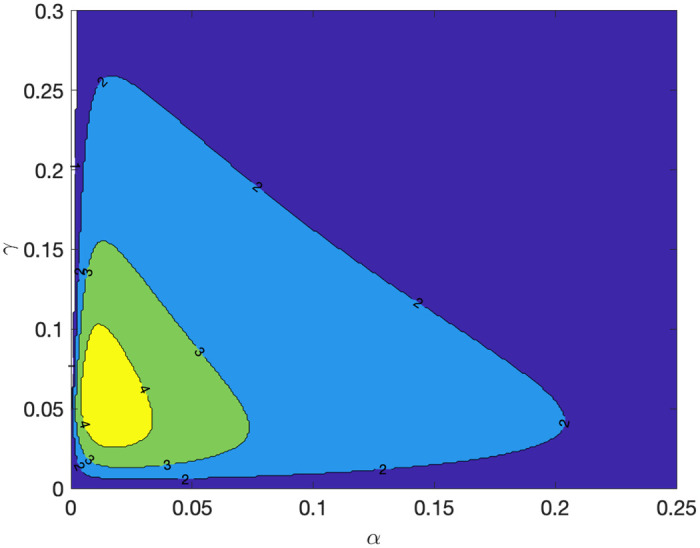
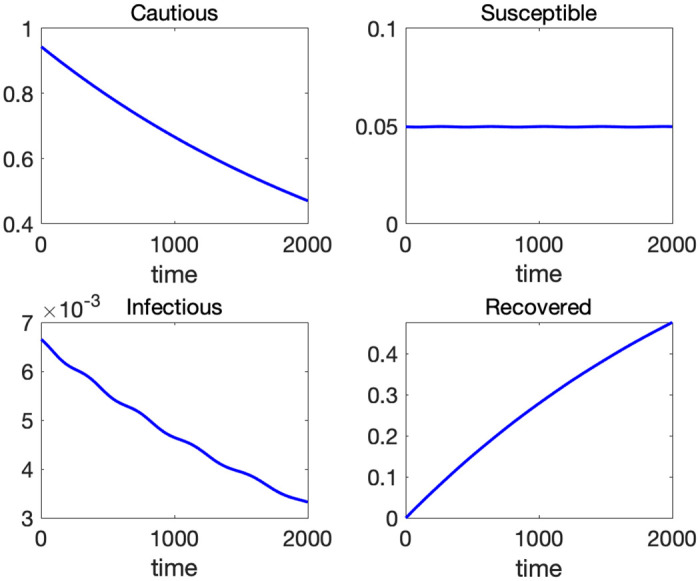
Many countries have experienced multiple waves of infection during the COVID-19 pandemic. We propose a novel but parsimonious extension of the SIR model, a CSIR model, that can endogenously generate waves. In the model, cautious individuals take appropriate prevention measures against the virus and are not exposed to infection risk. Incautious individuals do not take any measures and are susceptible to the risk of infection. Depending on the size of incautious and susceptible population, some cautious people lower their guard and become incautious-thus susceptible to the virus. When the virus spreads sufficiently, the population reaches "temporary" herd immunity and infection subsides thereafter. Yet, the inflow from the cautious to the susceptible eventually expands the susceptible population and leads to the next wave. We also show that the CSIR model is isomorphic to the SIR model with time-varying parameters.
Copyright: © 2024 Fujii et al. This is an open access article distributed under the terms of the Creative Commons Attribution License, which permits unrestricted use, distribution, and reproduction in any medium, provided the original author and source are credited.
Conflict of interest statement
The authors have declared that no competing interests exist.
Figures


Similar articles
-
Generalized SIR (GSIR) epidemic model: An improved framework for the predictive monitoring of COVID-19 pandemic.ISA Trans. 2022 May;124:31-40. doi: 10.1016/j.isatra.2021.02.016. Epub 2021 Feb 15. ISA Trans. 2022. PMID: 33610314 Free PMC article.
-
Model based estimation of the SARS-CoV-2 immunization level in austria and consequences for herd immunity effects.Sci Rep. 2022 Feb 21;12(1):2872. doi: 10.1038/s41598-022-06771-x. Sci Rep. 2022. PMID: 35190590 Free PMC article.
-
COVID-19: Second Wave or Multiple Peaks, Natural Herd Immunity or Vaccine - We Should be Prepared.Disaster Med Public Health Prep. 2022 Apr;16(2):718-725. doi: 10.1017/dmp.2020.349. Epub 2020 Sep 10. Disaster Med Public Health Prep. 2022. PMID: 32907693 Free PMC article.
-
'Dark matter', second waves and epidemiological modelling.BMJ Glob Health. 2020 Dec;5(12):e003978. doi: 10.1136/bmjgh-2020-003978. BMJ Glob Health. 2020. PMID: 33328201 Free PMC article. Review.
-
Impact of Microbiota: A Paradigm for Evolving Herd Immunity against Viral Diseases.Viruses. 2020 Oct 10;12(10):1150. doi: 10.3390/v12101150. Viruses. 2020. PMID: 33050511 Free PMC article. Review.
Cited by
-
COVID-19 risk perceptions in Japan: a cross-sectional study.Sci Rep. 2024 Jul 23;14(1):16862. doi: 10.1038/s41598-024-67741-z. Sci Rep. 2024. PMID: 39043714 Free PMC article.
References
-
- Kermack WO, McKendrick AG, Walker GT. A contribution to the mathematical theory of epidemics. Proceedings of the Royal Society of London Series A, Containing Papers of a Mathematical and Physical Character. 1927;115(772):700–721. doi: 10.1098/rspa.1927.0118 - DOI
-
- Hamano M, Katayama M, Kubota S. COVID-19 Misperception and Macroeconomy. Working Paper. 2020;.
MeSH terms
LinkOut - more resources
Full Text Sources
Medical
