St. Jude Survivorship Portal: Sharing and Analyzing Large Clinical and Genomic Datasets from Pediatric Cancer Survivors
- PMID: 38593228
- PMCID: PMC11294819
- DOI: 10.1158/2159-8290.CD-23-1441
St. Jude Survivorship Portal: Sharing and Analyzing Large Clinical and Genomic Datasets from Pediatric Cancer Survivors
Erratum in
-
Correction: St. Jude Survivorship Portal: Sharing and Analyzing Large Clinical and Genomic Datasets from Pediatric Cancer Survivors.Cancer Discov. 2024 Dec 2;14(12):2554. doi: 10.1158/2159-8290.CD-24-1432. Cancer Discov. 2024. PMID: 39618286 Free PMC article. No abstract available.
Abstract
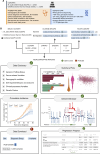
Childhood cancer survivorship studies generate comprehensive datasets comprising demographic, diagnosis, treatment, outcome, and genomic data from survivors. To broadly share this data, we created the St. Jude Survivorship Portal (https://survivorship.stjude.cloud), the first data portal for sharing, analyzing, and visualizing pediatric cancer survivorship data. More than 1,600 phenotypic variables and 400 million genetic variants from more than 7,700 childhood cancer survivors can be explored on this free, open-access portal. Summary statistics of variables are computed on-the-fly and visualized through interactive and customizable charts. Survivor cohorts can be customized and/or divided into groups for comparative analysis. Users can also seamlessly perform cumulative incidence and regression analyses on the stored survivorship data. Using the portal, we explored the ototoxic effects of platinum-based chemotherapy, uncovered a novel association between mental health, age, and limb amputation, and discovered a novel haplotype in MAGI3 strongly associated with cardiomyopathy specifically in survivors of African ancestry. Significance: The St. Jude Survivorship Portal is the first data portal designed to share and explore clinical and genetic data from childhood cancer survivors. The portal provides both open- and controlled-access features and will fulfill a wide range of data sharing needs of the survivorship research community and beyond. See co-corresponding author Xin Zhou discuss this research article, published simultaneously at the AACR Annual Meeting 2024: https://vimeo.com/932617204/7d99fa4958.
©2024 The Authors; Published by the American Association for Cancer Research.
Conflict of interest statement
K. Shelton reports grants from NIH and other support from American Lebanese Syrian Associated Charities during the conduct of the study. C. Im reports grants from US National Cancer Institute outside the submitted work. K.K. Ness reports grants from National Institutes of Health during the conduct of the study. G.T. Armstrong reports grants from NIH during the conduct of the study. M.M. Hudson reports grants from National Cancer Institute during the conduct of the study. J. Zhang reports grants from National Cancer Institute during the conduct of the study. No disclosures were reported by the other authors.
Figures


Similar articles
-
Correction: St. Jude Survivorship Portal: Sharing and Analyzing Large Clinical and Genomic Datasets from Pediatric Cancer Survivors.Cancer Discov. 2024 Dec 2;14(12):2554. doi: 10.1158/2159-8290.CD-24-1432. Cancer Discov. 2024. PMID: 39618286 Free PMC article. No abstract available.
-
St. Jude Cloud: A Pediatric Cancer Genomic Data-Sharing Ecosystem.Cancer Discov. 2021 May;11(5):1082-1099. doi: 10.1158/2159-8290.CD-20-1230. Epub 2021 Jan 6. Cancer Discov. 2021. PMID: 33408242 Free PMC article.
-
Cumulative burden of cardiovascular morbidity in paediatric, adolescent, and young adult survivors of Hodgkin's lymphoma: an analysis from the St Jude Lifetime Cohort Study.Lancet Oncol. 2016 Sep;17(9):1325-34. doi: 10.1016/S1470-2045(16)30215-7. Epub 2016 Jul 25. Lancet Oncol. 2016. PMID: 27470081 Free PMC article.
-
The St. Jude Children's Research Hospital After Completion of Therapy Clinic.J Cancer Surviv. 2024 Feb;18(1):23-28. doi: 10.1007/s11764-023-01519-6. Epub 2024 Jan 31. J Cancer Surviv. 2024. PMID: 38294599 Free PMC article. Review.
-
Emerging and Ongoing Survivorship Challenges Among Childhood Cancer Survivors and Providing Risk-Based Focused Follow-Up Care.Semin Oncol Nurs. 2021 Jun;37(3):151163. doi: 10.1016/j.soncn.2021.151163. Epub 2021 Jun 16. Semin Oncol Nurs. 2021. PMID: 34144848 Review.
Cited by
-
Benchmarking Transformer Embedding Models for Biomedical Terminology Standardization.Mach Learn Appl. 2025 Sep;21:100683. doi: 10.1016/j.mlwa.2025.100683. Epub 2025 Jun 5. Mach Learn Appl. 2025. PMID: 40718094 Free PMC article.
-
ppHiC: Interactive exploration of Hi-C results on the ProteinPaint web portal.Comput Struct Biotechnol J. 2024 Oct 2;23:3467-3471. doi: 10.1016/j.csbj.2024.09.020. eCollection 2024 Dec. Comput Struct Biotechnol J. 2024. PMID: 39430404 Free PMC article.
-
Genetic and epigenetic bases of long-term adverse effects of childhood cancer therapy.Nat Rev Cancer. 2025 Feb;25(2):129-144. doi: 10.1038/s41568-024-00768-6. Epub 2024 Nov 7. Nat Rev Cancer. 2025. PMID: 39511414 Free PMC article. Review.
-
NCI-Funded Cancer Epidemiology Survivor Cohorts: Overview, Progress, and Opportunities.Cancer Epidemiol Biomarkers Prev. 2025 May 2;34(5):627-640. doi: 10.1158/1055-9965.EPI-24-1750. Cancer Epidemiol Biomarkers Prev. 2025. PMID: 40036057
-
Correction: St. Jude Survivorship Portal: Sharing and Analyzing Large Clinical and Genomic Datasets from Pediatric Cancer Survivors.Cancer Discov. 2024 Dec 2;14(12):2554. doi: 10.1158/2159-8290.CD-24-1432. Cancer Discov. 2024. PMID: 39618286 Free PMC article. No abstract available.
References
-
- Ehrhardt MJ, Krull KR, Bhakta N, Liu Q, Yasui Y, Robison LL, et al. . Improving quality and quantity of life for childhood cancer survivors globally in the twenty-first century. Nat Rev Clin Oncol 2023;20:678–96. - PubMed
-
- Siegel RL, Miller KD, Fuchs HE, Jemal A. Cancer statistics, 2021. CA Cancer J Clin 2021;71:7–33. - PubMed
MeSH terms
Grants and funding
- U24 CA055727/CA/NCI NIH HHS/United States
- R01 CA261898/CA/NCI NIH HHS/United States
- P30 CA021765/CA/NCI NIH HHS/United States
- U01 CA195547/CA/NCI NIH HHS/United States
- R01 CA270157/CA/NCI NIH HHS/United States
- R01 CA216354/CA/NCI NIH HHS/United States
- American Lebanese Syrian Associated Charities (ALSAC)
- CA195547/National Institutes of Health (NIH)
- CA216354/National Institutes of Health (NIH)
- CA270157/National Institutes of Health (NIH)
- CA55727/National Institutes of Health (NIH)
- CA261898/National Institutes of Health (NIH)
LinkOut - more resources
Full Text Sources
Medical

