. 2024 Jun 4;23(6):877-889.
doi: 10.1158/1535-7163.MCT-23-0663.

Proton FLASH Radiotherapy Ameliorates Radiation-induced Salivary Gland Dysfunction and Oral Mucositis and Increases Survival in a Mouse Model of Head and Neck Cancer

Affiliations

Proton FLASH Radiotherapy Ameliorates Radiation-induced Salivary Gland Dysfunction and Oral Mucositis and Increases Survival in a Mouse Model of Head and Neck Cancer

Priyanka Chowdhury et al. Mol Cancer Ther. .

Abstract

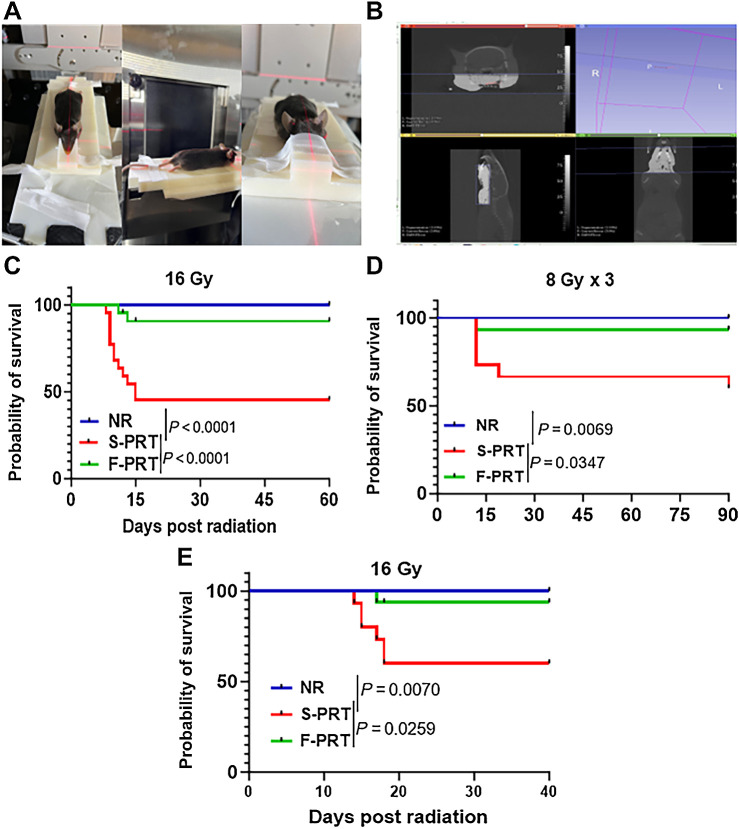
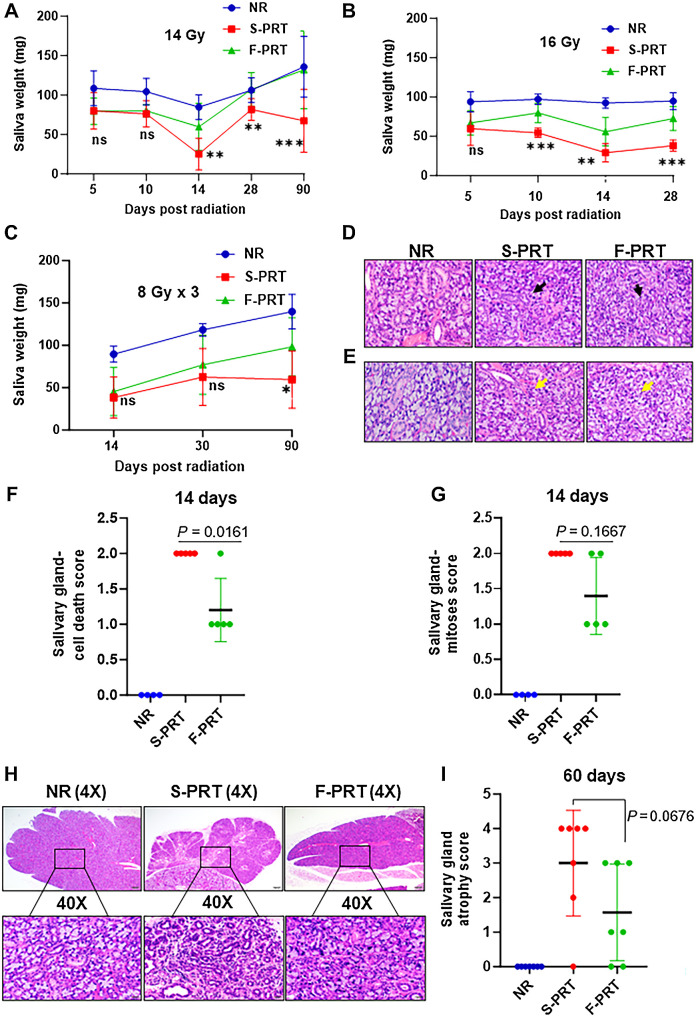
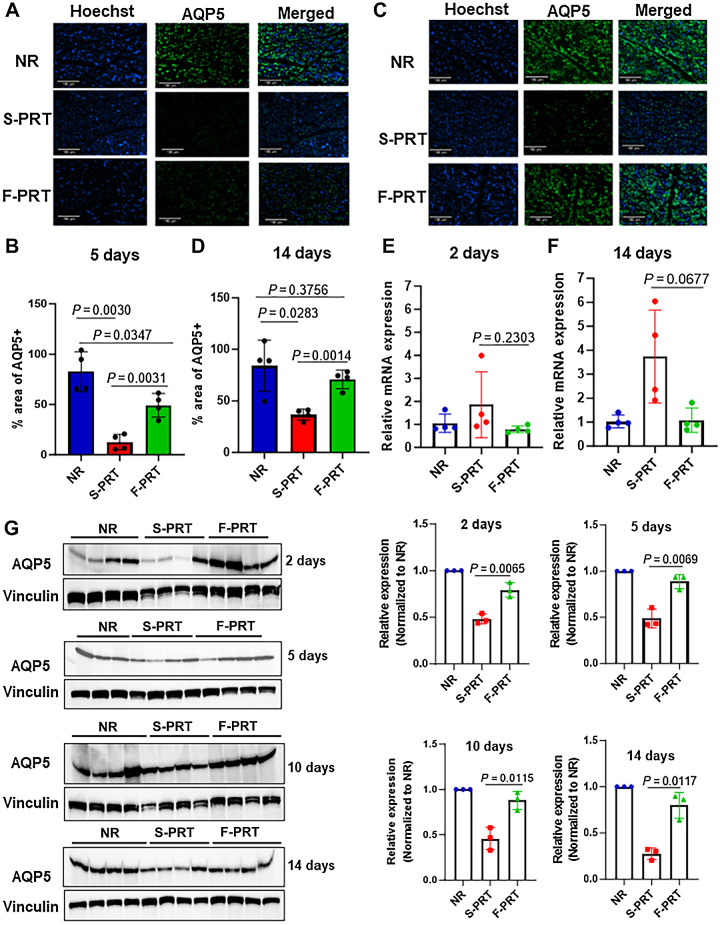
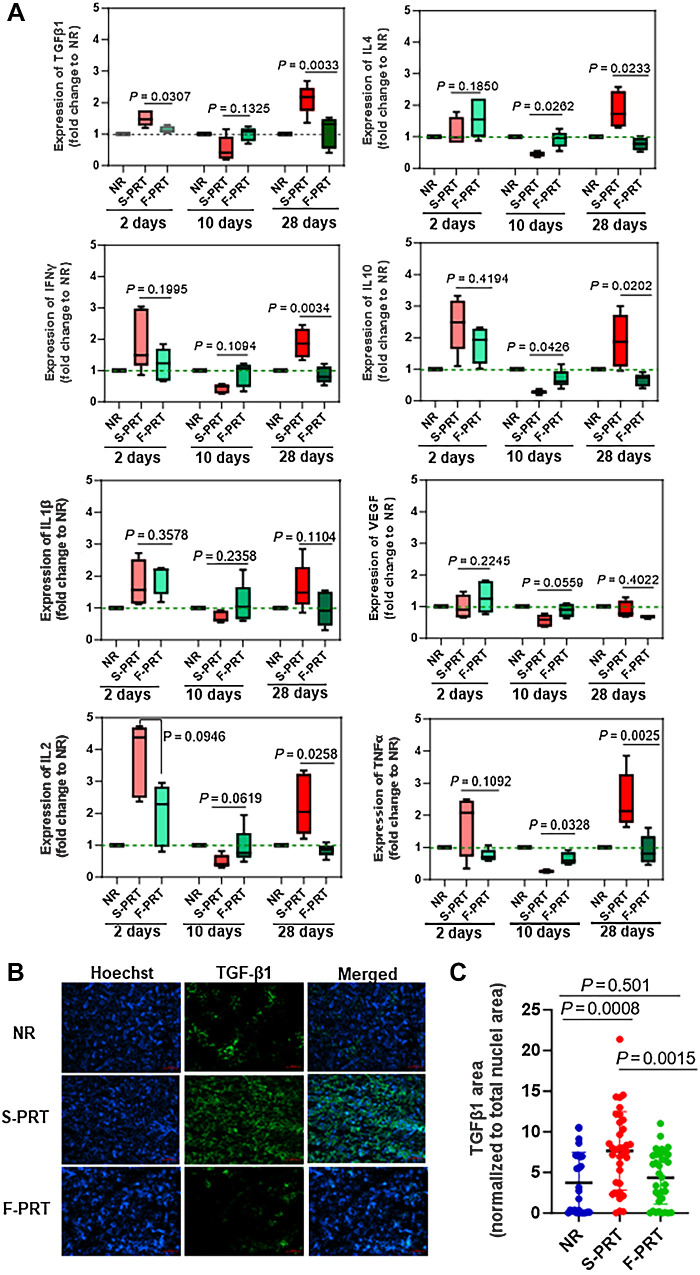
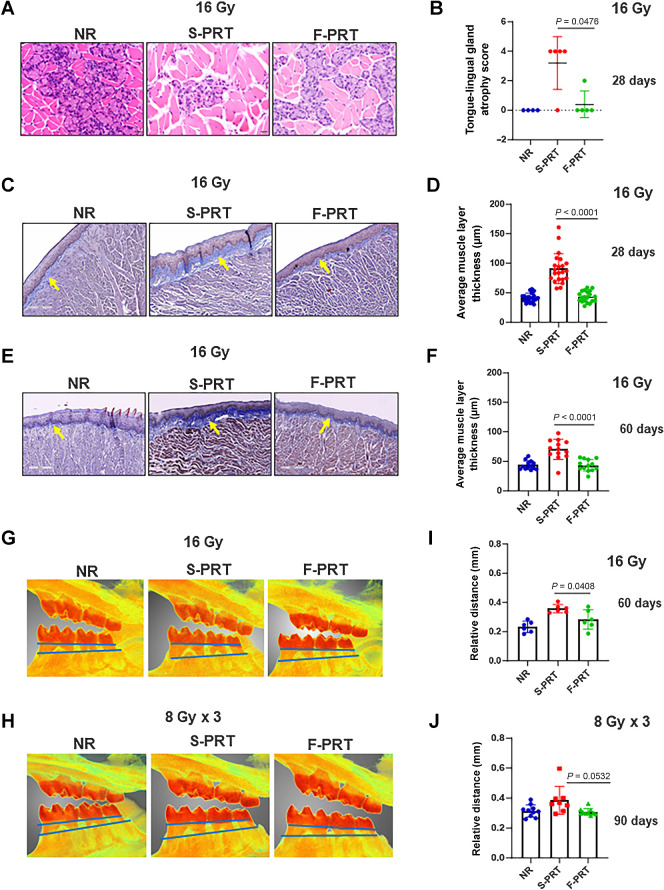
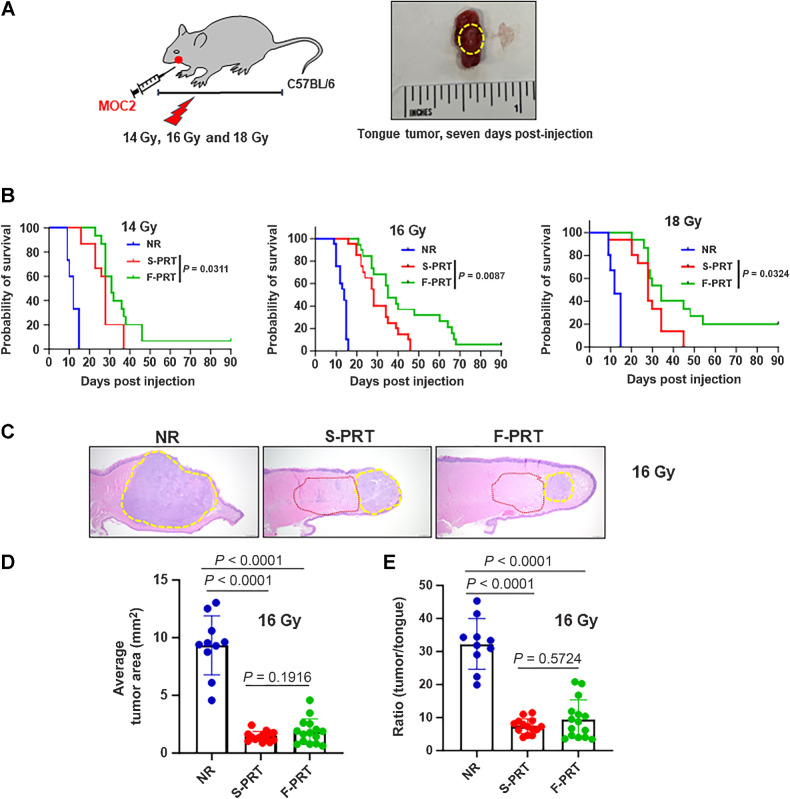
Head and neck cancer radiotherapy often damages salivary glands and oral mucosa, severely negatively impacting patients' quality of life. The ability of FLASH proton radiotherapy (F-PRT) to decrease normal tissue toxicity while maintaining tumor control compared with standard proton radiotherapy (S-PRT) has been previously demonstrated for several tissues. However, its potential in ameliorating radiation-induced salivary gland dysfunction and oral mucositis and controlling orthotopic head and neck tumor growth has not been reported. The head and neck area of C57BL/6 mice was irradiated with a single dose of radiotherapy (ranging from 14-18 Gy) or a fractionated dose of 8 Gy × 3 of F-PRT (128 Gy/second) or S-PRT (0.95 Gy/second). Following irradiation, the mice were studied for radiation-induced xerostomia by measuring their salivary flow. Oral mucositis was analyzed by histopathologic examination. To determine the ability of F-PRT to control orthotopic head and neck tumors, tongue tumors were generated in the mice and then irradiated with either F-PRT or S-PRT. Mice treated with either a single dose or fractionated dose of F-PRT showed significantly improved survival than those irradiated with S-PRT. F-PRT-treated mice showed improvement in their salivary flow. S-PRT-irradiated mice demonstrated increased fibrosis in their tongue epithelium. F-PRT significantly increased the overall survival of the mice with orthotopic tumors compared with the S-PRT-treated mice. The demonstration that F-PRT decreases radiation-induced normal tissue toxicity without compromising tumor control, suggests that this modality could be useful for the clinical management of patients with head and neck cancer.


Figures

Figure 1. Positioning of the mouse for the irradiation of the head and neck region with S-PRT or F-PRT and CT scan using SARRP. A, An anesthetized mouse was positioned on the stage for CT using SARRP on rails followed by irradiation with S-PRT/F-PRT. B, CBCT in the prone position of an anesthetized mouse. Kaplan–Meier plot of survival following irradiation in the head and neck region of female C57BL/6 mice with 16 Gy (C) and 8Gy × 3 (D) and irradiation in the head and neck region of male C57BL/6 mice with 16 Gy (E) of proton radiation; n = 22, n = 15, and n = 15, respectively, comparisons of risk of death used a log-rank test. Events recorded mortality or euthanasia if they demonstrated signs of distress, were moribund, or if their weight decreased by 20% of the initial body weight.
Figure 1.
Positioning of the mouse for the irradiation of the head and neck region with S-PRT or F-PRT and CT scan using SARRP. A, An anesthetized mouse was positioned on the stage for CT using SARRP on rails followed by irradiation with S-PRT/F-PRT. B, CBCT in the prone position of an anesthetized mouse. Kaplan–Meier plot of survival following irradiation in the head and neck region of female C57BL/6 mice with 16 Gy (C) and 8Gy × 3 (D) and irradiation in the head and neck region of male C57BL/6 mice with 16 Gy (E) of proton radiation; n = 22, n = 15, and n = 15, respectively, comparisons of risk of death used a log-rank test. Events recorded mortality or euthanasia if they demonstrated signs of distress, were moribund, or if their weight decreased by 20% of the initial body weight.
Figure 2. F-PRT reduces hyposalivation and preserves salivary gland tissues compared with S-PRT. Estimation of saliva flow following 14 Gy (A), 16 Gy (B), and hypofractionated dose of 8 Gy × 3 (C) of proton irradiation. Saliva was collected at several timepoints from each animal following irradiation with S-PRT/F-PRT. Mean saliva weights and differences between means from different groups were estimated using a mixed effect model to account for correlations between repeated measures on the same animal (n = 10 per group), “*” (0.01 < P ≤ 0.05), “**” (0.001 < P ≤ 0.01), and “***” (P ≤ 0.001). The statistically significant comparisons are for F-PRT versus S-PRT. D and E, Representative H&E images of salivary gland tissues elucidating individual cell death and increased mitoses respectively. 400X magnification, scale bar, 20 μm. The black arrow in the images represents cell death and the yellow arrow represents mitoses. F and G, Blinded evaluation of individual cell death and increased mitoses score respectively in salivary glands H&E-stained slides 14 days after irradiation with 16 Gy of PRT. NR, n = 4; S-PRT and F-PRT, n = 5, difference between groups assessed by Mann–Whitney test based on histopathology scoring. H, Representative H&E images of salivary gland tissues annotating salivary gland tissue atrophy. 4X and 40X magnification, scale bar, 200 μm and 20 μm, respectively. I, Blinded quantification of salivary gland atrophy score in H&E-stained slides 60 days after irradiation with 16 Gy of PRT; n = 7, Mann–Whitney test was used on the basis of histopathology scoring to compare between the groups.
Figure 2.
F-PRT reduces hyposalivation and preserves salivary gland tissues compared with S-PRT. Estimation of saliva flow following 14 Gy (A), 16 Gy (B), and hypofractionated dose of 8 Gy × 3 (C) of proton irradiation. Saliva was collected at several timepoints from each animal following irradiation with S-PRT/F-PRT. Mean saliva weights and differences between means from different groups were estimated using a mixed effect model to account for correlations between repeated measures on the same animal (n = 10 per group), “*” (0.01 < P ≤ 0.05), “**” (0.001 < P ≤ 0.01), and “***” (P ≤ 0.001). The statistically significant comparisons are for F-PRT versus S-PRT. D and E, Representative H&E images of salivary gland tissues elucidating individual cell death and increased mitoses respectively. 400X magnification, scale bar, 20 μm. The black arrow in the images represents cell death and the yellow arrow represents mitoses. F and G, Blinded evaluation of individual cell death and increased mitoses score respectively in salivary glands H&E-stained slides 14 days after irradiation with 16 Gy of PRT. NR, n = 4; S-PRT and F-PRT, n = 5, difference between groups assessed by Mann–Whitney test based on histopathology scoring. H, Representative H&E images of salivary gland tissues annotating salivary gland tissue atrophy. 4X and 40X magnification, scale bar, 200 μm and 20 μm, respectively. I, Blinded quantification of salivary gland atrophy score in H&E-stained slides 60 days after irradiation with 16 Gy of PRT; n = 7, Mann–Whitney test was used on the basis of histopathology scoring to compare between the groups.
Figure 3. F-PRT preserves the expression of AQP5 compared with that of S-PRT. A and C, Immunofluorescent staining for AQP5 (green) representing the expression of AQP5 at 5 and 14 days, respectively following 16 Gy irradiation of F-PRT versus S-PRT. 100X magnification, scale bar, 100 μm. B and D, Quantification of immunofluorescent detection of salivary gland AQP5 expression, after 5 days and 14 days, respectively after irradiation with 16 Gy PRT. n = 4, mean values compared using Welch t test. E and F, Relative mRNA expression of AQP5 from the submandibular gland (n = 4) at 2 and 14 days after irradiation with S-PRT/F-PRT. Statistical analysis Welch t test. G, Western blot analysis and their corresponding quantification of the expression of AQP5 from the submandibular gland (n = 4) at 2, 5, 10, and 14 days following irradiation with 16 Gy of S-PRT/F-PRT. Mean difference between groups compared by Welch t test.
Figure 3.
F-PRT preserves the expression of AQP5 compared with that of S-PRT. A and C, Immunofluorescent staining for AQP5 (green) representing the expression of AQP5 at 5 and 14 days, respectively following 16 Gy irradiation of F-PRT versus S-PRT. 100X magnification, scale bar, 100 μm. B and D, Quantification of immunofluorescent detection of salivary gland AQP5 expression, after 5 days and 14 days, respectively after irradiation with 16 Gy PRT. n = 4, mean values compared using Welch t test. E and F, Relative mRNA expression of AQP5 from the submandibular gland (n = 4) at 2 and 14 days after irradiation with S-PRT/F-PRT. Statistical analysis Welch t test. G, Western blot analysis and their corresponding quantification of the expression of AQP5 from the submandibular gland (n = 4) at 2, 5, 10, and 14 days following irradiation with 16 Gy of S-PRT/F-PRT. Mean difference between groups compared by Welch t test.
Figure 4. F-PRT induces lower levels of inflammatory cytokines in submandibular glands compared with S-PRT. A, Multiplex cytokine analysis on submandibular gland lysates at 2, 10, and 28 days after irradiation with 16 Gy of PRT. Values represent mean ± SEM (n = 3 for NR and n = 5 for S-PRT/F-PRT). The difference between means from different groups was estimated using a mixed-effects model. B, Immunofluorescent evaluation of TGFβ1 in mouse submandibular gland irradiated with S-PRT or F-PRT. C, Quantification of TGFβ1 signal in the submandibular gland 28 days after irradiation with PRT. n = 5, with 5 sections for each mouse of NR and seven sections for each mouse of S-PRT and F-PRT; mean values compared using Welch t test.
Figure 4.
F-PRT induces lower levels of inflammatory cytokines in submandibular glands compared with S-PRT. A, Multiplex cytokine analysis on submandibular gland lysates at 2, 10, and 28 days after irradiation with 16 Gy of PRT. Values represent mean ± SEM (n = 3 for NR and n = 5 for S-PRT/F-PRT). The difference between means from different groups was estimated using a mixed-effects model. B, Immunofluorescent evaluation of TGFβ1 in mouse submandibular gland irradiated with S-PRT or F-PRT. C, Quantification of TGFβ1 signal in the submandibular gland 28 days after irradiation with PRT. n = 5, with 5 sections for each mouse of NR and seven sections for each mouse of S-PRT and F-PRT; mean values compared using Welch t test.
Figure 5. F-PRT alleviates radiation-induced damage to the oral cavity compared with S-PRT. A, Representative images of H&E-stained longitudinal sections of the tongue 28 days after irradiation with 16 Gy of PRT. 400X magnification, scale bar, 20 μm. B, Blinded quantification of tongue lingual gland atrophy score in stained H&E slides 28 days after irradiation with 16 Gy of PRT. NR, n = 4; S-PRT and F-PRT, n = 5, difference between groups assessed by Mann–Whitney test. C and E, Representative images of Mason Trichrome staining of tongue epithelium (indicated by yellow arrow) for the detection of fibrosis 28 and 60 days after irradiation with 16 Gy of S-PRT/F-PRT. 200X magnification, scale bar, 200 μm. D and F, Quantification of tongue average muscle layer thickness for detecting fibrosis after irradiation with S-PRT/F-PRT. n = 5 for 28 days and n = 7 for 60 days, means compared using Welch t test. G and H, Representative images of the micro CT scan of jaw bones showing ABL 60 days after irradiation with 16 Gy and 90 days after irradiation with 8 Gy × 3 of either S-PRT/F-PRT, respectively. I and J, Blinded quantification of the mouse jaw ABL after irradiation with a single dose of 16 Gy and fractionation dose of 8 Gy ×3 either with S-PRT/F-PRT, respectively; n = 6 per group for single dose and n = 10 for fractionation dose. Mean differences between groups assessed by Welch t test.
Figure 5.
F-PRT alleviates radiation-induced damage to the oral cavity compared with S-PRT. A, Representative images of H&E-stained longitudinal sections of the tongue 28 days after irradiation with 16 Gy of PRT. 400X magnification, scale bar, 20 μm. B, Blinded quantification of tongue lingual gland atrophy score in stained H&E slides 28 days after irradiation with 16 Gy of PRT. NR, n = 4; S-PRT and F-PRT, n = 5, difference between groups assessed by Mann–Whitney test. C and E, Representative images of Mason Trichrome staining of tongue epithelium (indicated by yellow arrow) for the detection of fibrosis 28 and 60 days after irradiation with 16 Gy of S-PRT/F-PRT. 200X magnification, scale bar, 200 μm. D and F, Quantification of tongue average muscle layer thickness for detecting fibrosis after irradiation with S-PRT/F-PRT. n = 5 for 28 days and n = 7 for 60 days, means compared using Welch t test. G and H, Representative images of the micro CT scan of jaw bones showing ABL 60 days after irradiation with 16 Gy and 90 days after irradiation with 8 Gy × 3 of either S-PRT/F-PRT, respectively. I and J, Blinded quantification of the mouse jaw ABL after irradiation with a single dose of 16 Gy and fractionation dose of 8 Gy ×3 either with S-PRT/F-PRT, respectively; n = 6 per group for single dose and n = 10 for fractionation dose. Mean differences between groups assessed by Welch t test.
Figure 6. F-PRT increases overall survival in an orthotopic head and neck tumor model. A, Schematic representation of the orthotopic tongue tumor implantation with MOC2 cell line. B, Kaplan–Meier survival curve following a dose-escalation study of irradiated mice with orthotopic tongue tumors with 14, 16, and 18 Gy of S-PRT and F-PRT; n = 15, survival compared using a log-rank test. Events recorded mortality or euthanasia if they demonstrated signs of distress, were moribund, or if their weight decreased by 20% of the initial body weight. C, Representative images of H&E-stained longitudinal sections of the tongue with tumors harvested 15 days after implantation in mice, showing the area of tumor in the tongue tissues in the unirradiated or irradiated with S-PRT/F-PRT. The yellow dotted line in the representative images represents the tumor area, and the red dotted line represents the necrotic area. D and E, Blinded evaluation of average tumor area and the ratio of tumor to the tongue area; NR (n = 10), S-PRT (n = 15), and F-PRT (n = 15), means compared using Welch t test.
Figure 6.
F-PRT increases overall survival in an orthotopic head and neck tumor model. A, Schematic representation of the orthotopic tongue tumor implantation with MOC2 cell line. B, Kaplan–Meier survival curve following a dose-escalation study of irradiated mice with orthotopic tongue tumors with 14, 16, and 18 Gy of S-PRT and F-PRT; n = 15, survival compared using a log-rank test. Events recorded mortality or euthanasia if they demonstrated signs of distress, were moribund, or if their weight decreased by 20% of the initial body weight. C, Representative images of H&E-stained longitudinal sections of the tongue with tumors harvested 15 days after implantation in mice, showing the area of tumor in the tongue tissues in the unirradiated or irradiated with S-PRT/F-PRT. The yellow dotted line in the representative images represents the tumor area, and the red dotted line represents the necrotic area. D and E, Blinded evaluation of average tumor area and the ratio of tumor to the tongue area; NR (n = 10), S-PRT (n = 15), and F-PRT (n = 15), means compared using Welch t test.

Similar articles

Cited by

References

    1. Cramer JD, Burtness B, Le QT, Ferris RL. The changing therapeutic landscape of head and neck cancer. Nat Rev Clin Oncol 2019;16:669–83. - PubMed
    1. Johnson DE, Burtness B, Leemans CR, Lui VWY, Bauman JE, Grandis JR, et al. . Head and neck squamous cell carcinoma. Nat Rev 2020;6:92. - PMC - PubMed
    1. Porceddu SV, Haddad RI. Management of elderly patients with locoregionally confined head and neck cancer. Lancet Oncol 2017;18:e274–e83. - PubMed
    1. Pinna R, Campus G, Cumbo E, Mura I, Milia E. Xerostomia induced by radiotherapy: an overview of the physiopathology, clinical evidence, and management of the oral damage. Ther Clin Risk Manag 2015;11:171–88. - PMC - PubMed
    1. Maria OM, Eliopoulus N, Muanza T. Radiation-induced oral mucositis. Front Oncol 2017;7:89. - PMC - PubMed