. 2024 Apr 18;128(15):3585-3597.
doi: 10.1021/acs.jpcb.4c00174. Epub 2024 Apr 9.

RASP: Optimal Single Puncta Detection in Complex Cellular Backgrounds

Affiliations

RASP: Optimal Single Puncta Detection in Complex Cellular Backgrounds

Bin Fu et al. J Phys Chem B. .

Abstract

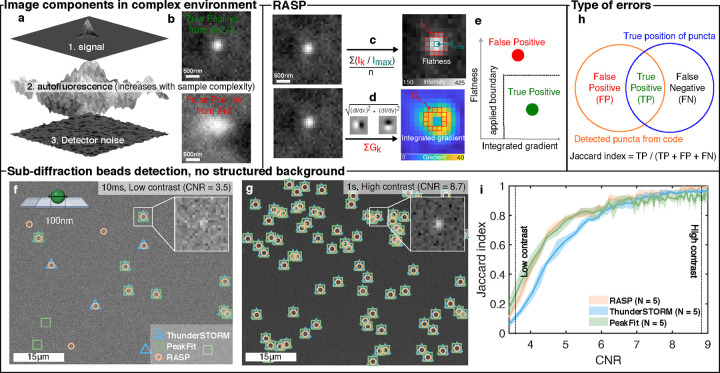
Super-resolution and single-molecule microscopies have been increasingly applied to complex biological systems. A major challenge of these approaches is that fluorescent puncta must be detected in the low signal, high noise, heterogeneous background environments of cells and tissue. We present RASP, Radiality Analysis of Single Puncta, a bioimaging-segmentation method that solves this problem. RASP removes false-positive puncta that other analysis methods detect and detects features over a broad range of spatial scales: from single proteins to complex cell phenotypes. RASP outperforms the state-of-the-art methods in precision and speed using image gradients to separate Gaussian-shaped objects from the background. We demonstrate RASP's power by showing that it can extract spatial correlations between microglia, neurons, and α-synuclein oligomers in the human brain. This sensitive, computationally efficient approach enables fluorescent puncta and cellular features to be distinguished in cellular and tissue environments, with sensitivity down to the level of the single protein. Python and MATLAB codes, enabling users to perform this RASP analysis on their own data, are provided as Supporting Information and links to third-party repositories.


Conflict of interest statement

The authors declare no competing financial interest.

Figures

Figure 1
Figure 1
RASP enables accurate fluorescent puncta detection beyond the state-of-the-art. (a) Illustration of a conventional feature detection strategy composed of a feature enhancement step, e.g., a Difference-of-Gaussians filter, to accentuate the differences between the desired feature signal and background, and a thresholding step, such as Otsu’s method, that converts a feature-enhanced image to a binary mask. (b) In the presence of structured background, objects below the diffraction limit cannot be precisely detected by conventional feature detection strategies. RASP, an added selection step, distinguishes symmetric puncta, thus eliminating false positives. Elements of this figure were created with BioRender.com.
Figure 2
Figure 2
RASP distinguishes puncta by flatness and integrated gradient. (a) Images of complex samples are composed of signal, detector noise, and autofluorescence, which reduces the detectability of the signal of interest. (b) The measured pixel intensities for true positives (TPs) are the summation of detector noise, autofluorescence, and signal, whereas false positives (FPs) arise from autofluorescence and detector noise only. (c) Pictorial representation of the flatness calculation procedure using eq 6. (d) Pictorial representation of the integrated gradient calculation procedure using eqs 9 and 10. (e) FPs and TPs plotted by their flatness and integrated gradient, separable by a decision boundary. (f,g) Images of 100 nm diameter fluorescent beads were recorded with differing exposure times to capture low (10 ms) and high (1 s) contrast-to-noise ratios. Peaks were identified using RASP, ThunderSTORM, and PeakFit. (h) Illustration of the possible error types: false positives (FPs) are points wrongly detected, and false negatives (FNs) are undetected correct points. (i) Jaccard index comparison of RASP, ThunderSTORM, and PeakFit for five different fields of view (FOVs) where the ground truth was determined from the highest CNR image. Elements of this figure were created with BioRender.com.
Figure 3
Figure 3
Implementation of RASP. (a) Detected puncta in a negative control FFPE brain tissue sample lacking primary antibodies but still containing secondary antibodies. (b) Flatness and integrated gradient values for the peaks in (a). (c) Determination of a decision boundary based on the flatness and integrated gradient for all detected puncta. (d) Filtered puncta within the decision boundary. (e) Negative control brain images with two zoomed-in regions. (f) Real brain images with added simulated diffraction-limited puncta (see the Methods section). (g) Scatter plot of all detected puncta in (f) with the decision boundary determined in (c). (h) Filtered detected puncta for the real brain image with added simulated puncta.
Figure 4
Figure 4
RASP outperforms traditional punctum detection in images with structured background. (a,d) Negative control FFPE brain slices imaged in widefield and confocal imaging modes, respectively, with two zoomed-in sections illustrating false positives from PeakFit, ThunderSTORM, and RASP. NB that these two different imaging modes correspond to two different microscopes. (b,e) α-Synuclein-antibody stained FFPE brain slice imaged in widefield and confocal imaging modes, respectively, with zoomed-in sections comparing the performance of PeakFit, ThunderSTORM, and RASP. (c,f) Jaccard index characterization for widefield imaging and confocal imaging modes, respectively, of PeakFit, ThunderSTORM, and RASP on real images of negative control FFPE brain slices with simulated puncta added. 136 real brain images with simulated puncta added were used for the characterization of each of the widefield and confocal imaging modes. Elements of this figure were created with BioRender.com.
Figure 5
Figure 5
Correlation analysis between cell and fluorescent puncta. (a) ICR calculation between cells and detected puncta, i.e., the number of inside locations divided by the total number of locations. (b) ICR between cells and a random spatial distribution of puncta, referred to here as CSR data. The number of puncta is chosen as identical to the number in real data. (c) Formula for calculating the colocalization likelihood between cells and puncta, where we compare the ratio of puncta found inside cells to what would be expected if puncta were distributed uniformly—the fraction of the image occupied by cells. The colocalization likelihoods of CSR data should converge to 1 if enough locations have been sampled. These data are then used to calculate the error bound on the colocalization likelihoods. (d,i) Overlapping detected neurons and microglia locations, respectively, with the original image. (e,j) Detected puncta locations in the original image. (f,k) Inside puncta (red) and outside puncta (yellow) based on cell locations. (g,l) Colocalization likelihood distribution with 20 FOVs used. (h,m) Colocalization likelihood distribution with 20,000 FOVs used. Elements of this figure were created with BioRender.com.

References

    1. Moon S.; Yan R.; Kenny S. J.; Shyu Y.; Xiang L.; Li W.; Xu K. Spectrally Resolved, Functional Super-Resolution Microscopy Reveals Nanoscale Compositional Heterogeneity in Live-Cell Membranes. J. Am. Chem. Soc. 2017, 139, 10944–10947. 10.1021/jacs.7b03846. - DOI - PubMed
    1. Deguchi T.; Iwanski M. K.; Schentarra E.-M.; Heidebrecht C.; Schmidt L.; Heck J.; Weihs T.; Schnorrenberg S.; Hoess P.; Liu S.; et al. Direct Observation of Motor Protein Stepping in Living Cells Using MINFLUX. Science 2023, 379, 1010–1015. 10.1126/science.ade2676. - DOI - PMC - PubMed
    1. Reinhardt S. C. M.; Masullo L. A.; Baudrexel I.; Steen P. R.; Kowalewski R.; Eklund A. S.; Strauss S.; Unterauer E. M.; Schlichthaerle T.; Strauss M. T.; et al. Ångström-Resolution Fluorescence Microscopy. Nature 2023, 617, 711–716. 10.1038/s41586-023-05925-9. - DOI - PMC - PubMed
    1. Safieddine A.; Coleno E.; Lionneton F.; Traboulsi A.-M.; Salloum S.; Lecellier C.-H.; Gostan T.; Georget V.; Hassen-Khodja C.; Imbert A.; et al. HT-smFISH: A Cost-Effective and Flexible Workflow for High-Throughput Single-Molecule RNA Imaging. Nat. Protoc. 2023, 18, 157–187. 10.1038/s41596-022-00750-2. - DOI - PubMed
    1. Sunkin S. M.; Ng L.; Lau C.; Dolbeare T.; Gilbert T. L.; Thompson C. L.; Hawrylycz M.; Dang C. Allen Brain Atlas: An Integrated Spatio-Temporal Portal for Exploring the Central Nervous System. Nucleic Acids Res. 2013, 41, D996–D1008. 10.1093/nar/gks1042. - DOI - PMC - PubMed

Publication types