

Combined BRAF and PIM1 inhibitory therapy for papillary thyroid carcinoma based on BRAFV600E regulation of PIM1: Synergistic effect and metabolic mechanisms
- PMID: 38593698
- PMCID: PMC11007432
- DOI: 10.1016/j.neo.2024.100996
Combined BRAF and PIM1 inhibitory therapy for papillary thyroid carcinoma based on BRAFV600E regulation of PIM1: Synergistic effect and metabolic mechanisms
Abstract
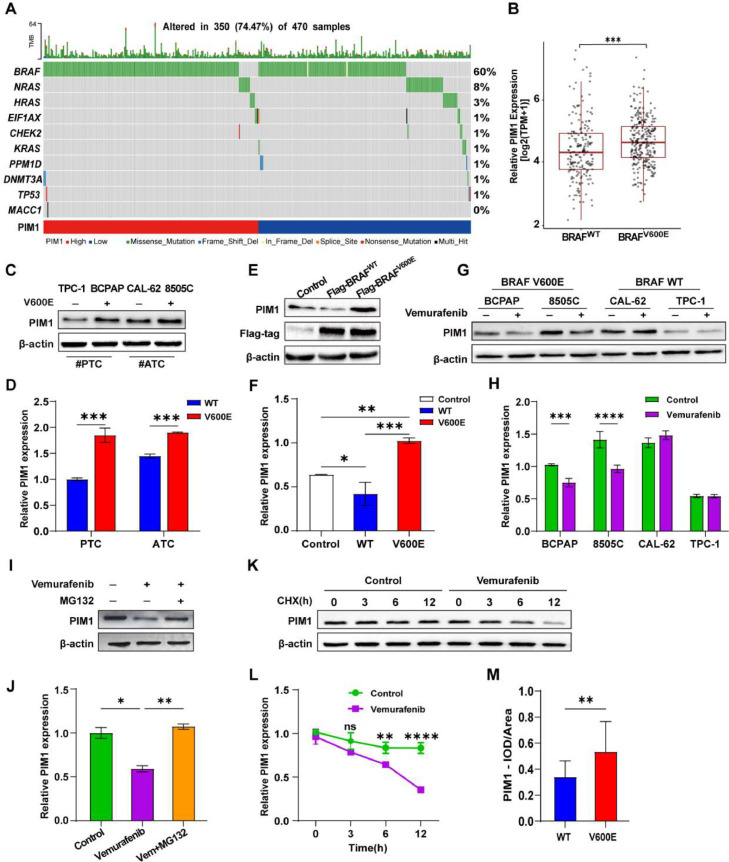
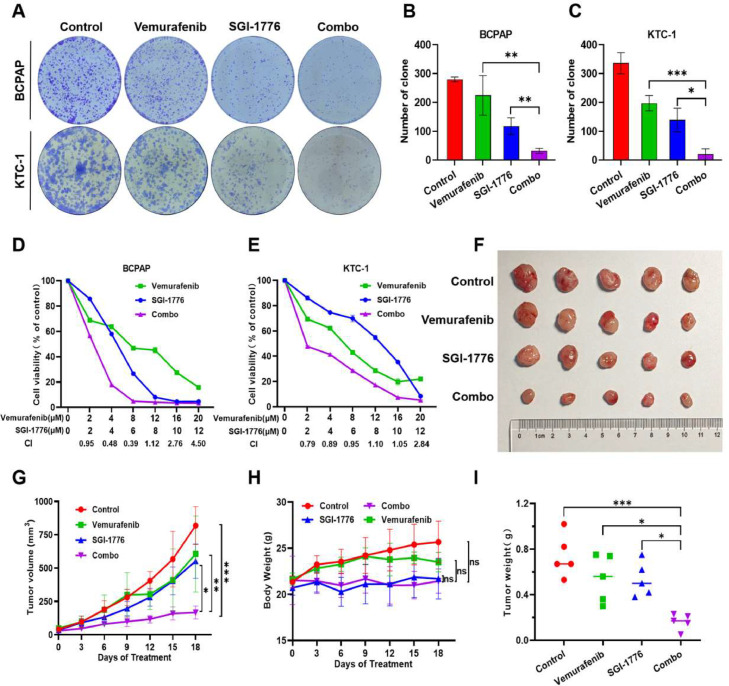
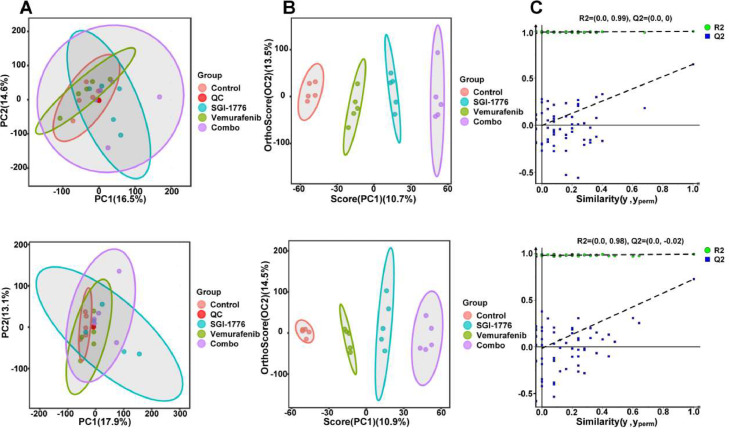
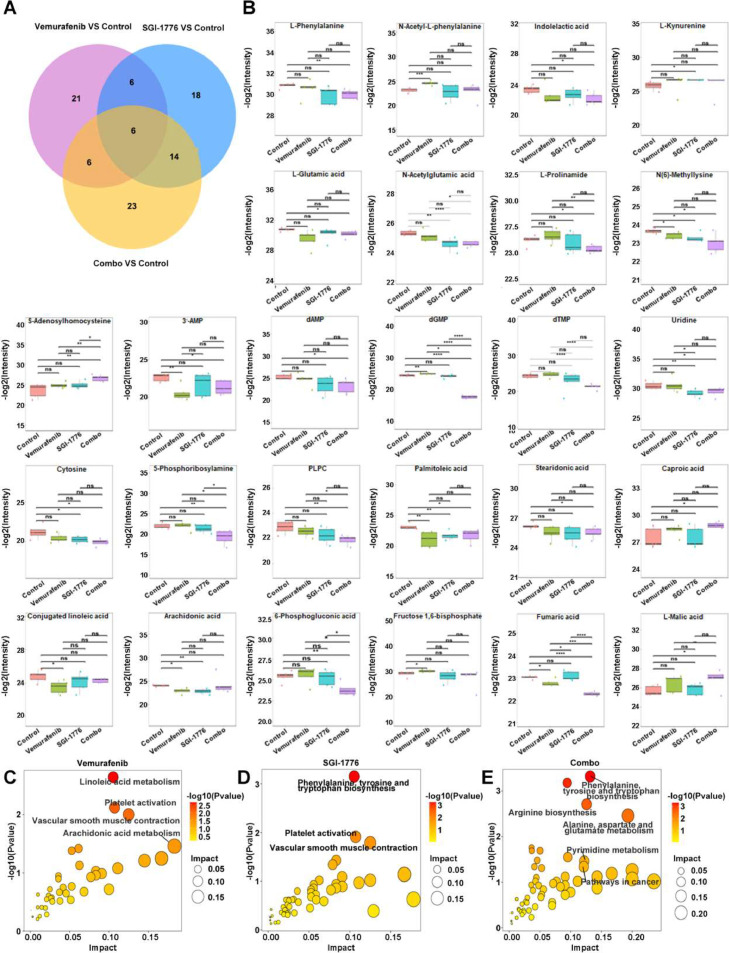
Papillary thyroid carcinoma (PTC) is the most common endocrine malignancy, and its incidence has increased rapidly in recent years. The BRAF inhibitor vemurafenib is effective against BRAFV600E-positive PTC; however, acquired resistance to single agent therapy frequently leads to tumor recurrence and metastasis, underscoring the need to develop tailored treatment strategies. We previously showed that the oncogenic kinase PIM1 was associated with the malignant phenotype and prognosis of PTC. In this study, we showed that sustained expression of the PIM1 protein in PTC was affected by the BRAFV600E mutation. Based on this regulatory mechanism, we tested the synergistic effects of inhibitors of BRAF (BRAFi) and PIM1 in BRAFV600E-positive PTC cell lines and xenograft tumors. LC-MS metabolomics analyses suggested that BRAFi/PIMi therapy acted by restricting the amounts of critical amino acids and nucleotides required by cancer cells as well as modulating DNA methylation. This study elucidates the role of BRAFV600E in the regulation of PIM1 in PTC and demonstrates the synergistic effect of a novel combination, BRAFi/PIMi, for the treatment of PTC. This discovery, along with the pathways that may be involved in the powerful efficacy of BRAFi/PIMi strategy from the perspective of cell metabolism, provides insight into the molecular basis of PTC progression and offers new perspectives for BRAF-resistant PTC treatment.
Keywords: BRAFV600E; Metabolomics; PIM1; Synergism; Thyroid carcinoma.
Copyright © 2024 The Authors. Published by Elsevier Inc. All rights reserved.
Conflict of interest statement
Declaration of competing interest The authors declare that they have no known competing financial interests or personal relationships that could have appeared to influence the work reported in this paper.
Figures
Similar articles
-
Inhibition of BRAF Sensitizes Thyroid Carcinoma to Immunotherapy by Enhancing tsMHCII-mediated Immune Recognition.J Clin Endocrinol Metab. 2021 Jan 1;106(1):91-107. doi: 10.1210/clinem/dgaa656. J Clin Endocrinol Metab. 2021. PMID: 32936899
-
Fine-Tuning Lipid Metabolism by Targeting Mitochondria-Associated Acetyl-CoA-Carboxylase 2 in BRAFV600E Papillary Thyroid Carcinoma.Thyroid. 2021 Sep;31(9):1335-1358. doi: 10.1089/thy.2020.0311. Epub 2021 Mar 3. Thyroid. 2021. PMID: 33107403 Free PMC article.
-
The MEK1/2 Inhibitor AZD6244 Sensitizes BRAF-Mutant Thyroid Cancer to Vemurafenib.Med Sci Monit. 2018 May 8;24:3002-3010. doi: 10.12659/MSM.910084. Med Sci Monit. 2018. Retraction in: Med Sci Monit. 2022 Mar 07;28:e936571. doi: 10.12659/MSM.936571. PMID: 29737325 Free PMC article. Retracted.
-
Targeting of the BRAF gene in papillary thyroid carcinoma (review).Oncol Rep. 2009 Oct;22(4):671-81. doi: 10.3892/or_00000487. Oncol Rep. 2009. PMID: 19724843 Review.
-
BRAF mutation in papillary thyroid cancer: pathogenic role, molecular bases, and clinical implications.Endocr Rev. 2007 Dec;28(7):742-62. doi: 10.1210/er.2007-0007. Epub 2007 Oct 16. Endocr Rev. 2007. PMID: 17940185 Review.
Cited by
-
Emerging Potential of Metabolomics in Thyroid Cancer-A Comprehensive Review.Cancers (Basel). 2025 Mar 18;17(6):1017. doi: 10.3390/cancers17061017. Cancers (Basel). 2025. PMID: 40149351 Free PMC article. Review.
-
Reprogramming of Thyroid Cancer Metabolism: from Mechanism to Therapeutic Strategy.Mol Cancer. 2025 Mar 11;24(1):74. doi: 10.1186/s12943-025-02263-4. Mol Cancer. 2025. PMID: 40069775 Free PMC article. Review.
References
Publication types
MeSH terms
Substances
LinkOut - more resources
Full Text Sources
Medical
Research Materials
