. 2024 Apr 16;5(4):101504.
doi: 10.1016/j.xcrm.2024.101504. Epub 2024 Apr 8.

Pharmacological induction of chromatin remodeling drives chemosensitization in triple-negative breast cancer

Affiliations

Pharmacological induction of chromatin remodeling drives chemosensitization in triple-negative breast cancer

Meisam Bagheri et al. Cell Rep Med. .

Abstract

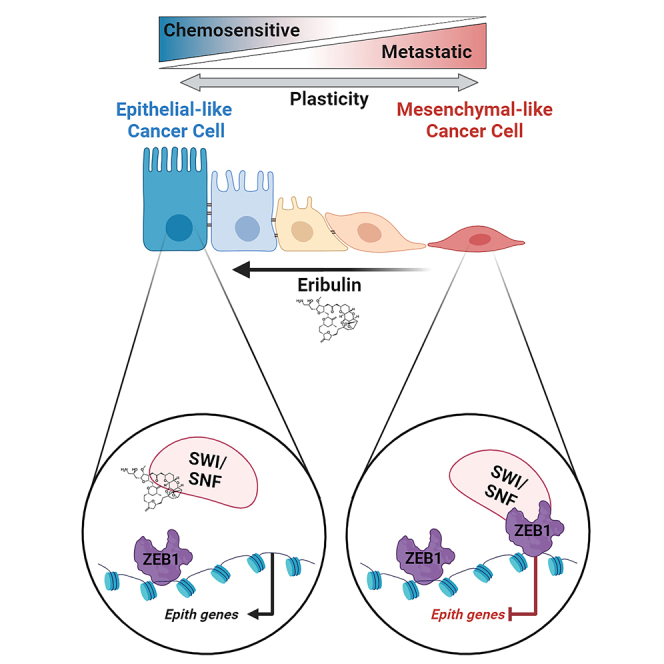
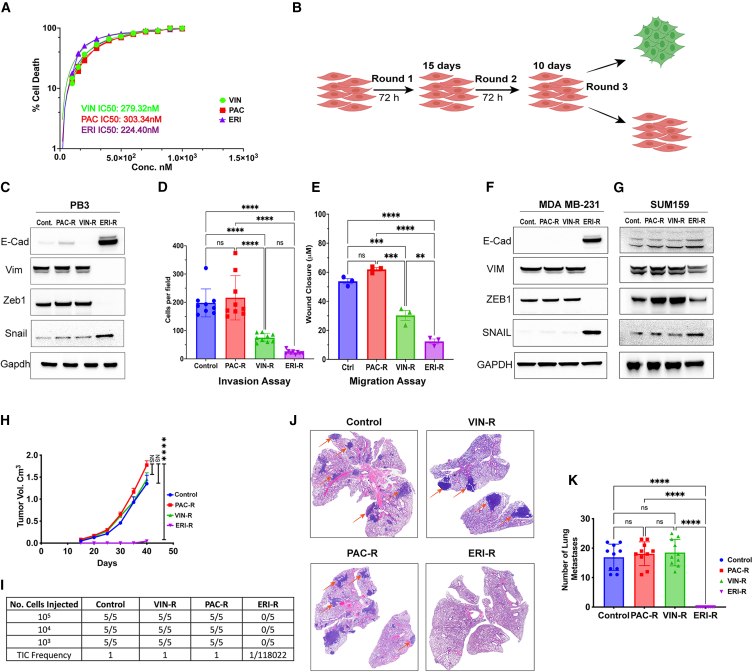
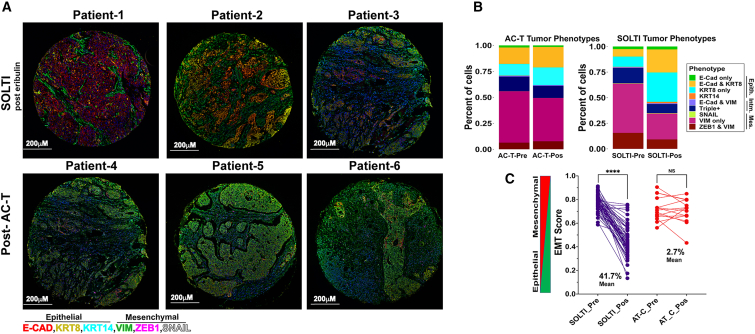
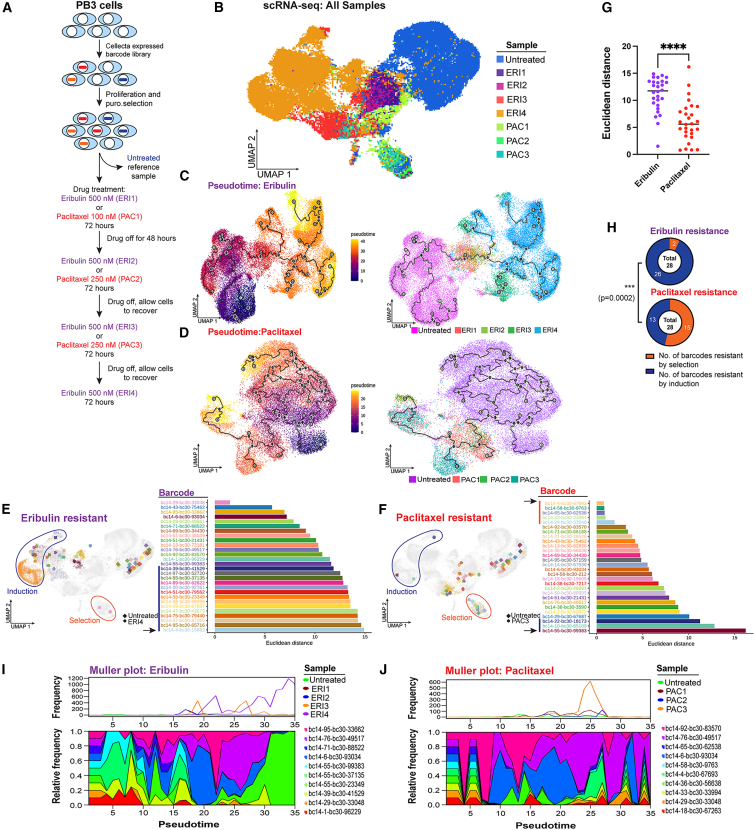
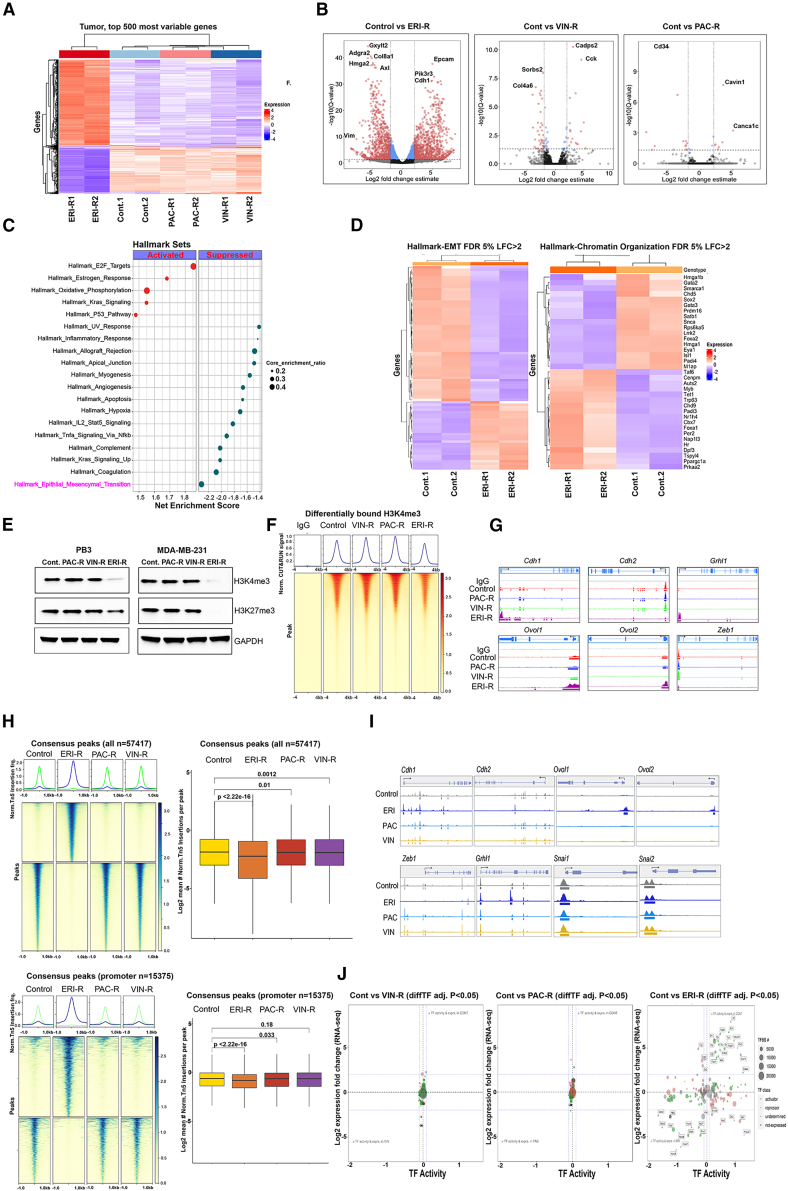
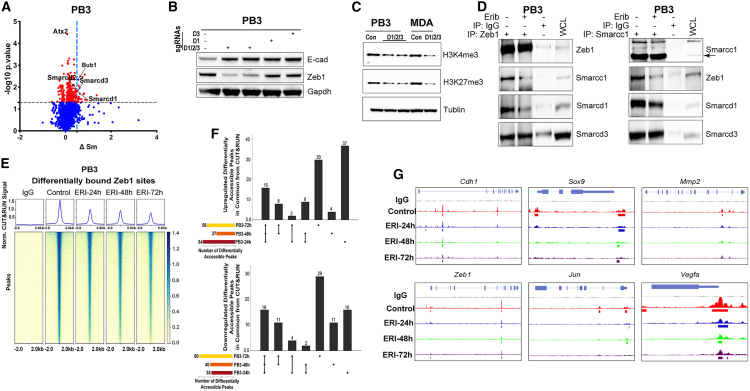
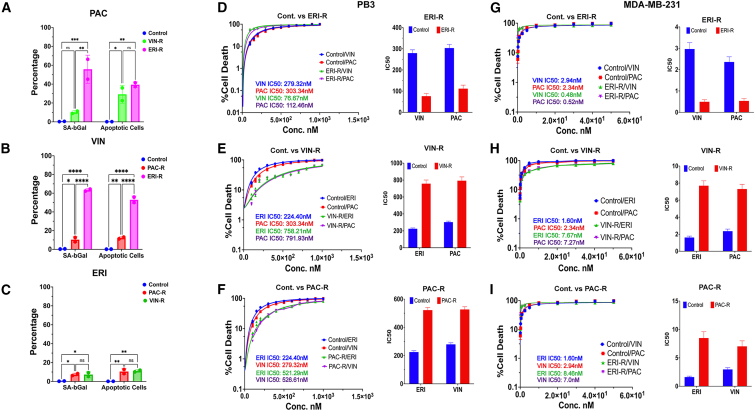
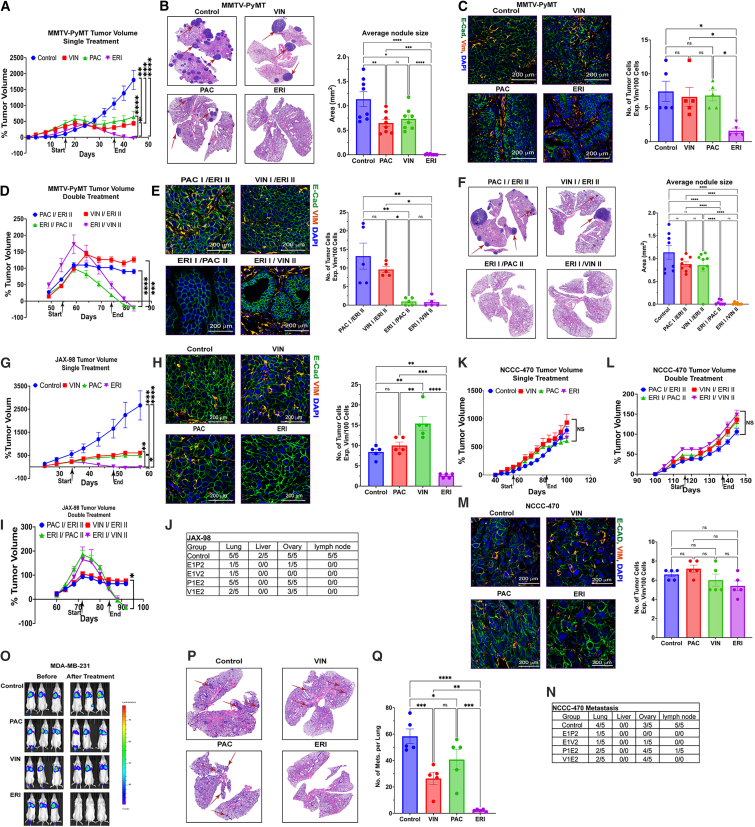
Targeted therapies have improved outcomes for certain cancer subtypes, but cytotoxic chemotherapy remains a mainstay for triple-negative breast cancer (TNBC). The epithelial-to-mesenchymal transition (EMT) is a developmental program co-opted by cancer cells that promotes metastasis and chemoresistance. There are no therapeutic strategies specifically targeting mesenchymal-like cancer cells. We report that the US Food and Drug Administration (FDA)-approved chemotherapeutic eribulin induces ZEB1-SWI/SNF-directed chromatin remodeling to reverse EMT that curtails the metastatic propensity of TNBC preclinical models. Eribulin induces mesenchymal-to-epithelial transition (MET) in primary TNBC in patients, but conventional chemotherapy does not. In the treatment-naive setting, but not after acquired resistance to other agents, eribulin sensitizes TNBC cells to subsequent treatment with other chemotherapeutics. These findings provide an epigenetic mechanism of action of eribulin, supporting its use early in the disease process for MET induction to prevent metastatic progression and chemoresistance. These findings warrant prospective clinical evaluation of the chemosensitizing effects of eribulin in the treatment-naive setting.

Keywords: EMT; breast cancer; chemotherapy; drug resistance; epigenetic; epithelial-to-mesenchymal transition; mesenchymal-to-epithelial transition; metastasis.


Conflict of interest statement

Declaration of interests M.A.M.S. is an employee of Lifebytes India Pvt. Ltd. D.R.P. received research funding from Eisai Pharmaceutical Ltd.

Figures

None
Graphical abstract
Figure 1
Figure 1
Eribulin induces MET in TNBC cells (A) Dose-response curves in PB3 cells were generated to calculate IC50 values for eribulin, paclitaxel, and vinorelbine. (B) Schematic of the multiround drug treatment procedure that resulted in the generation of drug-resistant cells. (C–G) Estimation of EMT state was carried out by immunoblotting (C, F, and G), Transwell invasion assay 8 h post-seeding (D), and wound closure assay 16 h post seeding (E). Data are shown as mean of biological triplicates ± SD. (H–K) PB3 parental and drug-resistant cells were implanted orthotopically. In (H), tumor volumes were serially measured. Tumor-initiating capacity (TIC) was assessed by limiting dilution transplantation (I). In (J), metastatic ability was assessed in lungs harvested from mice in (H) and stained with H&E. Metastases were enumerated in (K). Data in (H and K) are shown as mean of 10 mice ± SD. ∗∗p ≤ 0.01, ∗∗∗p ≤ 0.001, ∗∗∗∗p ≤ 0.0001; ns, not significant by Tukey-adjusted pairwise comparison.
Figure 2
Figure 2
Eribulin promotes MET in human TNBC Multiplexed, multiround TSA staining of EMT markers was performed in TNBC specimens acquired from patients before and after neoadjuvant treatment with eribulin or AC-T. (A) Representative images. (B) Proportions of tumor cells expressing markers of EMT phenotypes. (C) EMT scores of tumors. ∗∗∗∗p < 0.0001; ns, not significant by Tukey-adjusted pairwise comparison.
Figure 3
Figure 3
Clonal dynamics following drug treatment (A) Schematic outlining genetic barcoding of cells and subsequent drug treatment strategy. (B) UMAP projection of scRNA-seq data obtained from PB3 cells before and after 1–4 rounds of treatment with eribulin or paclitaxel. (C and D) Monocle pseudotime projection showing the trajectory of cancer cell evolution upon drug treatment. The main lineage path or master path/node is indicated by “1” in a white circle. Sublineages (leaf nodes) from the master path are indicated by numbers in gray circles. Branches from leaf nodes are indicated by numbers in black circles. Left and right: cells colored according to pseudotime and sample, respectively. (E–G) Euclidean distance between ERI4 vs. untreated cells (E) or PAC3 vs. untreated cells (F), with the same barcode are shown in swimmer plots, and UMAPs represent median points of ERI4 or PAC3 and untreated cells. ∗∗∗∗p < 0.0001 by Mann-Whitney U test. (H) Proportions of induction vs. selection resistance for ERI and PAC treatments were compared by chi-square test. (I and J) Muller plots outlining clonal diversity of the 10 most abundant barcodes following drug treatment.
Figure 4
Figure 4
Eribulin induces a shift in transcriptional and chromatin profiles of TNBC cells (A–D) PB3 parental and drug-resistant cells were analyzed by bulk RNA-seq in biological duplicates. In (A), a heatmap shows the top 500 most differentially expressed genes. Genes significantly altered in drug-resistant cells vs. parental controls (log2-fold-change indicates mean expression level; Benjamini-Hochberg-corrected p value threshold = 0.01) are highlighted in volcano plots in (B). A dot plot outlining enrichment of hallmark gene sets in ERI-R vs. control cells is shown in (C); circle size depicts pathway significance, and red and blue dots indicate activated and suppressed pathways, respectively. Shown in (D) is a heatmap of EMT and chromatin organization genes in hallmark gene sets. (E) Immunoblot of lysates from PB3 and MDA-MB-231 parental and drug-resistant cells. (F) Top: average CUT&RUN enrichment profile of H3K4me3 in PB3 control and drug-resistant cells. Bottom: heatmap of CUT&RUN signal ±4 kb of peaks. (G) H3K4me3 localization at genomic loci of canonical EMT genes as evaluated by CUT&RUN signal track analysis. (H and I) Bulk ATAC-seq was performed in PB3 parental and drug-resistant cells. Peak accessibility surrounding all consensus regions (H, top), promoter-associated regions (H, bottom), and EMT marker genes (I) is shown. (J) ATAC-seq and RNA-seq integration analysis. Shown are advanced volcano plots of highly significant transcription factors (TFs) as determined by DiffTF from ATAC-seq (x axis) and log2fold change in gene expression of TFs (y axis). TF classification is indicated by circle color. The number of TF binding sites used to determine TF activity is indicated by circle size.
Figure 5
Figure 5
ZEB1-SWI/SNF interactions are necessary for maintenance of a mesenchymal state (A) PB3 cells treated with or without 300 nM eribulin for 4 h were analyzed by PISA assay. Proteins were plotted by ΔSm and −log10p (t test). (B and C) Immunoblot analysis of cells with CRISPR-Cas9-mediated deletion of SmarcD1 (D1), SmarcD3 (D3), or SmarcD1/2/3. (D) Zeb1 and Smarcc1 immunoprecipitates and lysates from cells treated with or without eribulin for 48 h. (E–G) Genome-wide occupancy of Zeb1 in PB3 cells treated with or without eribulin for 24, 48, or 72 h was evaluated using CUT&RUN. In (E), average CUT&RUN enrichment profiles (top) and heatmap of the CUT&RUN signal ±2 kb of peaks (bottom) are shown. Shown in (F) are UpSet plots of differentially accessible peaks at the indicated time points as mean ± SEM. Signal tracks of Zeb1 localization at target gene loci are shown in (G).
Figure 6
Figure 6
Eribulin pre-treatment induces sensitization to subsequent chemotherapy (A–C) Senescence-associated β-galactosidase assay and quantification of apoptotic cells. PB3 parental and drug-resistant cells were used as indicated and treated with paclitaxel (A), vinorelbine (B), or eribulin (C). Data are shown as mean of duplicates ± SEM. (D–F) PB3 parental and drug-resistant cells were used to generate dose-response curves to determine IC50. (G–I) MDA-MB-231 parental and drug-resistant cells were treated as in (D)–(F). Data are shown as mean of triplicates ± SEM.
Figure 7
Figure 7
MET induction is accompanied by robust tumor regression and reduced metastatic burden (A–C) MMTV-PyMT tumor-bearing female mice were treated with vehicle, paclitaxel (20 mg/kg), vinorelbine (7 mg/kg), or eribulin (1.6 mg/kg) twice weekly to assess (A) tumor growth rate, (B) tumor metastasis to the lungs (red arrows), and (C) EMT status using immunofluorescence of E-cad (green) and vimentin (red). Tumors and lungs were harvested after 2 weeks of drug treatment and a 1-week drug holiday. (D–F) MMTV-PyMT mice were treated as in (A), and palpable mammary tumors were surgically resected. After a 2-week drug holiday, mice were treated with a second round of therapy to assess tumor growth rate (D), EMT status (E), and tumor metastasis to lungs (F). Tumors and lungs were harvested after a 1-week drug holiday. (G–N) NSG female mice bearing bilaterally implanted JAX-98naive or NCCC-470NAC orthotopic tumors were treated and assayed as in (A)–(F). After a 2-week treatment regimen (G and K), one tumor was resected from each mouse for molecular analysis (H and M). Mice were then maintained until an orthotopic tumor resumed growth and treated with a second round of therapy to assess tumor growth rate (I and L). Mice were maintained for an additional 3 months prior to tissue harvest to evaluate metastasis (J and N). (O–Q) MDA-MB-231/Luc-ZsGreen cells were injected into the tail vein. Tumor burden was measured by bioluminescence imaging 2 weeks post injection (baseline) and after 2 weeks of drug treatment. Lung metastatic burden was quantified by counting metastases in H&E-stained sections. Tumor volumes are shown as mean of 5 mice/group ± SEM. ∗p < 0.05, ∗∗p < 0.001, ∗∗∗p < 0.0005, ∗∗∗∗p < 0.0001 by Tukey-adjusted pairwise comparison.

Similar articles

Cited by

References

    1. Nieto M.A., Huang R.Y.J., Jackson R.A., Thiery J.P. Emt: 2016. Cell. 2016;166:21–45. doi: 10.1016/j.cell.2016.06.028. - DOI - PubMed
    1. Shibue T., Weinberg R.A. EMT, CSCs, and drug resistance: the mechanistic link and clinical implications. Nat. Rev. Clin. Oncol. 2017;14:611–629. doi: 10.1038/nrclinonc.2017.44. - DOI - PMC - PubMed
    1. Cortes J., O'Shaughnessy J., Loesch D., Blum J.L., Vahdat L.T., Petrakova K., Chollet P., Manikas A., Diéras V., Delozier T., et al. Eribulin monotherapy versus treatment of physician's choice in patients with metastatic breast cancer (EMBRACE): a phase 3 open-label randomised study. Lancet. 2011;377:914–923. doi: 10.1016/S0140-6736(11)60070-6. - DOI - PubMed
    1. Smith J.A., Wilson L., Azarenko O., Zhu X., Lewis B.M., Littlefield B.A., Jordan M.A. Eribulin binds at microtubule ends to a single site on tubulin to suppress dynamic instability. Biochemistry. 2010;49:1331–1337. doi: 10.1021/bi901810u. - DOI - PMC - PubMed
    1. Yoshida T., Ozawa Y., Kimura T., Sato Y., Kuznetsov G., Xu S., Uesugi M., Agoulnik S., Taylor N., Funahashi Y., Matsui J. Eribulin mesilate suppresses experimental metastasis of breast cancer cells by reversing phenotype from epithelial-mesenchymal transition (EMT) to mesenchymal-epithelial transition (MET) states. Br. J. Cancer. 2014;110:1497–1505. doi: 10.1038/bjc.2014.80. - DOI - PMC - PubMed