. 2024 Apr 9;15(1):3064.
doi: 10.1038/s41467-024-47173-z.

Decoding spatiotemporal transcriptional dynamics and epithelial fibroblast crosstalk during gastroesophageal junction development through single cell analysis

Affiliations

Decoding spatiotemporal transcriptional dynamics and epithelial fibroblast crosstalk during gastroesophageal junction development through single cell analysis

Naveen Kumar et al. Nat Commun. .

Abstract

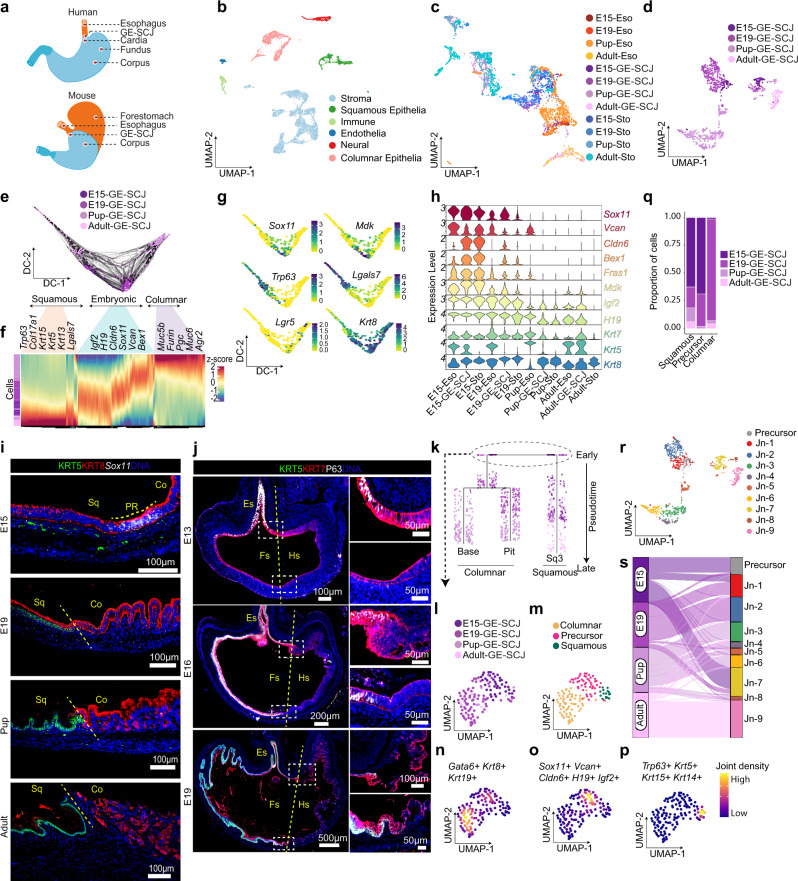
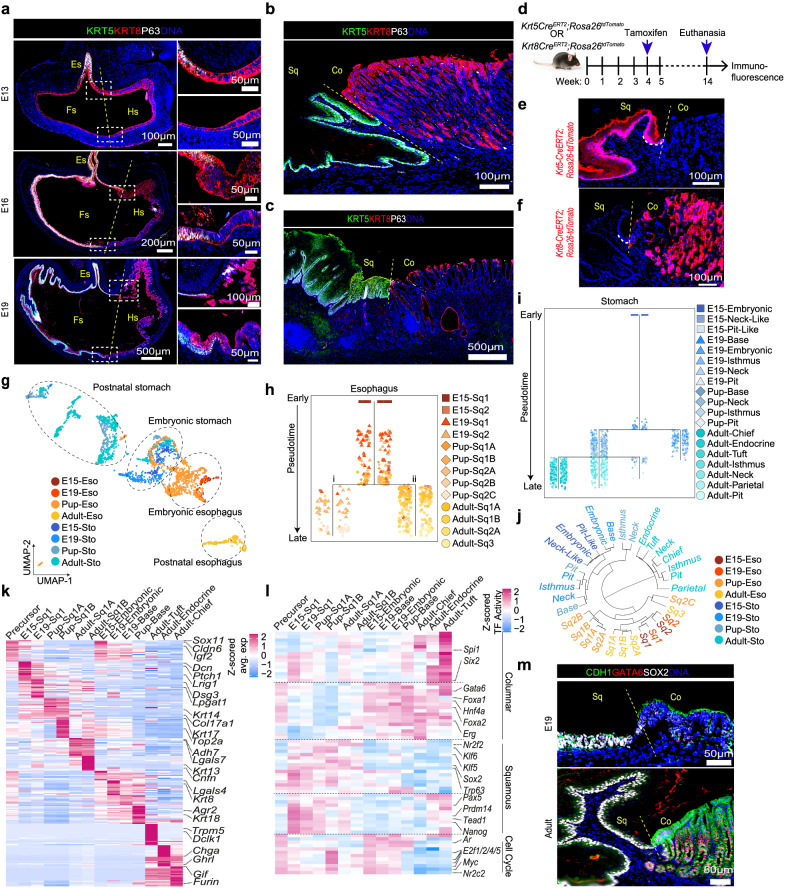
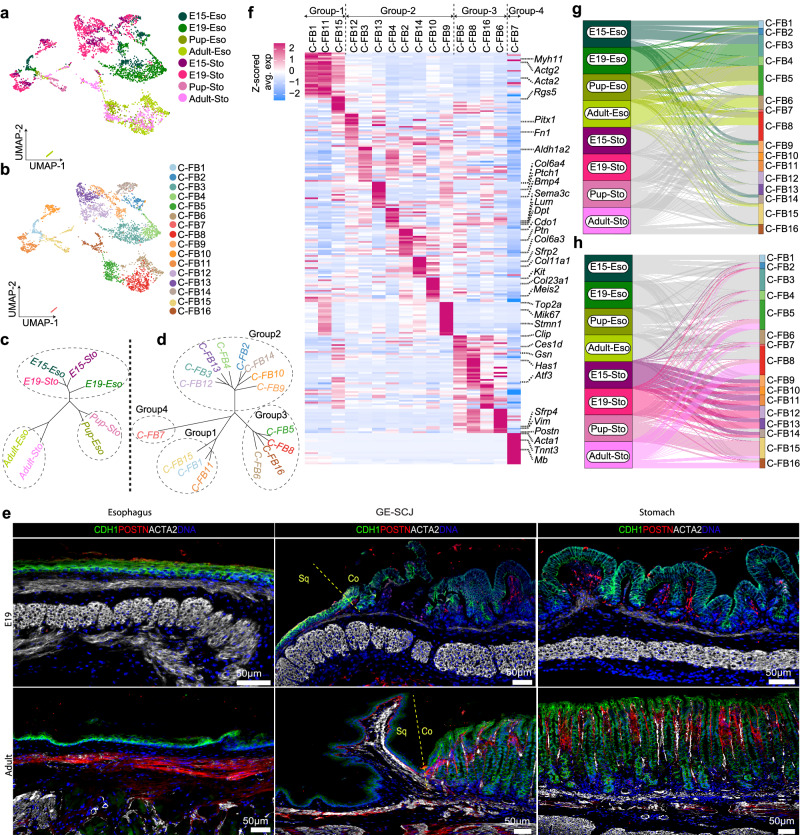
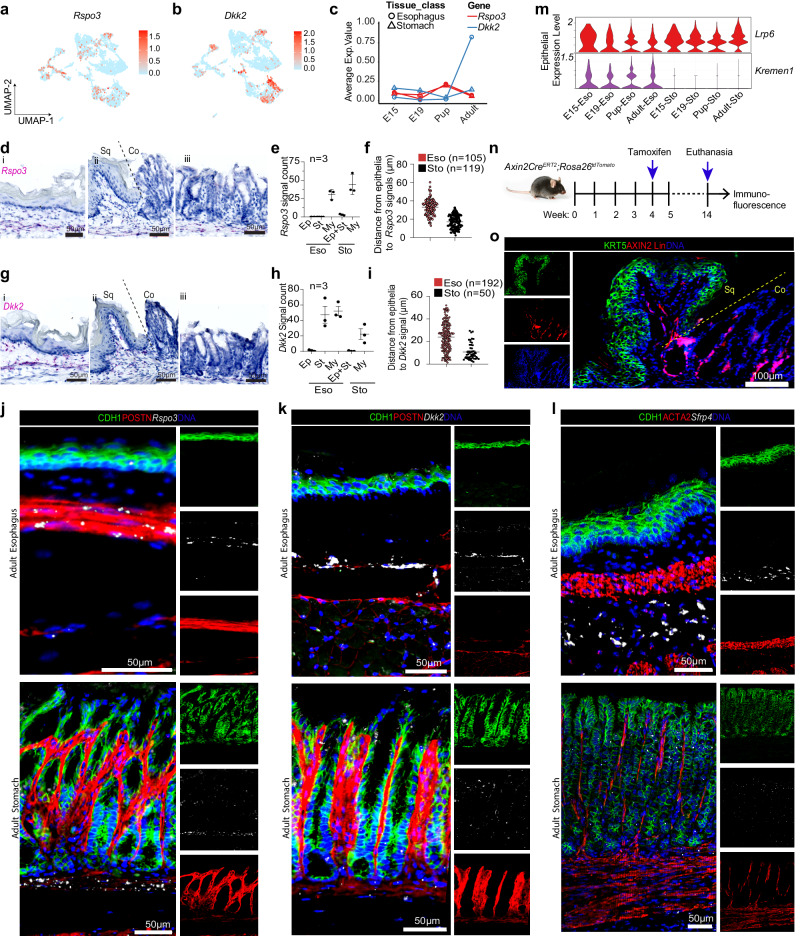
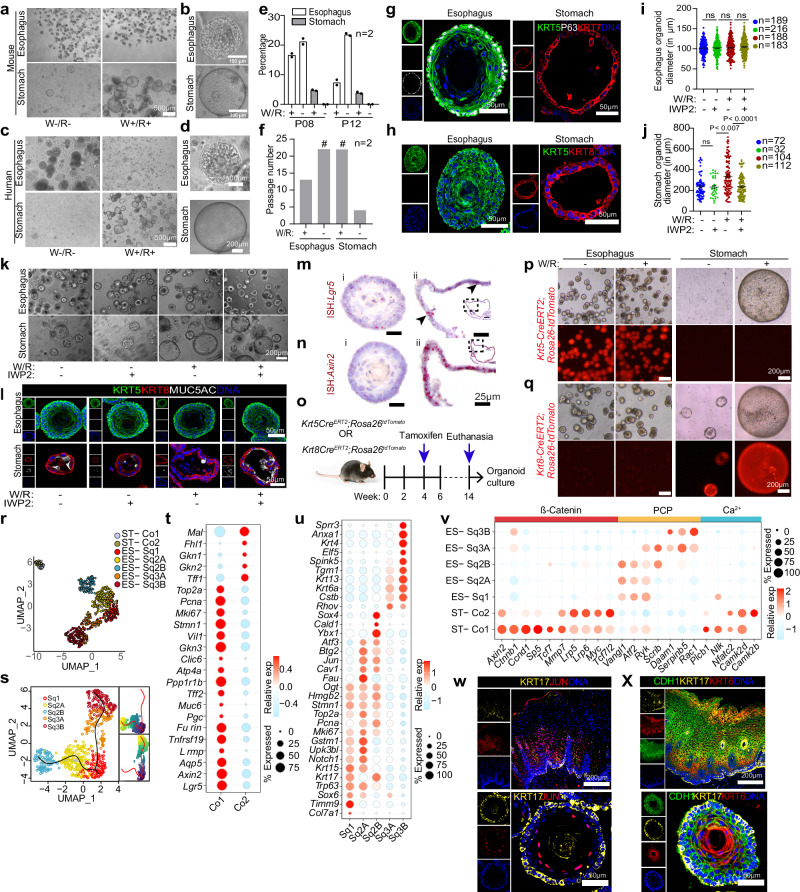
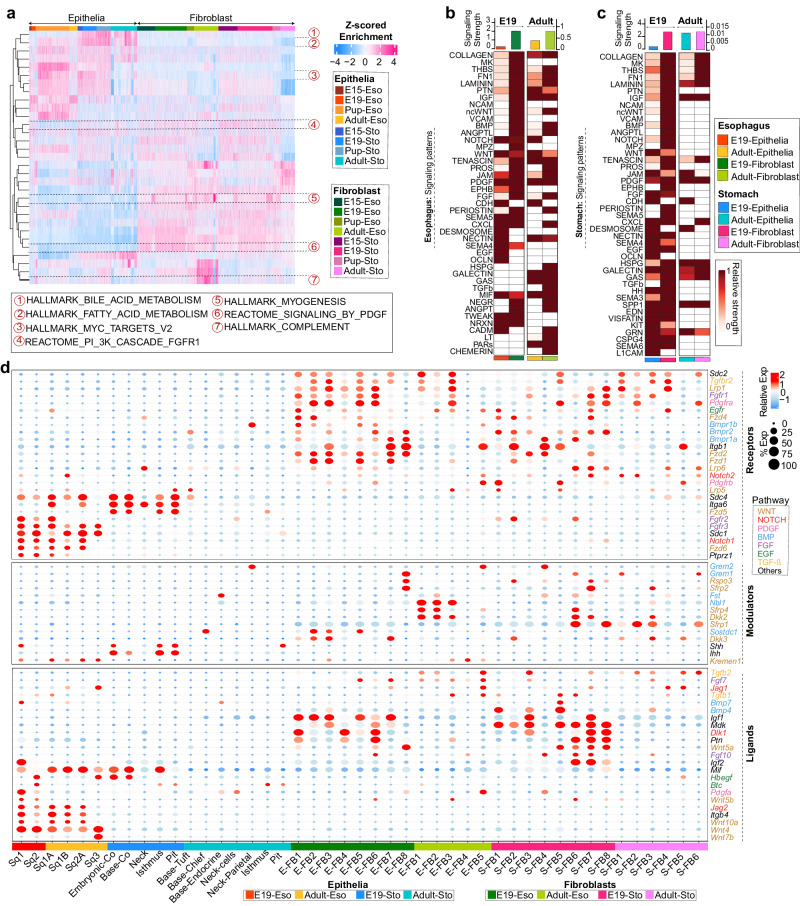
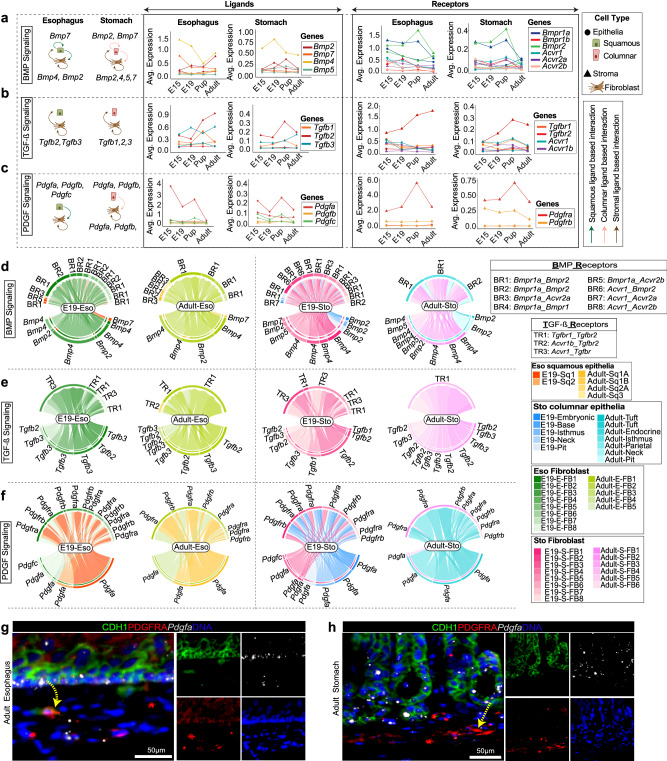
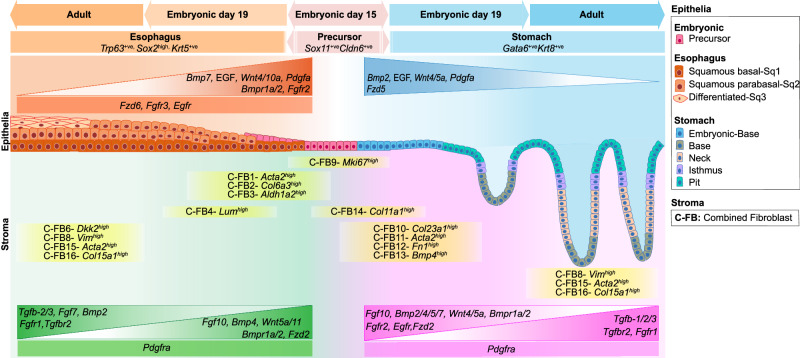
The gastroesophageal squamocolumnar junction (GE-SCJ) is a critical tissue interface between the esophagus and stomach, with significant relevance in the pathophysiology of gastrointestinal diseases. Despite this, the molecular mechanisms underlying GE-SCJ development remain unclear. Using single-cell transcriptomics, organoids, and spatial analysis, we examine the cellular heterogeneity and spatiotemporal dynamics of GE-SCJ development from embryonic to adult mice. We identify distinct transcriptional states and signaling pathways in the epithelial and mesenchymal compartments of the esophagus and stomach during development. Fibroblast-epithelial interactions are mediated by various signaling pathways, including WNT, BMP, TGF-β, FGF, EGF, and PDGF. Our results suggest that fibroblasts predominantly send FGF and TGF-β signals to the epithelia, while epithelial cells mainly send PDGF and EGF signals to fibroblasts. We observe differences in the ligands and receptors involved in cell-cell communication between the esophagus and stomach. Our findings provide insights into the molecular mechanisms underlying GE-SCJ development and fibroblast-epithelial crosstalk involved, paving the way to elucidate mechanisms during adaptive metaplasia development and carcinogenesis.


Conflict of interest statement

The authors declare no competing interest.

Figures

Fig. 1
Fig. 1. Single-cell map of embryonic to adult epithelial cell type divergence at the GE-SCJ.
a Schematic of human and mouse adult esophagus and stomach anatomy, including GE-SCJ. b UMAP of scRNA-seq data of esophagus, GE-SCJ, and stomach from embryonic day 15 (E15), E19, pup, and adult mice showing six distinct cellular clusters; dots represent single cells, colored by cell types. c UMAP of epithelial cells, color-coded by tissue type and time point. d UMAP of GE-SCJ epithelial, colored by time point. e Diffusion map (DM) illustrates the branching differentiation of GE-SCJ epithelial cells. f Heatmap of differentially expressed genes (DEGs) across subclusters, with cells ordered by developmental trajectory as in (e). g Normalized expression of selected markers, visualized by DM projection as in (e). h Violin plots show expression levels of specific genes across tissues and stages. i smRNA-ISH and immunostaining images of mouse GE-SCJ with Sox11 (white), KRT5 (green), KRT8 (red), and nuclei (blue). j Immunostained images of the mouse stomach, including distal esophagus with KRT5 (green), KRT7 (Red), P63 (white), and nuclei (blue). Magnified view of the boxed GE-SCJ region (Right panel). Sq, Co, PR, Es, Fs, and Hs indicate squamous epithelia, columnar epithelia, precursor cell region, esophagus, forestomach, and hind stomach. Images are representative of three biological replicates in (ij). k Dendrogram from URD trajectory analysis of GE-SCJ epithelial cells; each dot represents a single cell, colored by time point. Cells are ordered based on pseudotime values, starting from early at the top to late at the bottom of the tree. l, m UMAP of re-clustered GE-SCJ epithelial subpopulation positive for all selected embryonic markers (Vcan, Igf2, Sox11, and H19), colored by time point (l) and lineage type (m). np Joint gene-weighted density estimation of columnar (n), precursor (o), and squamous (p) epithelia. q Bar plot of epithelial types relative proportion at GE-SCJ by time point. r UMAP showing epithelial subclusters in combined GE-SCJ cells from E15 to adult, colored by cluster. s Sankey plot representing the contribution of epithelial cells from each time point to the combined GE-SCJ epithelial subclusters, as shown in (r).
Fig. 2
Fig. 2. Single-cell data and lineage tracing unravel the evolution of regulatory features of GE-SCJ development.
ac Tiled images of the entire stomach, including distal esophagus of E13, E16, and E19 mice (a); GE-SCJ of the adult mouse (b) and human (c) immunostained with KRT5 (green), KRT8 (Red), P63 (white), and nuclei (blue). A magnified view of the boxed GE-SCJ regions (right panel) (a). df Treatment scheme for lineage tracing of mice (d) and tiled images of GE-SCJ tissue sections from Krt5-CreERT2; Rosa26-tdTomato (e) or Krt8-CreERT2; Rosa26-tdTomato (f). Nuclei (blue). The white dotted line indicates the basal cells of squamous epithelia at GE-SCJ. g UMAP of esophagus and stomach epithelia (excluding GE-SCJ); cells color-coded by time point. h, i URD differentiation tree of the esophagus (h) and stomach (i) epithelial population; each dot represents a single cell, colored by cell type. Cells ordered based on pseudotime values starting from early (top) to late (bottom). j Circular dendrogram indicating the similarity between epithelial cell clusters as in (h, i) from both tissue types at different time points; Font color indicates time point and tissue type. k Heatmap showing top 20 DEG across esophagus and stomach epithelial stem cell compartments from the embryonic to adult time points; color bar denotes the z-scored mean expression range from high (deep pink) to low (blue). l Heatmap of 20 most variable transcription factors (TF) across epithelial stem cell compartments. The color bar depicts the scaled TF activity scores from high (deep pink) to low (blue). m Confocal images of the mouse GE-SCJ immunostained with CDH1 (green), GATA6 (red), SOX2 (white), and nuclei (blue). Sq, Co, Es, Fs, Hs indicate squamous epithelia, columnar epithelia, esophagus, forestomach, and hind stomach, respectively (ac, e, f, m). Images are representative of three biological replicates in (ac, e, f, m).
Fig. 3
Fig. 3. Fibroblasts organization during GE-SCJ development.
a, b UMAP of combined fibroblast (C-FB) cell clusters from esophagus and stomach samples; colored by tissue type and time point (a) in shades of green and magenta, respectively, and cluster annotation (b). c, d Dendrograms highlighting the similarity between fibroblast cell clusters from esophageal and stomach tissue types at different time points (c) and at annotated cluster levels (d); font color denotes subclusters as in figures (a, b), respectively. e Tiled images of mouse esophagus, GE-SCJ, and stomach tissue sections from E19 and adult stages immunostained with CDH1 (green), POSTN (red), and ACTA2 (white) and nuclei (blue). Images are representative of three biological replicates. Sq, Co indicates squamous and columnar epithelia, respectively. f Heatmap of top 20 DEG across fibroblast subclusters as in (b) and subclusters were grouped as in (d); Color bar denotes the z-scored mean expression values ranging from high (deep pink) to low (blue). g, h Sankey plots highlighting the contribution of fibroblast cells from the esophagus (g) and stomach (h) samples at each time point to the subclusters, as shown in (b).
Fig. 4
Fig. 4. WNT microenvironment in regulation of gastroesophageal tissues.
a, b Feature plots showing normalized expression levels of markers Rspo3 (a) and Dkk2 (b) within fibroblast cells. c Trend plots depict the changes associated with mean expression levels of the selected markers over time, as in (a, b). Line color denotes genes, and point shapes represent tissue type. di smRNA-ISH images of the WNT pathway genes Rspo3 (d) and Dkk2 (g) in the mouse esophagus tissue (i), GE-SCJ (ii), and stomach glands (iii). Nuclei (blue). Quantification of Rspo3 (e) and Dkk2 (h) signal counts in epithelia (Ep), stroma (St), and myofibroblast (My) in the mouse GE-SCJ tissue regions and distance (µm) from epithelia to Rspo3 (f) and Dkk2 (i) signal. Data are mean +/- SEM (e, f, and h, i). n = number of signal count and their distance to epithelia (f, i) from three non-overlapping 100 µm2 regions of esophagus and stomach tissues. jl Confocal images of adult mouse esophagus and stomach tissue sections immunostained for CDH1 (green), POSTN (red), and ACTA2 (red) and smRNA-ISH for Rspo3 (white), Dkk2 (white) and Sfrp4 (white) as indicated. m Violin plot showing the normalized gene expression values of Lrp6 and Kremen1 from embryonic to adult time points at different tissue regions. n Scheme for lineage tracing of mice expressing Axin2-CreERT2/Rosa26-tdTomato. o Tiled images of GE-SCJ sections from Axin2-CreERT2/Rosa26-tdTomato mice co-immunostained for KRT5 (green), AXIN2 lineage traced cells marked by Tdtomato (red), and nuclei (blue). Sq, Co indicates squamous and columnar epithelia, respectively. Images are representative of three biological replicates in (d, g, jl, o). For (e, f, and h, i), source data are provided as a Source Data file.
Fig. 5
Fig. 5. Distinct WNT signaling dependency for esophageal and stomach epithelial organoid growth validates the in vivo WNT microenvironment.
ad Bright-field images of the mouse (a, b) and human (c, d) esophageal and stomach organoids grown in the presence or absence of WNT3A (W) and R-spondin1 (R). b, d Higher magnification of (a, c). e, f Percentage of organoid formation (e) and long-term passaging (f) from esophagus and stomach under indicated conditions and passages (P); data derived from two biological replicates (n = 2). ‘#‘ indicates organoids can be passaged beyond the stated number. g, h Images of mouse esophageal and stomach organoid immunolabeled for KRT5 (green), KRT7 (Red), P63 (white), KRT8 (Red), nuclei (blue). i, j Organoid diameter measurement from mouse esophagus (i) and stomach (j) grown in indicated media. n = number of organoids measured. Data are representative of three biological replicates. Data are mean +/- SEM; statistical significance was calculated using a two-sided t-test, P-values as indicated. k, l Bright-field (k) and confocal images showing KRT5 (green), KRT8 (red), MUC5AC (white), and nuclei in blue (l). m, n smRNA-ISH images of Lgr5 (m) and Axin2 (n) in mouse esophagus (i) and stomach organoids with inset images (ii). Lgr5-highlighted in arrowhead (m-ii). oq Scheme for lineage tracing of mice (o). Organoids cultured from cells lineage traced for KRT5 (p) and KRT8 (q) in indicated media. r UMAP showing cellular subclusters of esophageal and stomach epithelial organoids. Cells colored by cluster (ST, stomach; ES, esophagus; Co, Columnar epithelia; Sq, squamous epithelia). s Pseudotime trajectories in esophagus epithelial subclusters. tv Dot plot depicting relative gene expression for stomach (t) and esophagus (u) epithelial subclusters for canonical and non-canonical WNT pathway (v). Circle size denotes percentage of cells expressing a gene; color represents the scaled mean expression level from high (red) to low (blue) (tv). w, x Images of human tissue (upper panel) and mouse esophagus organoids (lower panel), immunostained for KRT17 (yellow), JUN (red), KRT6 (red), CDH1 (green) and nuclei (blue). Images are representative of three biological replicates in (ad, g-h, kn, p-q, w-x). For (e, f, and i, j), source data is provided as a Source Data file.
Fig. 6
Fig. 6. Spatio-temporal alteration in epithelial and fibroblast signaling patterns of pre- and postnatal gastroesophageal tissues.
a Heatmap of gene set enrichment scores of fibroblasts and epithelial cells of esophagus and stomach from embryonic to adult time points with specific pathways highlighted; column represents individual cells colored by tissue type and time point; colors in the scale bar denotes the z-scored enrichment values ranging from high (deep pink) to low (blue). b, c Heatmap comparing the overall (aggregated both incoming and outgoing) signaling patterns associated with both fibroblast and epithelial compartments in the esophagus (b) and stomach (c) between E19 and adult time points. The color bar denotes the relative signaling strength (row-scaled values) of a pathway across cell types and time points. The relative strength of a pathway is calculated by normalizing each row of values to fall within the range 0-1 and depicted as low (white) to high (dark brown). Colored bar plot on top depicts the total signaling strength of a particular cell type by summarizing all pathways in the heatmap. d Dot plot showing the expression levels of ligands, receptors, and modulators associated with key signaling pathways in both fibroblasts and the epithelial subpopulation of esophagus and stomach at E19 and adult stages. Dot size represents the percentage of cells expressing a particular gene; the color bar indicates the intensity of scaled mean expression levels ranging from high (red) to low (blue). Genes are color-coded based on the signaling pathways to which they belong.
Fig. 7
Fig. 7. Decoding spatiotemporal cell-cell interaction dynamics in pre- and postnatal gastroesophageal tissue.
ac Graphical abstract of tissue-specific signaling directions between epithelia and fibroblasts (left); trend plots showing the mean expression dynamics of key ligands and receptors over time (right); for the following signaling pathways of interest: BMP (a) TGF-β (b) PDGF (c). Lines colored by gene with shapes representing the epithelial (circle) and fibroblast (triangle) cell population; arrows in graphical depictions show signaling direction and colored by signal origin: squamous epithelia (green), columnar epithelia (light pink) and fibroblast (brown). d–f Chord diagrams depicting inferred cell-cell communications mediated by multiple significant ligand-receptors between epithelia and fibroblast in esophagus and stomach at E19 and adult time points for BMP (d) TGF-β (e) PDGF (f) pathways; in lower half of the circos plot, outer bars colored by signal sending cell groups; inner bars colored by proportion of receiving cell groups; edges colored by signal senders. g, h Confocal images of the adult mouse esophagus (g) and stomach (h) tissue sections immunostained for CDH1 (green), PDGFRA (red), and smRNA-ISH probed for Pdgfa (white), and nuclei (blue). Images are representative of three biological replicates. Yellow arrow indicates the direction of predicted interaction between epithelial and fibroblast cells for PDGF signaling.
Fig. 8
Fig. 8. Graphical summary of the spatio-temporal signaling events during gastroesophageal histogenesis.
The illustration provides a comprehensive overview of the critical signaling events occurring during the evolution of gastroesophageal epithelia and fibroblasts at the GE-SCJ. In this depiction, we elucidate the differentiation pathways of esophagus and stomach epithelial cells, starting from their precursor cells expressing Sox11/Cldn6+ markers at embryonic stage 15. In the upper left portion of the panel (orange shades), precursor cells undergo differentiation into stratified squamous epithelial lineage cells (characterized by Trp63 + /Sox2 + /Krt5+ markers) as they progress through development, culminating in the formation of parabasal and terminally differentiated cells in the adult phase. Conversely, the upper right panel (blue shades) illustrates the evolution of stomach columnar epithelial cells (marked by Gata6 + /Krt8 + ). As development progresses, they organize into gland units with distinct epithelial regions such as the base, neck, and pit. In the lower panels, we observe the divergence in the distribution of esophageal (green shades) and stomach (magenta shades) stroma, featuring distinct subsets of fibroblasts with unique transcriptional signatures throughout development. Additionally, the regulation of key signaling pathways in the epithelia and fibroblasts, including WNT, BMP, EGF, FGF, PDGF, and TGF-ß pathways, with information on their signaling gradient established during gastroesophagus histogenesis are shown. C-FB indicates the combined fibroblast subclusters, as in Fig. 3b.

References

    1. Kinchen J, et al. Structural remodeling of the human colonic mesenchyme in inflammatory bowel disease. Cell. 2018;175:372–386.e317. doi: 10.1016/j.cell.2018.08.067. - DOI - PMC - PubMed
    1. Nowarski R, Jackson R, Flavell RA. The stromal intervention: regulation of immunity and inflammation at the epithelial-mesenchymal barrier. Cell. 2017;168:362–375. doi: 10.1016/j.cell.2016.11.040. - DOI - PubMed
    1. Dan W, Peng L, Yan B, Li Z, Pan F. Human microbiota in esophageal adenocarcinoma:pathogenesis, diagnosis, prognosis and therapeutic Implications. Front. Microbiol. 2021;12:791274. doi: 10.3389/fmicb.2021.791274. - DOI - PMC - PubMed
    1. Peters Y, et al. Barrett oesophagus. Nat. Rev. Dis. Prim. 2019;5:35. doi: 10.1038/s41572-019-0086-z. - DOI - PubMed
    1. Giroux V, Rustgi AK. Metaplasia: tissue injury adaptation and a precursor to the dysplasia-cancer sequence. Nat. Rev. Cancer. 2017;17:594–604. doi: 10.1038/nrc.2017.68. - DOI - PMC - PubMed

Substances