. 2024 Apr 9;15(1):2870.
doi: 10.1038/s41467-024-46970-w.

Meta-analysis indicates better climate adaptation and mitigation performance of hybrid engineering-natural coastal defence measures

Affiliations

Meta-analysis indicates better climate adaptation and mitigation performance of hybrid engineering-natural coastal defence measures

Lam Thi Mai Huynh et al. Nat Commun. .

Abstract

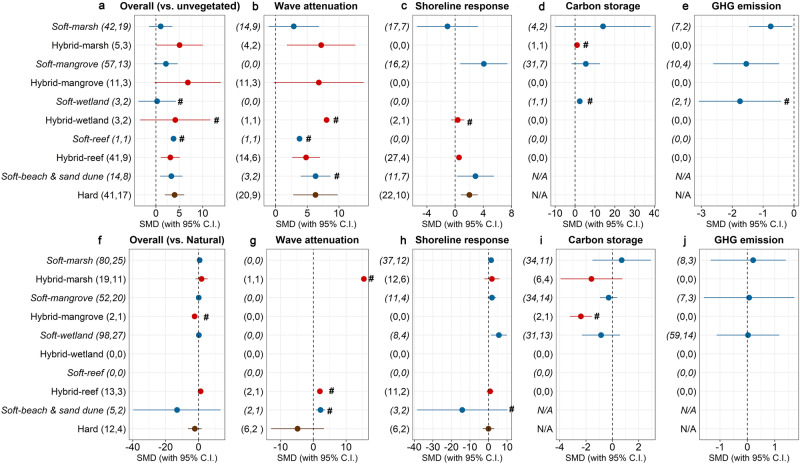
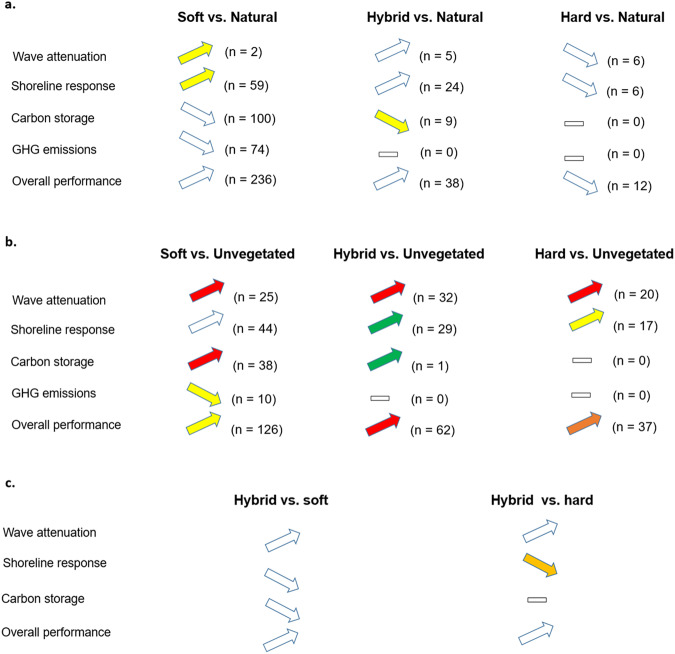
Traditional approaches to coastal defence often struggle to reduce the risks of accelerated climate change. Incorporating nature-based components into coastal defences may enhance adaptation to climate change with added benefits, but we need to compare their performance against conventional hard measures. We conduct a meta-analysis that compares the performances of hard, hybrid, soft and natural measures for coastal defence across different functions of risk reduction, climate change mitigation, and cost-effectiveness. Hybrid and soft measures offer higher risk reduction and climate change mitigation benefits than unvegetated natural systems, while performing on par with natural measures. Soft and hybrid measures are more cost-effective than hard measures, while hybrid measures provide the highest hazard reduction among all measures. All coastal defence measures have a positive economic return over a 20-year period. Mindful of risk context, our results provide strong an evidence-base for integrating and upscaling nature-based components into coastal defences in lower risk areas.


Conflict of interest statement

The authors declare no competing interests.

Figures

Fig. 1
Fig. 1. Mean effect size for different functions.
a Soft vs. natural, b Hybrid vs. natural, c Hard vs. natural, d Soft vs. unvegetated natural systems, e Hybrid vs. unvegetated natural systems, f Hard vs. unvegetated natural systems, g Hybrid vs. soft, and h Hybrid vs. hard. Hedges’ g was used to estimate the standardised mean difference (SMD) between two coastal defence options. If the bar falls into the positive side of the plot, we interpreted that the coastal defence option on the left of ‘vs.’ provides the given function at a higher level than the option on the right of ‘vs.’. Conversely, if the bar falls into the negative side means the opposite. In af the first numbers in parentheses indicate the number of observations and the second numbers in parentheses indicate the number of studies included in each calculation. Carbon storage and GHG emissions are not available for hard measures and are noted by ‘N/A’. Ranges indicated with ‘#’ in af denote functions with small number of observations that require cautious interpretation and generalisation. Due to data limitations, we followed an indirect comparison between soft, hybrid, and hard measures. In g, h, SMD was calculated based on sample size (number of reviewed studies), mean (estimated SMD from the previous meta-data analysis), and standard deviation between two paired groups: vs. “hybrid vs. unvegetated natural systems” vs. “soft vs unvegetated natural systems” and “hybrid vs. unvegetated natural systems” vs. “hard vs. unvegetated natural systems” (see Methods).
Fig. 2
Fig. 2. Subgroup analysis for different ecosystem types.
Panel ae compare functions between soft, hybrid, and hard measures with unvegetated natural systems. Panel fj compare functions between soft, hybrid, and hard measures with natural measures. Hedges’ g was used to estimate effect sizes as the difference in the means between the two groups. If the bar falls into the positive side of the plot, we interpreted that soft or hybrid measures provide the given function at a higher level than the reference base (i.e. natural measures). If the bar falls into the negative side it means the opposite. The first numbers in parentheses indicate the number of observations and the second numbers in parentheses indicate the number of studies included in each calculation. Carbon storage and GHG emissions are not available for hard measures and are noted by ‘N/A’. Ranges indicated with ‘#’ denote functions with small number of observations that require cautious interpretation and generalization.
Fig. 3
Fig. 3. Benefit-Cost Ratios (BCRs) of coastal defence projects.
Panel a illustrates BCRs of soft, hybrid, and hard coastal defence projects at discount rates of −2%, 4.5%, and 8%. Panel b shows BCRs for different subgroups including mangrove, marsh, seagrass, coral reef, unspecified wetland, beach, and sand dune at the discount rate −2%. Plot boxes show the minimum, first quartile, median, third quartile and maximum value. Outliers are removed in the boxes.
Fig. 4
Fig. 4. Performance summary of the different coastal defence options.
Panel a compares performance between soft, hybrid, and hard measures with natural measures. Panel b compares performance between soft, hybrid, and hard measures with unvegetated natural systems. Panel c compares performance of hybrid measures with soft and hard measures. Each arrow visually represents all observations elicited from the literature for a given comparison and function, and analysed in Fig. 1. The numbers in parentheses indicate the number of observations. The upward and downward direction of the arrow denote respectively higher and lower performance of the coastal defence option on the left of ‘vs.’ compared to the option on the right of ‘vs.’ Colours denote the range of effect size. Green: small effect (absolute value: 0–1), yellow: medium effect (absolute value: 1–3), orange: large effect (absolute value: 3–5), and red: very large effect (absolute value > 5). The above colours indicate that the respective 95% CIs do not intersect with zero. The white colour indicates there is no major difference between the two respective coastal defence options (i.e. the respective 95% CIs intersect with zero). The cross bar indicates no applicable data. Arrows indicated with ‘#’ denote aggregate functions with a small number of observations that require cautious interpretation and generalisation. Figure ideas are adapted from: Su, J., Friess, D. A. & Gasparatos, A. A meta-analysis of the ecological and economic outcomes of mangrove restoration. Nat. Commun. 12, (2021), which is licensed under a Creative Commons Attribution 4.0 International License: https://creativecommons.org/licenses/by/4.0/.

References

    1. UN. The Ocean conference: Factsheet People and Oceans. United Nations (2017).
    1. Young IR, Zieger S, Babanin AV. Global trends in wind speed and wave height. Sci. (80-.) 2011;322:451–454. doi: 10.1126/science.1197219. - DOI - PubMed
    1. IPCC. Climate change 2014: synthesis report. Contribution of Working Groups I, II and III to the Fifth Assessment Report of the Intergovernmental Panel on Climate Change, Geneva, Switzerland, Intergovernmental Panel on Climate Change. (2014).
    1. IPCC. Climate Change 2021: Summary for Policymakers. In Climate Change 2021: The Physical Science Basis. Contribution of Working Group I to the Sixth Assessment Report of the Intergovernmental Panel on Climate Change. 3–32 (Cambridge University Press, Cambridge, United Kingdom and New York, NY, USA, 2021).
    1. Berrang-Ford L, et al. A systematic global stocktake of evidence on human adaptation to climate change. Nat. Clim. Chang. 2021;11:989–1000. doi: 10.1038/s41558-021-01170-y. - DOI