. 2024 Apr 9;15(1):3075.
doi: 10.1038/s41467-024-47425-y.

Molecular patterns of resistance to immune checkpoint blockade in melanoma

Affiliations

Molecular patterns of resistance to immune checkpoint blockade in melanoma

Martin Lauss et al. Nat Commun. .

Abstract

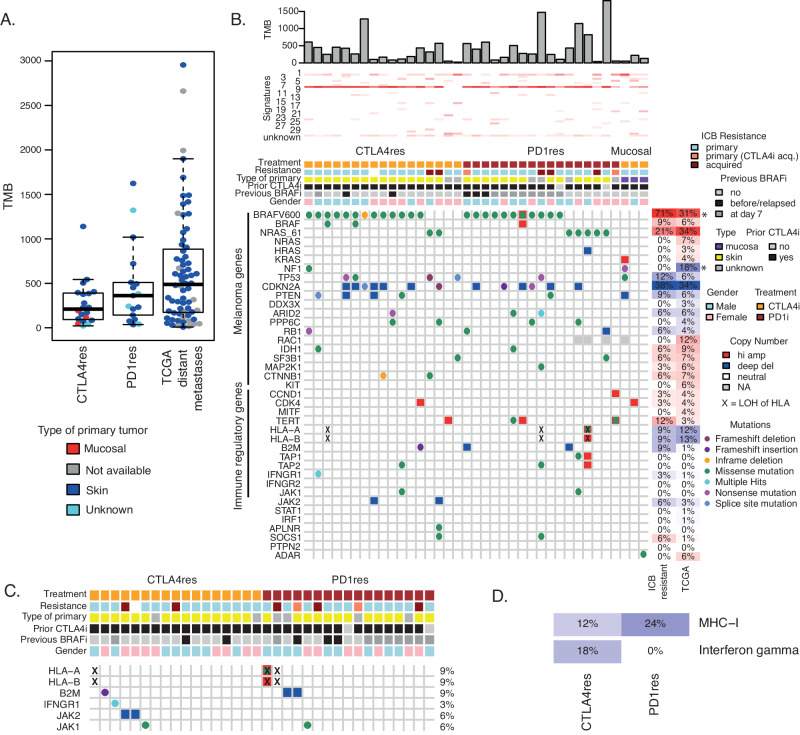
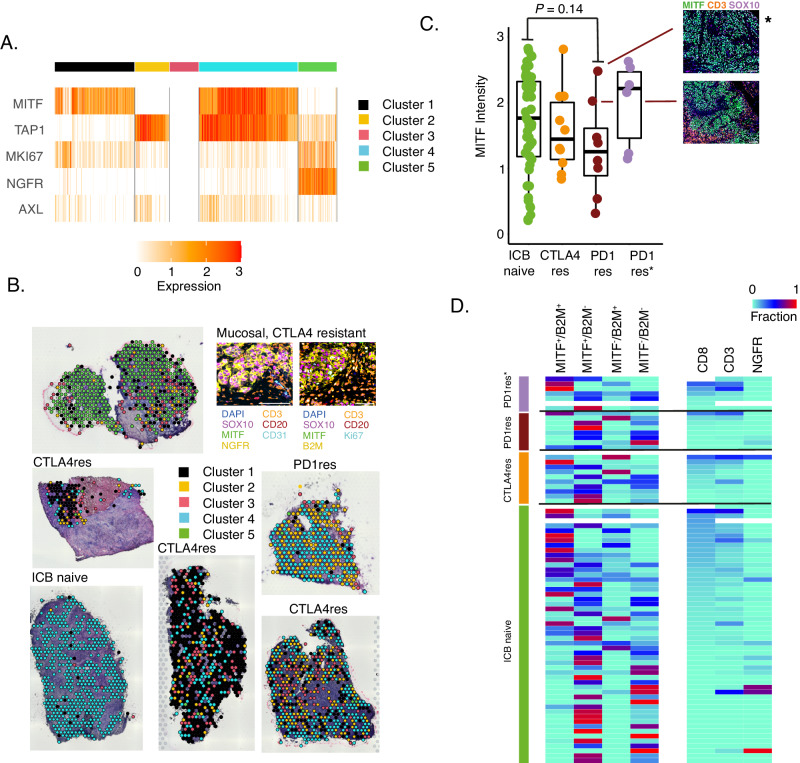
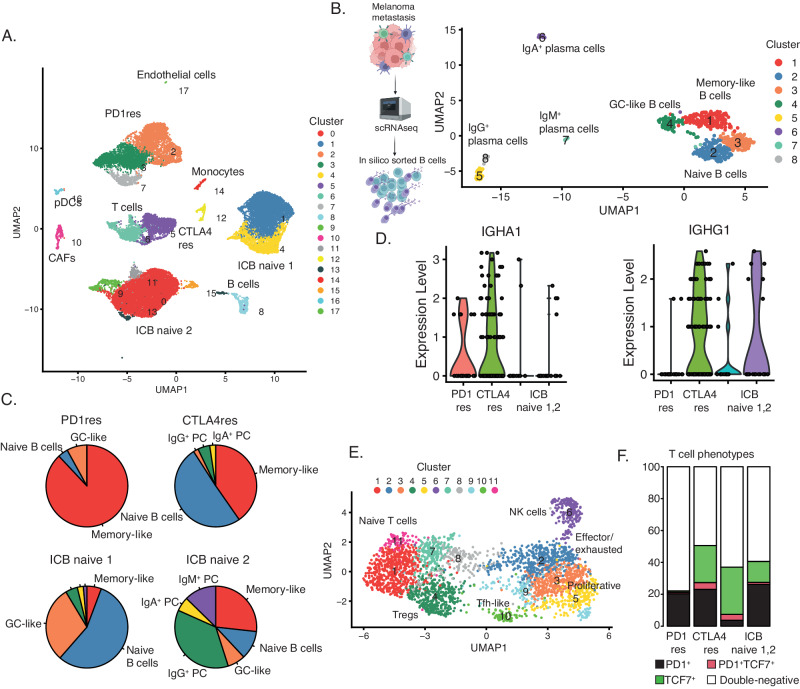
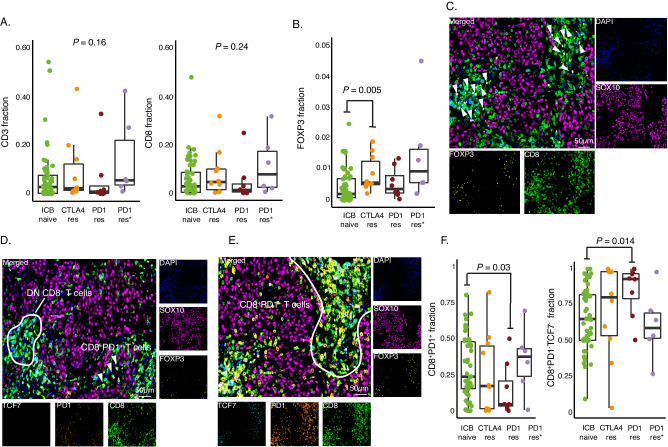
Immune checkpoint blockade (ICB) has improved outcome for patients with metastatic melanoma but not all benefit from treatment. Several immune- and tumor intrinsic features are associated with clinical response at baseline. However, we need to further understand the molecular changes occurring during development of ICB resistance. Here, we collect biopsies from a cohort of 44 patients with melanoma after progression on anti-CTLA4 or anti-PD1 monotherapy. Genetic alterations of antigen presentation and interferon gamma signaling pathways are observed in approximately 25% of ICB resistant cases. Anti-CTLA4 resistant lesions have a sustained immune response, including immune-regulatory features, as suggested by multiplex spatial and T cell receptor (TCR) clonality analyses. One anti-PD1 resistant lesion harbors a distinct immune cell niche, however, anti-PD1 resistant tumors are generally immune poor with non-expanded TCR clones. Such immune poor microenvironments are associated with melanoma cells having a de-differentiated phenotype lacking expression of MHC-I molecules. In addition, anti-PD1 resistant tumors have reduced fractions of PD1+ CD8+ T cells as compared to ICB naïve metastases. Collectively, these data show the complexity of ICB resistance and highlight differences between anti-CTLA4 and anti-PD1 resistance that may underlie differential clinical outcomes of therapy sequence and combination.


Conflict of interest statement

The authors have no competing interests.

Figures

Fig. 1
Fig. 1. Mutational landscape of immune checkpoint blockade (ICB) resistant melanoma.
A Tumor mutational burden (TMB) calculated as total number of somatic mutations in n = 20 anti-CTLA4 resistant (CTLA4res) or n = 17 anti-PD1 resistant tumors (PD1res) as compared to n = 68 ICB naïve distant metastases from the Cancer Genome Atlas (TCGA) n = 68. Boxplot is displayed with the center-line as median, the box limits as lower and upper quartiles, and with whiskers covering the most extreme values within 1.5 x Interquartile-Range. B Genetic aberrations of selected genes in CTLA4res (n = 17) and PD1res (17) resistant melanomas, combining mutation-, copy number- and HLA Loss-of-Heterozygosity (LOH) levels. The majority of PD1res melanomas had previously relapsed on CTLA4 blockade. Tumor mutational burden and mutational signatures are indicated on top. Frequencies of activating events for potential oncogenes and loss-of-function events for potential tumor suppressor genes are depicted on the right for ICB resistant tumors excluding mucosal samples, and for the ICB naïve TCGA control cohort, respectively, and significant differences are indicated by * (BRAF P = 3 × 104 and NF1 P = 0.008, Fisher test). All test were two-sides. Three mucosal melanomas are displayed in heatmap but excluded from statistical analyses. C Genetic alterations of genes in the interferon gamma and MHC-I pathways between CTLA4res (n = 17) and PD1res (n = 17). The frequency of combined events is noted for each gene. Annotation and event legends as in B. D Frequency plot of immune regulatory pathways in CTLA4res (n = 17) and PD1res (n = 17) melanomas, considering only loss-of-function events. Amp Amplification. Del Deletion. Source data and exact p-values are provided as a Source Data file.
Fig. 2
Fig. 2. The immune transcriptomic landscape of immune checkpoint blockade (ICB) resistant melanoma.
A Heatmap of melanoma module- and immune pathway transcriptomic scores,,,. Patient samples are divided according to anti-CTLA4 resistant (CTLA4res, n = 17), anti-PD1 resistant (PD1res, n = 10) and anti-PD1 resistant biopsies taken at day 7 during BRAFi treatment (PD1res*, n = 10). *P < 0.05 between anti-PD1 without and under BRAFi treatment. ^P < 0.05 between anti-PD1 without BRAFi and anti-CTLA4 resistant lesions. T.accum – accumulated T cell score, T.exhaust – exhausted T cell score, T.regulatory – regulatory T cell score, Ipi.resist – signature score associated with anti-CTLA4 resistance, T.exhaust.fixed – exhausted/fixed T cell score. P-values from t-test. All tests were two-sided. Exact p-values are provided in Source data. Three mucosal melanomas are displayed in heatmap but excluded from statistical analyses. B Top ten pathways from gene set enrichment analysis of genes differentiating anti-CTLA4 from anti-PD1 resistant melanomas. This analysis was conducted on genes derived from the DESeq2 analysis. P-values from gene set enrichment analysis and adjusted for multiple testing. Red = enriched in anti-CTLA4 group, blue = enriched in anti-PD1 group. C Fraction of CD3+ cells as determined by multiplex immunofluorescence in n = 10 CTLA4res, n = 8 PD1res and n = 6 PD1res* tumors. Representative images are shown. Scalebar is indicated by white line and corresponds to 100 μm. P-value from Wilcoxon test. Test was two-sided. D Boxplots of T cell receptor (TCR) clonality data in n = 9 CTLA4res, n = 9 PD1res and n = 11 PD1res* tumors. Left boxplot shows the clonotype count (Efron Thisted). P-value from Kruskal-Wallis text. Right boxplot shows the evenness according to normalized Shannon Wiener index. P-value from Wilcoxon test. E Spatial gene expression data of tumor cell regions using Nanostring GeoMx, normalized for SOX10 expression. Volcano plot showing differentially expressed genes between n = 10 anti-CTLA4 and n = 7 anti-PD1 resistant tumors. Boxplot of PMEL expression between the two groups. P-values from t-test. Test was two-sided. Boxplots are displayed with the center-line as median, the box limits as lower and upper quartiles, and with whiskers covering the most extreme values within 1.5 x Interquartile-Range. Source data and exact p values are provided as a Source Data file.
Fig. 3
Fig. 3. Tumor cells states in immune checkpoint blockade (ICB) resistant melanoma.
A Heatmap displaying expression of five melanoma state specific genes (MITF, TAP1, MKI67, NGFR, AXL) across 2,766 tumor cell enriched spots from the Visium data in six melanoma tumors. Spots were divided in five distinct clusters based on consensus clustering and are grouped by this cluster assignment. B Mapping back melanoma cell clusters as defined in A, from six melanoma metastases, to the respective histological images. Indicated is also a validation using multiplex immunofluorescence. C MITF multiplex immunofluorescence intensity of n = 51 ICB naïve, n = 10 anti-CTLA4 resistant (CTLA4res), n = 8 anti-PD1 resistant (PD1res) and n = 6 anti-PD1 resistant under BRAFi treatment (PD1res*). MITF intensity was measured in SOX10 positive melanoma cells. P-value from Wilcoxon test. Test was two-sided. * denotes a melanoma with an MITF-high phenotype and B2M deep deletion. Scalebars are indicated by white line and correspond to 100 μm. Boxplot is displayed with the center-line as median, the box limits as lower and upper quartiles, and with whiskers covering the most extreme values within 1.5 x Interquartile-Range. D Frequency plot of different melanoma cell states using multiplex immunofluorescence of MITF/B2M fractions and NGFR fractions. NGFR fractions are within SOX10 positive melanoma cells. Samples are sorted by CD8 fraction and grouped according to treatment. (PD1res n = 8, PD1res* n = 7, CTLA4res n = 10, ICB naïve n = 53). Source data are provided as a Source Data file.
Fig. 4
Fig. 4. B cells and tertiary lymphoid structures in immune checkpoint blockade (ICB) resistant melanoma.
A Boxplot of fractions of CD20 + B cells by treatment using multiplex immunofluorescence. P-value from Wilcoxon test. Test was two-sided. Green - ICB naïve (n = 52), orange - anti-CTLA4 resistant (CTLA4res) (n = 10), red - anti-PD1 resistant (PD1res) (n = 8), purple - anti-PD1 resistant under BRAFi (PD1res*) (n = 6). Boxplot is displayed with the center-line as median, the box limits as lower and upper quartiles, and with whiskers covering the most extreme values within 1.5 x Interquartile-Range. BD Multiplex immunofluorescence images of TLSs and B cells in ICB naïve (B), CTLA4res (C) and PD1res (D) melanoma. Representative images are shown. Source data are provided as a Source Data file.
Fig. 5
Fig. 5. Functional B and T cell phenotype composition using single cell RNA sequencing.
A Uniform Manifold Approximation and Projection (UMAP) plot of 26,053 single cells from one anti-PD1 resistant (PD1res), one anti-CTLA4 resistant (CTLA4res) and two immune checkpoint blockade (ICB) naïve melanomas, with increased B cells. Cell type assignments derived from manual annotation are indicated in the plot. B UMAP of 559 B cells visualizing eight distinct clusters. B cell subsets are indicated in the plot after manual annotation. The scheme of the experimental procedure was created with BioRender.com. C Pie charts describing the fraction of each B cell subset in the four melanomas. D Violin plots of the expression of IGHA1 and IGHG1 in memory-like B cells in the four melanomas. E UMAP of 2921 T cells visualizing 11 clusters, in the four melanomas. T cell subsets are indicated in the plot after manual annotation. F CD8 T cell phenotype fractions based on non-zero expression of PD1 and TCF7 in CD8A or CD8B expressing T cells of all four melanomas. Source data are provided as a Source Data file.
Fig. 6
Fig. 6. T cell phenotypes in immune checkpoint blockade (ICB) resistant melanomas.
A CD3+ and CD8+ T cell fraction using multiplex immunofluorescence shown as boxplots. P-values from Kruskal-Wallis test. B FOXP3+ T cell fraction using multiplex immunofluorescence shown as boxplot. P-value from Wilcoxon test. Test was two-sided. C Multiplex immunofluorescence images from an anti-CTLA4 resistant (CTLA4res) melanoma that has infiltration of FOXP3+ T cells. FOXP3+ T cells are co-localized with CD8+ T cells and marked by an arrowhead. D Multiplex immunofluorescence images from an anti-PD1 resistant melanoma (PD1res) that has a strong infiltration of CD8+ T cells. PD1/TCF7 double negative CD8+ T cells areas are marked. E Multiplex immunofluorescence images from an ICB naive melanoma that has a strong infiltration of CD8+ T cells. PD1+ CD8+ T cells area is marked. F Boxplots of the fraction of PD1+TCF7- of CD8+ T cells and the fraction of double negative T cells (PD1/TCF7) using multiplex immunofluorescence. P-values from Wilcoxon test. All tests were two-sided. Green - ICB naïve (A, B, n = 52; F, n = 50) orange - anti-CTLA4 resistant (CTLA4res) (A, B, F, n = 10), red - anti-PD1 resistant (PD1res) (A, B, F, n = 8), purple - anti-PD1 resistant under BRAFi (PD1res*) (A, B, F, n = 6). Boxplots are displayed with the center-line as median, the box limits as lower and upper quartiles, and with whiskers covering the most extreme values within 1.5 x Interquartile-Range. Representative areas from two tumor cores (1 mm in diameter) per melanoma metastasis were selected in the display items in (CE). Source data are provided as a Source Data file.

Similar articles

Cited by

References

    1. Larkin J, et al. Five-Year Survival with Combined Nivolumab and Ipilimumab in Advanced Melanoma. N. Engl. J. Med. 2019;381:1535–1546. doi: 10.1056/NEJMoa1910836. - DOI - PubMed
    1. Gide TN, Wilmott JS, Scolyer RA, Long GV. Primary and Acquired Resistance to Immune Checkpoint Inhibitors in Metastatic Melanoma. Clin. Cancer Res. 2018;24:1260–1270. doi: 10.1158/1078-0432.CCR-17-2267. - DOI - PubMed
    1. Sharma P, Hu-Lieskovan S, Wargo JA, Ribas A. Primary, Adaptive, and Acquired Resistance to Cancer Immunotherapy. Cell. 2017;168:707–723. doi: 10.1016/j.cell.2017.01.017. - DOI - PMC - PubMed
    1. Marine JC, Dawson SJ, Dawson MA. Non-genetic mechanisms of therapeutic resistance in cancer. Nat. Rev. Cancer. 2020;20:743–756. doi: 10.1038/s41568-020-00302-4. - DOI - PubMed
    1. Liu D, et al. Integrative molecular and clinical modeling of clinical outcomes to PD1 blockade in patients with metastatic melanoma. Nat. Med. 2019;25:1916–1927. doi: 10.1038/s41591-019-0654-5. - DOI - PMC - PubMed

MeSH terms

Substances