

Parafoveal cone function in choroideremia assessed with adaptive optics optoretinography
- PMID: 38594294
- PMCID: PMC11004114
- DOI: 10.1038/s41598-024-58059-x
Parafoveal cone function in choroideremia assessed with adaptive optics optoretinography
Abstract
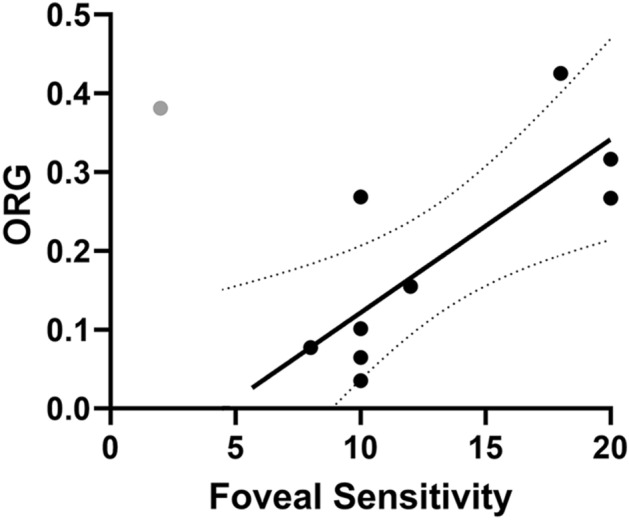
Choroideremia (CHM) is an X-linked retinal degeneration leading to loss of the photoreceptors, retinal pigment epithelium (RPE), and choroid. Adaptive optics optoretinography is an emerging technique for noninvasive, objective assessment of photoreceptor function. Here, we investigate parafoveal cone function in CHM using adaptive optics optoretinography and compare with cone structure and clinical assessments of vision. Parafoveal cone mosaics of 10 CHM and four normal-sighted participants were imaged with an adaptive optics scanning light ophthalmoscope. While acquiring video sequences, a 2 s 550Δ10 nm, 450 nW/deg2 stimulus was presented. Videos were registered and the intensity of each cone in each frame was extracted, normalized, standardized, and aggregated to generate the population optoretinogram (ORG) over time. A gamma-pdf was fit to the ORG and the peak was extracted as ORG amplitude. CHM ORG amplitudes were compared to normal and were correlated with bound cone density, ellipsoid zone to RPE/Bruch's membrane (EZ-to-RPE/BrM) distance, and foveal sensitivity using Pearson correlation analysis. ORG amplitude was significantly reduced in CHM compared to normal (0.22 ± 0.15 vs. 1.34 ± 0.31). In addition, CHM ORG amplitude was positively correlated with cone density, EZ-to-RPE/BrM distance, and foveal sensitivity. Our results demonstrate promise for using ORG as a biomarker of photoreceptor function.
© 2024. The Author(s).
Conflict of interest statement
JIWM is an inventor on US Patent 8226236, US Patent 11607125, and US Patent App. 63/497,933 and receives funding from Beacon Therapeutics. RFC is an inventor on US Patent 11607125 and has a financial interest in Translational Imaging Innovations.
Figures


Similar articles
-
Retinal Sensitivity in Comparison to Cone Density in Choroideremia.Invest Ophthalmol Vis Sci. 2024 Dec 2;65(14):6. doi: 10.1167/iovs.65.14.6. Invest Ophthalmol Vis Sci. 2024. PMID: 39625441 Free PMC article.
-
Cone Photoreceptor Morphology in Choroideremia Assessed Using Non-Confocal Split-Detection Adaptive Optics Scanning Light Ophthalmoscopy.Invest Ophthalmol Vis Sci. 2023 Jul 3;64(10):36. doi: 10.1167/iovs.64.10.36. Invest Ophthalmol Vis Sci. 2023. PMID: 37504961 Free PMC article.
-
Multimodal Imaging of Photoreceptor Structure in Choroideremia.PLoS One. 2016 Dec 9;11(12):e0167526. doi: 10.1371/journal.pone.0167526. eCollection 2016. PLoS One. 2016. PMID: 27936069 Free PMC article.
-
Multimodal Imaging in Choroideremia.Adv Exp Med Biol. 2019;1185:139-143. doi: 10.1007/978-3-030-27378-1_23. Adv Exp Med Biol. 2019. PMID: 31884602 Free PMC article. Review.
-
Cones in ageing and harsh environments: the neural economy hypothesis.Ophthalmic Physiol Opt. 2020 Mar;40(2):88-116. doi: 10.1111/opo.12670. Epub 2020 Feb 4. Ophthalmic Physiol Opt. 2020. PMID: 32017191 Free PMC article. Review.
Cited by
-
Longitudinal Changes in Optoretinography Provide an Early and Sensitive Biomarker of Outer Retinal Disease.Am J Ophthalmol. 2025 Sep;277:375-386. doi: 10.1016/j.ajo.2025.05.032. Epub 2025 May 28. Am J Ophthalmol. 2025. PMID: 40447249
-
From Cellular to Metabolic: Advances in Imaging of Inherited Retinal Diseases.Diagnostics (Basel). 2024 Dec 26;15(1):28. doi: 10.3390/diagnostics15010028. Diagnostics (Basel). 2024. PMID: 39795556 Free PMC article. Review.
-
Retinal Sensitivity in Comparison to Cone Density in Choroideremia.Invest Ophthalmol Vis Sci. 2024 Dec 2;65(14):6. doi: 10.1167/iovs.65.14.6. Invest Ophthalmol Vis Sci. 2024. PMID: 39625441 Free PMC article.
-
Multidimensional Functional Phenotyping Based on Photoreceptor-Directed Temporal Contrast Sensitivity Defects in Inherited Retinal Diseases.Invest Ophthalmol Vis Sci. 2025 Apr 1;66(4):25. doi: 10.1167/iovs.66.4.25. Invest Ophthalmol Vis Sci. 2025. PMID: 40208579 Free PMC article.
References
-
- MacDonald, I. M., Hume, S., Zhai, Y. & Xu, M. Choroideremia. GeneReviews((R)) (eds M. P. Adam et al.) (University of Washington, Seattle, WA, 1993).
MeSH terms
Grants and funding
LinkOut - more resources
Full Text Sources
