. 2024 Apr;56(4):615-626.
doi: 10.1038/s41588-024-01682-1. Epub 2024 Apr 9.

Tissue-specific enhancer-gene maps from multimodal single-cell data identify causal disease alleles

Collaborators, Affiliations

Tissue-specific enhancer-gene maps from multimodal single-cell data identify causal disease alleles

Saori Sakaue et al. Nat Genet. 2024 Apr.

Abstract

Translating genome-wide association study (GWAS) loci into causal variants and genes requires accurate cell-type-specific enhancer-gene maps from disease-relevant tissues. Building enhancer-gene maps is essential but challenging with current experimental methods in primary human tissues. Here we developed a nonparametric statistical method, SCENT (single-cell enhancer target gene mapping), that models association between enhancer chromatin accessibility and gene expression in single-cell or nucleus multimodal RNA sequencing and ATAC sequencing data. We applied SCENT to 9 multimodal datasets including >120,000 single cells or nuclei and created 23 cell-type-specific enhancer-gene maps. These maps were highly enriched for causal variants in expression quantitative loci and GWAS for 1,143 diseases and traits. We identified likely causal genes for both common and rare diseases and linked somatic mutation hotspots to target genes. We demonstrate that application of SCENT to multimodal data from disease-relevant human tissue enables the scalable construction of accurate cell-type-specific enhancer-gene maps, essential for defining noncoding variant function.


Conflict of interest statement

Competing interests

S.R. is a founder for Mestag, Inc., a scientific advisor for Rheos, Jannsen and Pfizer, and serves as a consultant for Sanofi and Abbvie. The other authors declare no competing interests.

Figures

Extended Data Fig. 1 |
Extended Data Fig. 1 |. Distribution of gene expression counts in single-cell RNA-seq and statistics from association between gene expression and chromatin accessibility under null simulation.
a. In an example dataset of arthritis-dataset, mean gene count was strongly correlated with standard deviation of the gene count. b. The correlation between max expression count per gene (x-axis) and the mean naïve association chi-square values (χ2) from Poisson regression between gene expression and chromatin accessibility under null simulation (y-axis). c. The quantile-quantile (QQ) plot of two-sided P values from the Poisson regression between gene expression count and chromatin accessibility under null simulation. d. The QQ plot of two-sided P values from the negative binomial regression between gene expression count and chromatin accessibility under null simulation. e. The QQ plot of two-sided P values from the linear regression between log-normalized and inverse-normal-transformed gene expression and chromatin accessibility under null simulation. f. The QQ plot of two-sided P values estimated from bootstrapping based on the statistics distributions from the Poisson regression between gene expression count and chromatin accessibility under null simulation. g. The QQ plot of two-sided P values estimated from bootstrapping based on the statistics distributions from the negative binomial regression between gene expression count and chromatin accessibility under null simulation. h. Computational runtime benchmarking for Poisson regression with binarized ATAC-seq peak (red), negative binomial regression with binarized ATAC-seq peak (teal), and Poisson regression with non-binarized ATAC-seq peak (blue). The values are relative to the computational time for Poisson regression, and bars are the mean across n=100 randomly selected peak-gene pairs. Horizontal lines (error bars) indicate one standard deviation from the mean.
Extended Data Fig. 2 |
Extended Data Fig. 2 |. Schematic overview of SCENT model using Poisson regression and non-parametric bootstrapping.
We first run Poisson regression associating the raw gene expression count (RNA-seq) with the peak accessibility (ATAC-seq) accounting for technical covariates across the entire cells in the multimodal data to estimate βpeak. Then, we resampled cells with replacement from the full data in each of the bootstrapping round and re-estimated βpeak for N times. We compared this empirical distribution of βpeak against the null hypothesis (βpeak = 0) to derive the significance of βpeak (that is, two-sided bootstrapping-based P value = Pbootstrap).
Extended Data Fig. 3 |
Extended Data Fig. 3 |. The QQ plot of SCENT P values by bootstrapping.
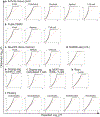
We applied SCENT to each of 23 broad cell types from 9 single-cell multimodal datasets. Each QQ plot represents two-sided Pbootstrap values in each cell type in each dataset (a. arthritis-tissue, b. public PBMC, c. NeurIPS, d. SHARE-seq, e. Dogma-seq (control), f. Dogma-seq (stimulated) g. NEAT-seq, h. Brain, i. Pituitary.
Extended Data Fig. 4 |
Extended Data Fig. 4 |. Properties of SCENT peaks.
a. The number of significant SCENT peaks per gene across genes we investigated in at least one dataset-cell type pair. b. The number of significant gene-peak pairs discovered by SCENT with FDR < 10% in each dataset (y-axis) as a function of the total number of ATAC-seq fragments in each dataset (x-axis), colored by the dataset. c. The number of significant gene-peak pairs discovered by SCENT with FDR < 10% in each dataset (y-axis) as a function of the total number of unique RNA molecules in each dataset (x-axis), colored by the dataset. d. The effect size correlation r by Pearson’s correlation between arthritis-tissue dataset and the other dataset for the same cell type (left) and the directional (sign) concordance between arthritis-tissue dataset and the other dataset for the same cell type (right). e. Fraction of overlap with ENCODE cCREs in SCENT (teal) or non-SCENT peaks (orange) in each dataset and random set of cis-non-coding regions (pink). f. The mean Δ phastCons score for SCENT with excluding promoter peaks (teal) and all cis-ATAC peaks with excluding promoter peaks (yellow) in each of the three example multimodal datasets. The bars indicate the 95% CI by bootstrapping genes (nbootstrap=1000). g. The mean Δ phastCons score between SCENT peaks and TSS-distance-matched non-SCENT peaks across all the genes. The bars indicate the 95% CI by bootstrapping genes (nbootstrap=1000).
Extended Data Fig. 5 |
Extended Data Fig. 5 |. Mutational constraint on genes with a high number of SCENT peaks.
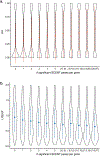
For each gene, the number of SCENT peaks were counted and binned as shown in the x-asis, and mutational constraint metric (pLI (the probability of being loss of function intolerant): a, LOEUF (the loss-of-function observed/expected upper bound fraction): b) for genes within each bin are shown as a violin plot on the y-axis. The dots indicate the mean score in each bin, and the error bars indicate one standard deviation from the mean. Each bin consists of 555–4071 genes in a and 568–4265 genes in b.
Extended Data Fig. 6 |
Extended Data Fig. 6 |. Causal variant enrichment for eQTLs.
a. The mean causal variant enrichment for eQTL within SCENT peaks with excluding all promoters (teal) or cis-regulatory ATAC-seq peaks with excluding all promoters (yellow) in each dataset. b. The mean causal variant enrichment for eQTL within SCENT peaks (teal) or non-SCENT peaks with matching distance to TSS (pink). c. Comparison of the mean causal variant enrichment for eQTL (y-axis) among SCENT (teal), ArchR (pink), and Signac (purple) as a function of the number of significant peak-gene pairs at each threshold of significance by FDR in SCENT and correlation r in ArchR and Signac. d. Comparison of the mean causal variant enrichment for eQTL among SCENT, ArchR, and Signac as a function of the number of significant peak-gene pairs at each threshold of FDR in SCENT, ArchR and Signac. The ArchR results with > 180,000 peak-gene linkages are omitted. e. Comparison of the mean causal variant enrichment for eQTL among SCENT, ArchR, and ArchR filtered on RNA expression as a function of the number of significant peak-gene pairs. f. Comparison of the mean causal variant enrichment for eQTL among SCENT, Signac, and Signac filtered on RNA expression as a function of the number of significant peak-gene pairs. g. Comparison of the mean causal variant enrichment for eQTL among SCENT, the default Pearson’s correlation version of Signac, and the optional Spearman’s correlation version of Signac as a function of the number of significant peak-gene pairs. h. Comparison of the mean causal variant enrichment for eQTL among original SCENT (Poisson regression + non-parametric bootstrapping), Poisson-only strategy without bootstrapping, and Cicero (correlation method using sc-ATAC-seq alone) as a function of the number of significant peak-gene pairs up to 100,000 peak-gene linkages. i. Comparison of the mean causal variant enrichment for eQTL between SCENT and Cicero peaks with adding all accessible promoter regions (1 kb regions from TSS) to account for potential promoter bias. j. Tissue-specific causal variant enrichment within SCENT peaks. The dots and lines are colored by the eQTL source tissue in GTEx that we assessed. In all panels, the bars indicate 95% confidence intervals by bootstrapping genes (nbootstrap=1000).
Extended Data Fig. 7 |
Extended Data Fig. 7 |. Causal variant enrichment for GWAS.
a and b. The mean causal variant enrichment for GWAS within cell-type-specific and aggregated SCENT enhancers (teal), ENCODE cCREs (pink), group-specific and aggregated EpiMap enhancers (red) and sample-specific and aggregated ABC enhancers (blue). GWAS results were based on FinnGen (a) and UK Biobank (b). The bars indicate 95% confidence intervals by bootstrapping traits (nbootstrap=1000). c. The mean causal variant enrichment for FinnGen GWAS (see Methods) within SCENT peaks with excluding all promoters (teal) or cis-regulatory ATAC-seq peaks with excluding all promoters (yellow) in each of the 9 single-cell datasets. The bars indicate 95% confidence intervals by bootstrapping traits (nbootstrap=1000). d. The mean causal variant enrichment for FinnGen GWAS (see Methods) within SCENT peaks (teal) or non-SCENT peaks with matching distance to TSS (pink) in each of the 9 single-cell datasets. The bars indicate 95% confidence intervals by bootstrapping traits (nbootstrap=1000). e. The fraction of known genes from Mendelian autoimmune diseases among all the genes identified by SCENT, EpiMap, and ABC model. The color of the bars indicates the cell types in each linking method.
Extended Data Fig. 8 |
Extended Data Fig. 8 |. Causal variant enrichment for GWAS and comparison with published bulk methods and single-cell methods.
a. Comparison of the mean causal variant enrichment for FinnGen GWAS (y-axis) among SCENT (teal), EpiMap (red), and ABC model (blue) as a function of the number of significant peak-gene pairs (x-axis) at each threshold of significance. The bars indicate 95% confidence intervals by bootstrapping traits (nbootstrap=1000). b. We calculated the causal variant enrichment for FinnGen GWAS among SCENT (teal), EpiMap (reds), and ABC model (blues) by changing the PIP thresholds in defining putative causal variants from fine-mapping. The bars indicate 95% confidence intervals by bootstrapping traits (nbootstrap=1000). c and d. The mean causal variant enrichment for GWAS within SCENT enhancers (teal), ArchR (pink) and Signac enhancers (purple). GWAS results were based on FinnGen (c) and UK Biobank (d) using the FDR < 10% threshold in each software and eight benchmarking datasets (see Methods). The bars indicate 95% confidence intervals by bootstrapping traits (nbootstrap=1000).
Extended Data Fig. 9 |
Extended Data Fig. 9 |. SMAD3 locus in asthma GWAS.
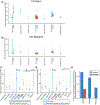
Rs17293632 in asthma GWAS (a) was prioritized and connected to SMAD3 gene by SCENT in myeloid cells (b). The panel a is a GWAS regional plot, with x-axis representing the position of each genetic variant and y-axis representing −log10(P) from GWAS (a two-sided P value). The rs17293632 has a significant caQTL effect, as shown in c and d. In panel c, the read coverage from single-cell ATAC-seq in each of donors with heterozygous genotype at this accessible region is presented, and at rs17293632, we observed allele-specific increased accessibility with C allele when compared T allele across donors. In panel d, normalized chromatin accessibility based on the read coverage for an individual after regressing out covariates is presented by the genotype of rs17293632 (CC, CT and TT). The horizontal bars within boxes indicate the median, and the lower and upper hinges represent 25% and 75% quantile. The upper whisker extends from the hinge to the largest value no further than 1.5 * inter-quartile range (IQR) from the hinge. The lower whisker extends from the hinge to the smallest value at most 1.5 * IQR of the hinge. All individual points are plotted as dots.
Extended Data Fig. 10 |
Extended Data Fig. 10 |. Cells to be included in the regression framework.
a. An example situation of correlated gene expression without biological regulatory function. b. Benchmarking models for statistical power to define biologically plausible peak-gene linkage over false-associations due to correlated genes. c. Benchmarking results regarding cells and covariates included in the SCENT regression model. The x-axis represents the number of statistically significant peak-gene linkages among 5,000 randomly selected peak-gene linkages in cis, and the y-axis represents the number of statistically significant peak-gene linkages in cis divided by the number of statistically significant peak-gene linkages in trans among 5,000 randomly selected peak-gene linkages on different chromosomes, as a proxy metric for capability of identifying regulatory elements over ‘correlated’ elements. Red dots indicate the analyses conducted in all cells including different cell types (n = 8,881), whereas blue dots indicate the analyses conducted in only T cells (n = 8,881). d and e. False positive rate and precision for peak-gene linkages from analyses conducted in all cells (teal) or in only T cells (orange) by using experimentally validated enhancer-gene linkages (that is, CRISPR-Flow FISH data in d and H3K27ac data in e). False negative rate and precision were defined as follows: false negative rate = # false negative/(# true positive + # false negative) = 1 – recall
Fig. 1 |
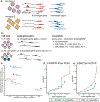
Fig. 1 |. Schematic overview of SCENT and SCENT enhancer–gene pairs across nine single-cell multimodal datasets.
a, SCENT identifies (1) active cis-regulatory regions and (2) their target genes in (3) a specific cell type. Those SCENT results can be used to define likely causal variants, genes and cell types for GWAS loci. b, SCENT models association between chromatin accessibility from ATAC–seq and gene expression from RNA-seq across individual cells in a given cell type. c, Nine single-cell datasets on which we applied SCENT to create 23 cell-type-specific enhancer–gene maps. The cells in each dataset are described in UMAP embeddings from RNA-seq, colored by cell types (ncells > 500) and annotated by cell numbers.
Fig. 2 |
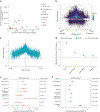
Fig. 2 |. SCENT identified functionally active and evolutionarily conserved cis-regulatory regions from single-cell multimodal data.
a, The number of significant gene–peak pairs discovered by SCENT with FDR <10%. Each dot represents the number of significant gene–peak pairs in a given cell type in a dataset (y axis) as a function of the number of cells in each cell type in a dataset (x axis), colored by the dataset. b, The effect size (β) of chromatin accessibility on the gene expression from Poisson regression (y axis). Each dot is a significant gene–peak pair (FDR <10%) and plotted against the distance between the peak and the TSS of the gene, colored as a density plot. c, The mean effect size (β) of chromatin accessibility on the gene expression for SCENT enhancer–gene links in arthritis-tissue dataset within each bin of TSS distance. The lines indicate 95% CIs in each bin with the bin size either 47 or 48. d, The mean phastCons score difference (ΔphastCons score) between each annotated region and all cis-regulatory noncoding regions. We show the ΔphastCons score for exonic regions (purple) as a reference, and for SCENT (teal) and all cis-ATAC peaks (yellow) in each multimodal dataset. The bars indicate 95% CIs by bootstrapping (nbootstrap = 1,000). e,f, Enrichment test for SCENT enhancer–gene links within enhancer–promoter contacts based on CRISPR-Flow FISH and H3K27ac HiChIP. We plot the odds ratio (a point estimate as a dot and 95% CI as a bar) and P values from the two-sided Fisher’s exact enrichment test for SCENT enhancer–gene links within enhancer–gene connections based on CRISPR-Flow FISH in cell lines (e) and enhancer–promoter contact loops based on H3K27ac HiChIP in T cells (f). In f, light-blue rows show the results from each of the six datasets that include T cells, and the dark-blue row at the bottom show the result from combined SCENT track across the six datasets.
Fig. 3 |
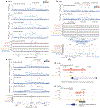
Fig. 3 |. SCENT enhancers are enriched in putative causal variants of eQTL and GWAS.
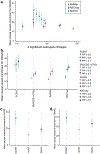
a, The mean causal variant enrichment for eQTL within SCENT peaks or all ATAC–seq peaks in each of the nine single-cell datasets. The bars indicate 95% CIs by bootstrapping genes (nbootstrap = 1,000). CTRL, control; STIM, stimulated. b, Comparison of the mean causal variant enrichment for eQTL (y axis) between SCENT (teal), ArchR (pink) and Signac (purple) as a function of the number of significant peak–gene pairs at each threshold of significance (FDR and Pearson’s correlation r). The bars indicate 95% CIs by bootstrapping genes (nbootstrap = 1,000). The ArchR results with >100,000 peak–gene linkages are omitted, and full results are shown in Extended Data Fig. 6c. c,d, The mean causal variant enrichment for GWAS within SCENT enhancers (teal), all cis-ATAC peaks (yellow), ENCODE cCREs (pink), EpiMap enhancers across all groups(red) and ABC enhancers across all samples (blue). GWAS results were based on FinnGen (c) and UK Biobank (d). The bars indicate 95% CIs by bootstrapping traits (nbootstrap = 1,000). e, The mean causal variant enrichment for FinnGen GWAS within intersection of SCENT enhancers and caQTL enhancers at each threshold of significance (either by binomial test for allele-specific effect (ASE) followed by combining P values by Fisher’s method or by RASQUAL). The bars indicate 95% CIs by bootstrapping traits (nbootstrap = 1,000).
Fig. 4 |
Fig. 4 |. SCENT defined causal variants and genes in complex trait GWAS.
a, rs72928038 at BACH2 locus was prioritized by T-cell-specific SCENT enhancer–gene map for rheumatoid arthritis (RA), type 1 diabetes (T1D), atopic dermatitis and hypothyroidism. The top four panels are GWAS regional plots, with x axis representing the position of each genetic variant and y axis representing − log10(P) from GWAS (two-sided P values). The color of the dots represents linkage disequilibrium (LD) r2 from the prioritized variant (highlighted by light-blue stripe). ATAC–seq and SCENT tracks represent aggregated ATAC–seq tracks (top) and SCENT peaks (bottom with gray stripes) in each cell type (public PBMC dataset for immune cell types and arthritis-tissue dataset for fibroblast). An arrow indicates the SCENT peak overlapping with fine-mapped variant. LD, linkage disequilibrium. b, rs35944082 for RA and T1D was prioritized and connected to RBPJ by long-range interaction from T cell and fibroblast SCENT enhancer–gene map using inflamed synovium in the arthritis-tissue dataset. The top two panels are GWAS regional plots similarly to a. ATAC–seq and SCENT tracks represent aggregated ATAC–seq tracks (top) and SCENT peaks (bottom with gray stripes) using both public PBMC and arthritis-tissue datasets. c, rs11031006 was prioritized and connected to FSHB for multiple gynecological traits by using pituitary-derived single-cell multimodal dataset. The top four panels are GWAS regional plots similarly to a. ATAC–seq and SCENT tracks represent aggregated ATAC–seq tracks (top) and SCENT peaks (bottom with gray stripes). There were no SCENT peaks in cell types except for pituitary. d, ATAC–seq (top) and SCENT tracks (bottom) for IL10RA locus, where noncoding ClinVar variants (gray dots) colocalized with T cell SCENT track. e, ATAC–seq (top) and SCENT tracks (bottom) for CXCR4 locus, where somatic mutation hotspot for leukemia colocalized with T cell and myeloid cell SCENT tracks.

References

    1. Welter D et al. The NHGRI GWAS Catalog, a curated resource of SNP–trait associations. Nucleic Acids Res. 42, D1001–D1006 (2014). - PMC - PubMed
    1. Visscher PM et al. 10 years of GWAS discovery: biology, function, and translation. Am. J. Hum. Genet 101, 5–22 (2017). - PMC - PubMed
    1. Buniello A et al. The NHGRI-EBI GWAS Catalog of published genome-wide association studies, targeted arrays and summary statistics 2019. Nucleic Acids Res. 47, D1005–D1012 (2019). - PMC - PubMed
    1. Claussnitzer M et al. A brief history of human disease genetics. Nature 577, 179–189 (2020). - PMC - PubMed
    1. Plenge RM, Scolnick EM & Altshuler D Validating therapeutic targets through human genetics. Nat. Rev. Drug Discov 12, 581–594 (2013). - PubMed