. 2024 Apr 9;14(1):8329.
doi: 10.1038/s41598-024-57747-y.

Metabolomic profiling of cancer-related fatigue involved in cachexia and chemotherapy

Affiliations

Metabolomic profiling of cancer-related fatigue involved in cachexia and chemotherapy

Yuki Okinaka et al. Sci Rep. .

Abstract

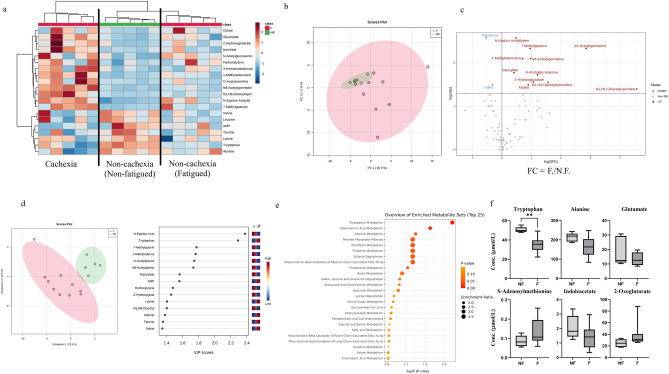
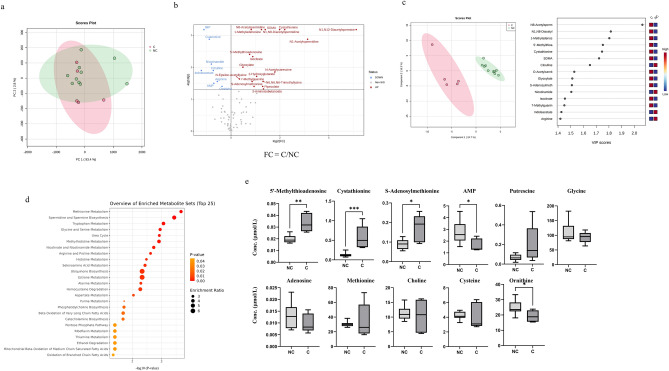
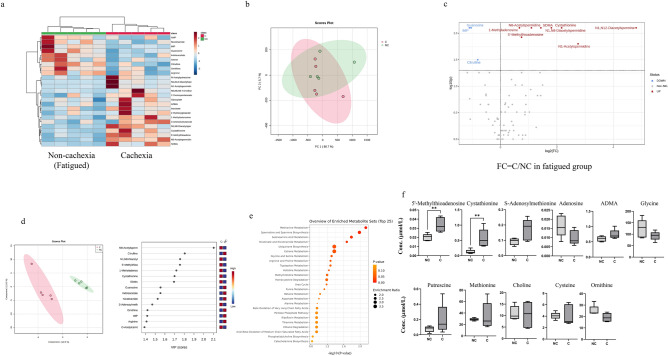
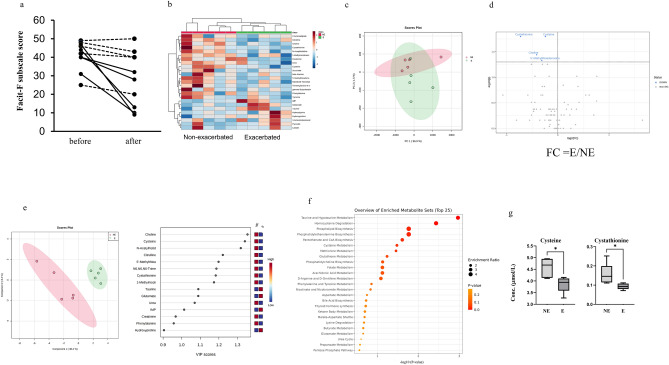
Patients with advanced cancer are frequently burdened with a severe sensation of fatigue called cancer-related fatigue (CRF). CRF is induced at various stages and treatments, such as cachexia and chemotherapy, and reduces the overall survival of patients. Objective and quantitative assessment of CRF could contribute to the diagnosis and prediction of treatment efficacy. However, such studies have not been intensively performed, particularly regarding metabolic profiles. Here, we conducted plasma metabolomics of 15 patients with urological cancer. The patients with and without fatigue, including those with cachexia or chemotherapy-induced fatigue, were compared. Significantly lower concentrations of valine and tryptophan were observed in fatigued patients than in non-fatigued patients. In addition, significantly higher concentrations of polyamine pathway metabolites were observed in patients with fatigue and cachexia than in those without cachexia. Patients with exacerbated fatigue due to chemotherapy showed significantly decreased cysteine and methionine metabolism before chemotherapy compared with those without fatigue exacerbation. These findings suggest that plasma metabolic profiles could help improve the diagnosis and monitoring of CRF.


Conflict of interest statement

The authors declare no competing interests.

Figures

Figure 1
Figure 1
Study design. (a) Patients were divided into non-fatigued (n = 5) and fatigued (n = 10) groups using the 13-item Functional Assessment of Chronic Illness Therapy-Fatigue (FACIT-F) scores. Further, patients in the fatigued group were divided into non-cachexia (n = 5) and cachexia (n = 5) groups using the definition of the cachexic condition. Two types of comparison in plasma metabolomic profiles were conducted: comparison 1, non-fatigued group vs. fatigued group; comparison 2, non-cachexia group vs. cachexia group. (b) All patients without cachexia underwent chemotherapy. Those patients were divided into exacerbated (n = 5) and non-exacerbated (n = 5) groups using the change in FACIT-F fatigue scores observed before and after chemotherapy. Comparison in plasma metabolomic profiles was conducted between the exacerbated fatigue group vs. the non-exacerbated fatigue group (comparison 3).
Figure 2
Figure 2
Plasma metabolites in the fatigued and non-fatigued groups. (a) Hierarchical clustering heatmap analysis of plasma metabolomic data. Metabolite concentrations were normalized by dividing each concentration value with the average concentration measured across all patients. Higher concentrations compared with that of the average were represented in red, lower concentrations in blue, and concentrations similar to that of the average represented in white. (b) Score plot of principal component analysis (PCA) of plasma metabolite. The contribution ratio of PC1 and PC2 were 26.5% and 17.8%, respectively. Red represents the fatigue group and green the non-fatigue group. (c) Volcano plots showing differences in metabolite concentrations between the fatigued and non-fatigued groups. The X- and Y-axes indicate the log2 fold change (fatigued/non-fatigued) and − log10 P-values (Mann–Whitney U test), respectively. (d) Score plots of partial least squares-discriminant analysis (PLS-DA) (left-hand figure). The X- and Y-axes indicate the first and second components. Quantile normalization was performed on each sample, followed by autoscaling of the metabolite concentrations to eliminate sample-dependent bias. Red represents the fatigue group and green the non-fatigue group. Variable importance in projection (VIP) scores showing the top 15 metabolites (right-hand figure). Higher concentrations compared with that of the average were represented in red and lower concentrations in blue. (e) Metabolic pathway-based analysis showing the top 25 enriched metabolite sets. The color intensity represents P-values, whereas the size of the circles represents the enrichment ratio. (f) Box plots of each metabolite concentration in the tryptophan metabolic pathway. Horizontal lines of the box indicate 0, 25, 50, 75, and 100% of the data. The Y-axis indicates metabolite concentrations (μM). *P < 0.05, **P < 0.01 (Mann–Whitney U test).
Figure 3
Figure 3
Plasma metabolites in the cachexia and non-cachexia groups. (a) Score plot of the principal component analysis (PCA) of plasma metabolites. Contribution ratio of PC1 and PC2 were 93.4% and 2.8%, respectively. Red represents the cachexia group and green the non-cachexia group. (b) Volcano plots showing differences in individual metabolite concentrations between the cachexia and non-cachexia groups. The X- and Y-axes indicate the log2 fold change (cachexia/non-cachexia) and − log10 P-values (Mann–Whitney U test), respectively. (c) Score plots of partial least squares-discriminant analysis (PLS-DA) (left-hand figure). The X- and Y-axes indicate the first and second components. Quantile normalization was performed on each sample, followed by autoscaling of the metabolite concentrations to eliminate sample-dependent bias. Red represents the cachexia group and green the non-cachexia group. Variable importance in projection (VIP) scores showing the top 15 metabolites (right-hand figure). Higher concentrations compared with that of the average were represented in red and lower concentrations in blue. (d) Metabolic pathway-based analysis showing the top 25 enriched metabolite sets. The color intensity represents P-values, whereas the size of the circles represents the enrichment ratio. (e) Box plots of each metabolite concentration in methionine metabolism and spermidine and spermine biosynthesis. Horizontal lines of the box indicate 0, 25, 50, 75, and 100% of the data. The Y-axis indicates metabolite concentrations (μM). C., cachexia group; N.C., non-cachexia group. *P < 0.05, **P < 0.01 (Mann–Whitney U test).
Figure 4
Figure 4
Plasma metabolites in the cachexia and non-cachexia groups with fatigue groups. (a) Hierarchical clustering heatmap analysis of plasma metabolomic data. Metabolite concentrations were normalized by dividing each concentration value with the average concentration measured across all patients. Higher concentrations compared with that of the average were represented in red, lower concentrations in blue, and concentrations similar to that of the average represented in white. (b) Score plot of the principal component analysis (PCA) of plasma metabolites. Contribution ratio of PC1 and PC2 were 88.7% and 5.7%, respectively. Red represents the cachexia group and green the non-cachexia with fatigue group. (c) Volcano plots showing differences in metabolite concentrations between the cachexia and non-cachexia with fatigue groups. The X- and Y-axes indicate the log2 fold change (cachexia/non-cachexia with fatigue) and –log10 P-values (Mann–Whitney U test), respectively. (d) Score plots of partial least squares-discriminant analysis (PLS-DA) (figure on the left). The X- and Y-axes indicate the first and second components. Quantile normalization was performed on each sample, followed by autoscaling of the metabolite concentrations to eliminate sample-dependent bias. Red represents the cachexia group and green the non-cachexia with fatigue group. Variable importance in projection (VIP) scores showing the top 15 metabolites (right-hand figure). Higher concentrations compared with that of the average were represented in red and lower concentrations in blue. (e) Metabolic pathway-based analysis showing the top 25 enriched metabolite sets. The color intensity represents P-values, whereas the size of the circles represents the enrichment ratio. (f) Box plots of each metabolite concentration in methionine metabolism and spermidine and spermine biosynthesis. Horizontal lines of the box indicate 0, 25, 50, 75, and 100% of the data. The Y-axis indicates metabolite concentrations (μM). C., cachexia group; N.C., non-cachexia with fatigue group. *P < 0.05, **P < 0.01 (Mann–Whitney U test).
Figure 5
Figure 5
Plasma metabolites in the exacerbated and non-exacerbated groups in chemotherapy. (a) The 13-item Functional Assessment of Chronic Illness Therapy-Fatigue (FACIT-F) subscale scores. Grey broken lines indicate data in the non-exacerbated group (n = 5) and black bold lines indicate those in the exacerbated group (n = 5). (b) Hierarchical clustering heatmap analysis of the plasma metabolomic data. Metabolite concentrations were normalized by dividing each concentration value with the average concentration measured across all patients. Higher concentrations compared with those of the average were represented in red, lower concentrations in blue, and concentrations similar to that of the average represented in white. (c) Score plot of the principal component analysis (PCA) of plasma metabolites. Contribution ratio of PC1 and PC2 were 96.9% and 1.5%, respectively. Red represents the exacerbated group and green the non-exacerbated group. (d) Volcano plots showing differences in metabolite concentrations between the exacerbated and non-exacerbated groups. The X- and Y-axes indicate the log2 fold change (exacerbated/non-exacerbated) and − log10 P-values (Mann–Whitney U test), respectively. (e) Score plots of partial least squares-discriminant analysis (PLS-DA) (left-hand figure). The X- and Y-axes indicate the first and second components. Quantile normalization was performed on each sample, followed by autoscaling of the metabolite concentrations to eliminate sample-dependent bias. Red represents the exacerbated group and green the non-exacerbated group. Variable importance in projection (VIP) scores showing the top 15 metabolites (right-hand figure). Higher concentrations compared with that of the average were represented in red and lower concentrations in blue. (f) Metabolic pathway-based analysis showing the top 25 enriched metabolite sets. The color intensity represents P-values, whereas the size of the circles represents the enrichment ratio. (g) Box plots of each metabolite concentration in homocysteine degradation. Horizontal lines of the box indicate 0, 25, 50, 75, and 100% of the data. The Y-axis indicates metabolite concentrations (μM). E., exacerbated group; N.E., non-exacerbated group.

Similar articles

  • The Black Book of Psychotropic Dosing and Monitoring.
    DeBattista C, Schatzberg AF. DeBattista C, et al. Psychopharmacol Bull. 2024 Jul 8;54(3):8-59. Psychopharmacol Bull. 2024. PMID: 38993656 Free PMC article. Review.
  • Systemic treatments for metastatic cutaneous melanoma.
    Pasquali S, Hadjinicolaou AV, Chiarion Sileni V, Rossi CR, Mocellin S. Pasquali S, et al. Cochrane Database Syst Rev. 2018 Feb 6;2(2):CD011123. doi: 10.1002/14651858.CD011123.pub2. Cochrane Database Syst Rev. 2018. PMID: 29405038 Free PMC article.
  • Cardiovascular training for fatigue in people with cancer.
    Wagner C, Ernst M, Cryns N, Oeser A, Messer S, Wender A, Wiskemann J, Baumann FT, Monsef I, Bröckelmann PJ, Holtkamp U, Scherer RW, Mishra SI, Skoetz N. Wagner C, et al. Cochrane Database Syst Rev. 2025 Feb 20;2(2):CD015517. doi: 10.1002/14651858.CD015517. Cochrane Database Syst Rev. 2025. PMID: 39976199
  • Corticosteroids for the management of cancer-related fatigue in adults with advanced cancer.
    Sandford A, Haywood A, Rickett K, Good P, Khan S, Foster K, Hardy JR. Sandford A, et al. Cochrane Database Syst Rev. 2023 Jan 23;1(1):CD013782. doi: 10.1002/14651858.CD013782.pub2. Cochrane Database Syst Rev. 2023. PMID: 36688471 Free PMC article.
  • Yoga for fatigue in people with cancer.
    Messer S, Oeser A, Wagner C, Wender A, Cryns N, Scherer RW, Mishra SI, Monsef I, Holtkamp U, Andreas M, Bröckelmann PJ, Ernst M, Skoetz N. Messer S, et al. Cochrane Database Syst Rev. 2025 May 27;5(5):CD015520. doi: 10.1002/14651858.CD015520. Cochrane Database Syst Rev. 2025. PMID: 40421669 Review.

Cited by

References

    1. Berger AM, et al. Cancer-related fatigue, version 2.2015. J. Natl. Compr. Cancer Netw. 2015;13:1012–1039. doi: 10.6004/jnccn.2015.0122. - DOI - PMC - PubMed
    1. Stewart GD, Skipworth RJ, Fearon KC. Cancer cachexia and fatigue. Clin. Med. (Lond.) 2006;6:140–143. doi: 10.7861/clinmedicine.6-2-140. - DOI - PMC - PubMed
    1. Ahlberg K, Ekman T, Gaston-Johansson F, Mock V. Assessment and management of cancer-related fatigue in adults. Lancet. 2003;362:640–650. doi: 10.1016/S0140-6736(03)14186-4. - DOI - PubMed
    1. Ebede CC, Jang Y, Escalante CP. Cancer-related fatigue in cancer survivorship. Med. Clin. North Am. 2017;101:1085–1097. doi: 10.1016/j.mcna.2017.06.007. - DOI - PubMed
    1. Hofman M, Ryan JL, Figueroa-Moseley CD, Jean-Pierre P, Morrow GR. Cancer-related fatigue: The scale of the problem. Oncologist. 2007;12(Suppl 1):4–10. doi: 10.1634/theoncologist.12-S1-4. - DOI - PubMed