. 2024 May;16(5):717-726.
doi: 10.1038/s41557-024-01493-1. Epub 2024 Apr 9.

Bioorthogonal masked acylating agents for proximity-dependent RNA labelling

Affiliations

Bioorthogonal masked acylating agents for proximity-dependent RNA labelling

Shubhashree Pani et al. Nat Chem. 2024 May.

Abstract

RNA localization is highly regulated, with subcellular organization driving context-dependent cell physiology. Although proximity-based labelling technologies that use highly reactive radicals or carbenes provide a powerful method for unbiased mapping of protein organization within a cell, methods for unbiased RNA mapping are scarce and comparably less robust. Here we develop α-alkoxy thioenol and chloroenol esters that function as potent acylating agents upon controlled ester unmasking. We pair these probes with subcellular-localized expression of a bioorthogonal esterase to establish a platform for spatial analysis of RNA: bioorthogonal acylating agents for proximity labelling and sequencing (BAP-seq). We demonstrate that, by selectively unmasking the enol probe in a locale of interest, we can map RNA distribution in membrane-bound and membrane-less organelles. The controlled-release acylating agent chemistry and corresponding BAP-seq method expand the scope of proximity labelling technologies and provide a powerful approach to interrogate the cellular organization of RNAs.


Conflict of interest statement

Competing interests

B.C.D. is a founder and holds equity in Tornado Bio, Inc. The other authors declare no competing interests.

Figures

Extended Data Fig. 1 |
Extended Data Fig. 1 |. Measurement of the kinetics of mCP-coumarin unmasked by 5 nM of BS2 esterase.
a, Schematic of synthesis of mCP-coumarin and the unmasking reaction by BS2. b, Linear range of mCP ester unmasking measured with different concentrations of mCP-coumarin incubation. Y-axis represents the normalized concentration of coumarin generated from mCP unmasking. Error bars represent the standard deviation of the mean, n = 3 independent in vitro reactions. c, Michaelis-Menten plot showing the rate of mCP unmasking as a function of the substrate (mCP-coumarin) concentration. Error bars represent the standard deviation of the mean n = 3 independent in vitro reactions, and the curve represents the best fit. d, Kinetic parameters obtained by Michaelis-Menten plot of BS2 unmasking mCP-coumarin. All plots and curve fit were made using GraphPad Prism. Error bars represent the standard deviation, n = 3 independent in vitro reactions.
Extended Data Fig. 2 |
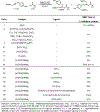
Extended Data Fig. 2 |. Optimization of catalyst conditions for regioselective carboxylic acid addition to synthesize α-alkoxy thioenol esters.
Silver-based catalysts yielded more than 90% of the undesired 1,2-addition product (entry 1). The screening of various metal catalysts revealed the iridium catalyst could provide desired 1,1-addition product (entries 2–8), especially the [Ir(OMe) (COD)]2. Further screening of several ligands suggested the ligand has minimal effects on yield (entries 9–16).
Extended Data Fig. 3 |
Extended Data Fig. 3 |. Confocal microscopy images showing BS2 dependent proximity labelling by AC-2 probe in the nucleus.
BS2 with NLS and V5 tag was transiently expressed in HEK293T cells, and the expression was visualized with V5 antibody; labelling activity was visualized after click reaction with azide-Alexa488. DAPI is a nuclear marker. The scale bar on Brightfield images is 10 μm.
Extended Data Fig. 4 |
Extended Data Fig. 4 |. Confocal microscopy images showing BS2 dependent proximity labelling by AC-2 probe in the cytosol.
BS2 with nuclear export signal (NES) and V5 tag was transiently expressed in HEK293T cells, and the expression was visualized with V5 antibody; labelling activity was visualized after click reaction with azide-Alexa488. DAPI is a nuclear marker. The scale bar on Brightfield images is 10 μm.
Extended Data Fig. 5 |
Extended Data Fig. 5 |. Confocal microscopy images showing BS2 dependent proximity labelling by AC-2 probe in the ERM.
BS2 with outer ER membrane localization via ER transmembrane anchor facing the cytosol was transiently expressed in HEK293T cells, and the expression was visualized with V5 antibody; labelling activity was visualized after click reaction with azide-Alexa488. DAPI is a nuclear marker. The scale bar on Brightfield images is 10 μm.
Extended Data Fig. 6 |
Extended Data Fig. 6 |. Confocal microscopy images showing BS2 dependent proximity labelling by AC-2 probe in the mitochondria.
BS2 with MTS-matrix (Mitochondria Targeting Signal) and V5 tag was transiently expressed in HEK293T cells, and the expression was visualized with V5 antibody; labelling activity was visualized after click reaction with azide-Alexa488. DAPI is a nuclear marker. The scale bar on Brightfield images is 10 μm.
Extended Data Fig. 7 |
Extended Data Fig. 7 |. Confocal microscopy images showing BS2 dependent proximity labelling by AC-2 probe in the nucleolus.
BS2 with nucleolar localization via three tandem nucleolar targeting sequences from NF-κB-inducing kinase (NIK) and V5 tag was transiently expressed in HEK293T cells, and the expression was visualized with V5 antibody; labelling activity was visualized after click reaction with azide-Alexa488. DAPI is a nuclear marker. The scale bar on Brightfield images is 10 μm.
Extended Data Fig. 8 |
Extended Data Fig. 8 |. Confocal microscopy images showing BS2 dependent proximity labelling by AC-2 probe in the nuclear pore.
BS2 fused with SENP2 protein and V5 tag was transiently expressed in HEK293T cells, and the expression was visualized with V5 antibody; labelling activity was visualized after click reaction with azide-Alexa488. DAPI is a nuclear marker. The scale bar on Brightfield images is 10 μm.
Extended Data Fig. 9 |
Extended Data Fig. 9 |. Enrichment of BS2 proximal RNA post AC-2 labelling.
a, Bioanalyzer quantification of enriched RNAs post AC-2 labelling. 25 μg of input RNA was taken for each sample for the enrichment, and the experiment was performed with 2 biological replicates. b, Principal component analysis (PCA) analysis of gene expression values for different samples of BAP-seq, n = 2–3 biological replicates. c, Comparison of sequencing counts post differentially expressed gene (DEG) analysis for Mt-genes across different compartments, n = 2 biological replicates. d, Comparison of intronic reads across different samples Numbers are presented as a percentage of total reads that includes exons and intergenic regions. Error bars represent the standard deviation of mean, n = 2 biological replicates. P-value was determined by two-tailed unpaired t-tests with Welch’s correction. ** represents p-value < 0.01 (p = 0.0099) and *** represents p-value < 0.001 (p = 0.0006).
Fig. 1 |
Fig. 1 |. Conceptual framework for a biomolecular labelling strategy using masked acylation agents.
A masked acylation agent is unreactive towards biomolecules. Selective unmasking by BS2 esterase through cleavage of a bioorthogonal mCP ester mask releases an enol, which rapidly tautomerizes to a carbonyl, the acylating agent. Nucleophilic biomolecules react with the acylating agent and form a covalent bond, which installs a visualization or affinity handle onto the target biomolecule. NBD, nitrobenzoxadiazole.
Fig. 2 |
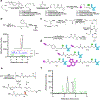
Fig. 2 |. Synthetic design and validation of masked acylating probes.
a, Key synthetic steps for the synthesis of TE probes. b, The unmasking reaction of TE-1 by BS2 yields the predicted thioester product, as confirmed by LC–MS. c, The synthetic scheme for the AC probes. d, The structure of all the AC probes. The leaving groups are highlighted in green, the bioorthogonal BS2 recognition site is highlighted in blue and the functional handle is highlighted in purple. e, The unmasking reaction of AC-5 by BS2 in the presence of a nucleophilic substrate (Fmoc–Lys–OMe) yields the predicted amide product. The newly formed bond is highlighted in red. f, The LC–MS trace of the reaction shown in e. mAu, milli-absorbance units; n-BuLi, n-butyllithium; TMEDA, tetramethylethylenediamine; DCE, 1,2-dichloroethane; DIAD, diisopropyl azodicarboxylate; DPPA, diphenylphosphoryl azide; THF, tetrahydrofuran; PhSSPh, phenyl disulfide; PhSH, thiophenol; DIBAL-H, diisobutylaluminum hydride; EDCI, N-ethyl-N′-(3-dimethylaminopropyl)carbodiimide hydrochloride; DMAP, 4-(dimethylamino) pyridine; DMF, N,N-dimethylformamide.
Fig. 3 |
Fig. 3 |. Comparison of nuclear proximity labelling in live cells across all the AC and TE probes.
a, Representative fluorescence images of HEK293T cells transiently transfected with a vector expressing an NLS–BS2 esterase construct, then treated with 25 μM of the indicated probes for 10 min. Probe localization, corresponding to labelled sites, is shown in green (via click-chemistry installation of Alexa-488), BS2 is shown in red (via immunofluorescence) and nuclear DAPI staining is shown in blue. Scale bars, 10 μm. b, Quantification of probe labelling from images in a. The data are shown as the mean ± standard deviaition from n = 4 images per probe. c, Detail of AC-2-treated cells, showing the inset outlined in a.
Fig. 4 |
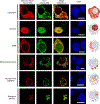
Fig. 4 |. AC-2 labelling is restricted to the vicinity of BS2 expression across multiple compartments.
Representative confocal images of HEK293T cells expressing BS2 in the cytosol, nucleus, ERM, mitochondrial matrix, nuclear pore or nucleolus, as indicated in the schematics on the right. All cells were treated with 25 μM of AC-2 for 10 min. Probe localization, corresponding to sites labelled via click-chemistry installation of Alexa-488, is shown in green. BS2 is shown in red (via immunofluorescence), and nuclear DAPI staining is shown in blue. Scale bars, 10 μm.
Fig. 5 |
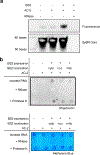
Fig. 5 |. AC probes label RNA in vitro and in cells.
a, A total of 2.5 μM of a 74-mer RNA was treated with 500 μM AC-5 and 600 nM BS2 for 5 min; then RNA labelling was analysed via fluorescent gel electrophoresis. SYBR Gold shows the amount of RNA loaded across all samples. The experiment was repeated twice independently, showing similar results. b, Dot blot showing BS2-dependent RNA labelling by AC-2 when BS2 is expressed in the cytosol, nucleus and mitochondria. HEK293T cells were transfected with a control vector or a vector expressing BS2 in the cytoplasm, nucleus or mitochondria, then treated with 25 μM AC-2 for 10 min, followed by lysis, RNA isolation and click chemistry to install biotin on labelled RNAs. RNA labelling was analysed via dot blot with 500 ng of isolated RNA using a streptavidin-conjugated horseradish peroxidase antibody. The methylene blue blot shows the amount of RNA loaded across all samples. For RNase- or protease-treated samples, RNA was treated with 85 μg ml−1 of RNase A or 85 μg ml−1 of proteinase K for 15 min, purified and then blotted on the same membrane.
Fig. 6 |
Fig. 6 |. BS2-dependent proximity labelling of RNA using AC-2 paired with quantitative sequencing provides an unbiased spatial transcriptomic map.
a, The schematic workflow of BAP-seq. b, A volcano plot depicting the enrichment of mitochondrial transcripts via BAP-seq in cells expressing mitochondrial BS2, compared with cells expressing BS2 in the cytoplasm with cut-offs of log2(fold change) >0.75 and adjusted P value <0.05. c, A volcano plot depicting the enrichment of mitochondrial transcripts via BAP-seq in cells expressing nuclear BS2, as compared with cells expressing BS2 in the cytoplasm with cut-offs of log2(fold change) >0.75 and adjusted P value <0.05. d, A volcano plot depicting the enrichment of mitochondrial transcripts via BAP-seq in cells expressing BS2 in the nucleolus, as compared with the nucleus with cut-offs of log2(fold change) >0.75 and adjusted P value <0.05. In b–d, the horizontal dashed line indicates adjusted P value = 0.05. The vertical dashed line indicates log2(fold change) = 0.75 or −0.75. The enrichment values were obtained from DEG analysis using Limma. FDR, false discovery rate.

References

    1. Keskin O, Tuncbag N & Gursoy A Predicting protein–protein interactions from the molecular to the proteome level. Chem. Rev. 116, 4884–4909 (2016). - PubMed
    1. Hentze MW, Castello A, Schwarzl T & Preiss T A brave new world of RNA-binding proteins. Nat. Rev. Mol. Cell Biol. 19, 327–341 (2018). - PubMed
    1. Engreitz JM, Ollikainen N & Guttman M Long non-coding RNAs: spatial amplifiers that control nuclear structure and gene expression. Nat. Rev. Mol. Cell Biol. 17, 756–770 (2016). - PubMed
    1. Rinn J & Guttman M RNA function. RNA and dynamic nuclear organization. Science 345, 1240–1241 (2014). - PMC - PubMed
    1. Tiruchinapalli DM et al. Activity-dependent trafficking and dynamic localization of zipcode binding protein 1 and beta-actin mRNA in dendrites and spines of hippocampal neurons. J. Neurosci. 23, 3251–3261 (2003). - PMC - PubMed

Publication types