. 2024 Apr 9;14(1):8315.
doi: 10.1038/s41598-024-58985-w.

Characterization of the gut bacterial and viral microbiota in latent autoimmune diabetes in adults

Affiliations

Characterization of the gut bacterial and viral microbiota in latent autoimmune diabetes in adults

Casper S Poulsen et al. Sci Rep. .

Abstract

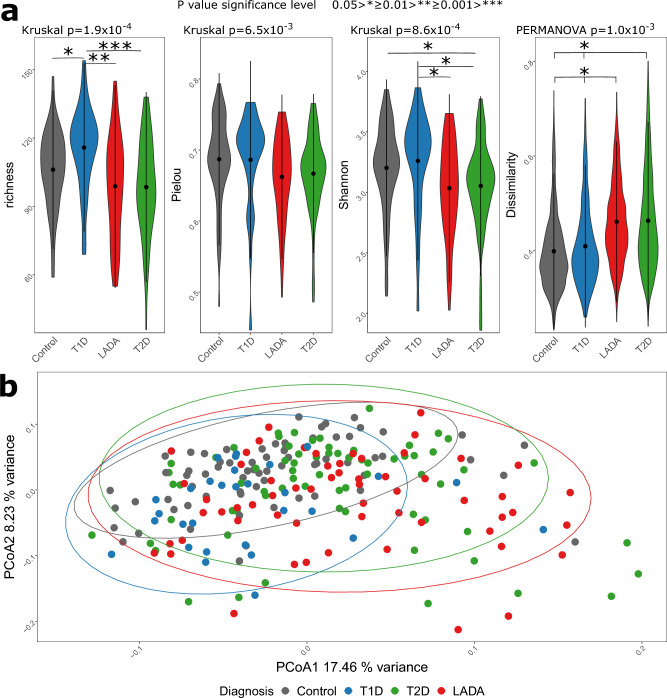
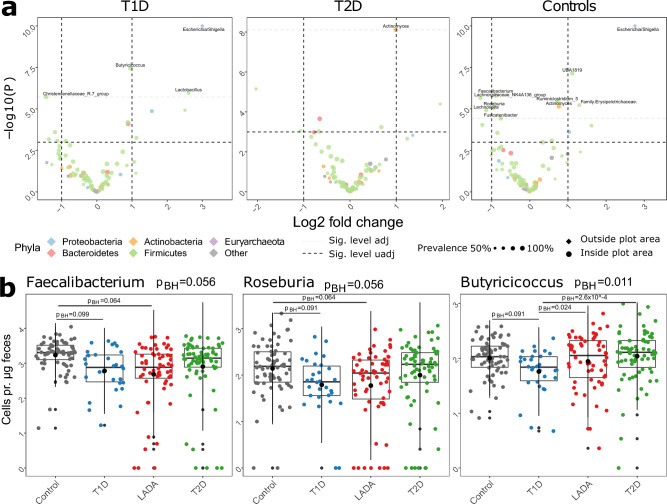
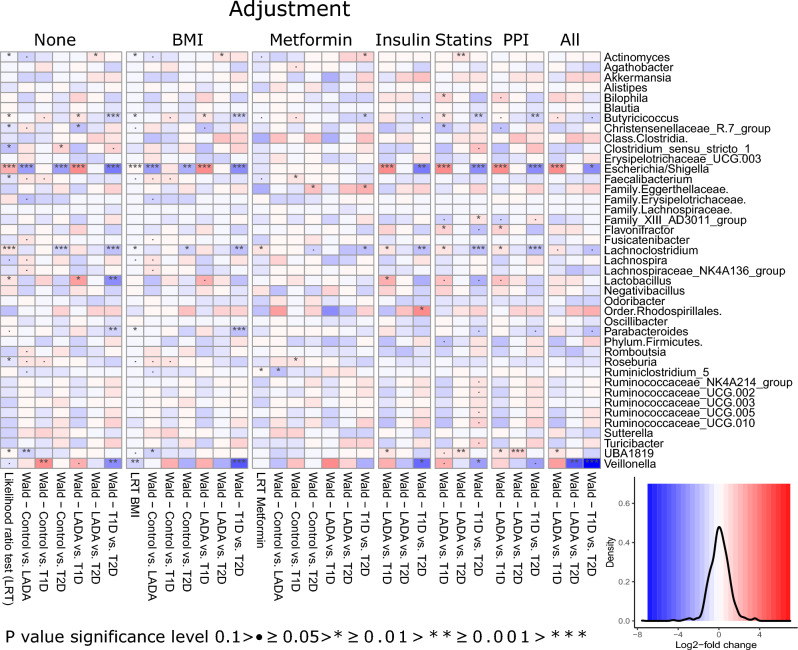
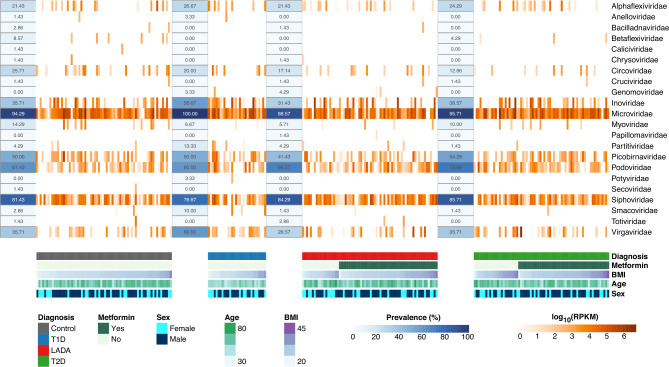
Latent autoimmune diabetes in adults (LADA) is a heterogeneous disease characterized by autoantibodies against insulin producing pancreatic beta cells and initial lack of need for insulin treatment. The aim of the present study was to investigate if individuals with LADA have an altered gut microbiota relative to non-diabetic control subjects, individuals with type 1 diabetes (T1D), and individuals with type 2 diabetes (T2D). Bacterial community profiling was performed with primers targeting the variable region 4 of the 16S rRNA gene and sequenced. Amplicon sequence variants (ASVs) were generated with DADA2 and annotated to the SILVA database. The gut virome was sequenced, using a viral particle enrichment and metagenomics approach, assembled, and quantified to describe the composition of the viral community. Comparison of the bacterial alpha- and beta-diversity measures revealed that the gut bacteriome of individuals with LADA resembled that of individuals with T2D. Yet, specific genera were found to differ in abundance in individuals with LADA compared with T1D and T2D, indicating that LADA has unique taxonomical features. The virome composition reflected the stability of the most dominant order Caudovirales and the families Siphoviridae, Podoviridae, and Inoviridae, and the dominant family Microviridae. Further studies are needed to confirm these findings.


Conflict of interest statement

The authors declare no competing interests.

Figures

Figure 1
Figure 1
Exploration of differences between diagnostic groups investigating alpha and beta-diversity parameters (a), and by PCoA (b). Alpha-diversity was visualized with violin plots and included richness, Pielou’s evenness, and Shannon diversity. A non-parametric overall comparison of diagnostic groups was performed using the Kruskal–Wallis test. If significant, a follow-up pairwise comparison of groups was performed with the Mann–Whitney test and p-values were Bonferroni corrected. Bray–Curtis dissimilarity calculated from Hellinger transformed total sum scaled data was used as beta-diversity measure and the violin plot represented the within group variation. PERMANOVA was used to compare all diagnostic groups and follow-up pairwise comparison of diagnostic groups where p-values were Bonferroni corrected. PCoA were used to visualize dissimilarities of all samples. Variance explained by the first two axes were included in their labels. Violin plots of beta-diversity represented within diagnostic group dissimilarity.
Figure 2
Figure 2
Differences in specific genera observed between diagnostic groups, Volcano plot showing results from the differential abundance analysis (a), and boxplots of selected genera (b). Differential abundance tests were performed with cell counts as normalization factors in DESeq2 performing both likelihood ratio test, comparing all diagnostic groups, and a Wald test to make pairwise comparisons between diagnostic groups. p-values in the Wald test were Benjamini–Hochberg corrected.
Figure 3
Figure 3
Heatmap of DESeq test results comparing across all groups using the likelihood ratio test implementation (LRT) and comparing diagnostic groups pairwise using Wald test. Analysis included adjustment for BMI, use of anti-diabetic medication (insulin, statins, PPI), and all of the mentioned covariates. Adjustment for metformin was analogous to the overall analysis scheme by removing samples from individuals treated with metformin. The first specified diagnostic group is the reference for the DESeq test in the Wald test. A density plot of the effect sizes (log2fold change) is included with the same color key used in the heatmap. Genera with the lowest p-value in the LRT without adjustment were included, but Log2fold changes and p-values from all genera comparison are provided in Supplementary Table 1. The heatmap was generated with the R package pheatmap with layout adjustments performed in inkscape.
Figure 4
Figure 4
Heatmap of virome abundance and prevalence. The abundance of 22 taxonomic families is represented in log10(RPKM) and grouped by diagnosis. The prevalence represents the percentage of individuals in one group where the virus could be identified. The sex and usage of metformin are observed as qualitative information, while BMI (kg/m2) and age (years) are pictured as a quantitative colormap. The heatmap was generated with the R package pheatmap with layout adjustments performed in illustrator.

Similar articles

References

    1. Tuomi T, et al. The many faces of diabetes: A disease with increasing heterogeneity. Lancet. 2014;383:1084–1094. doi: 10.1016/S0140-6736(13)62219-9. - DOI - PubMed
    1. Tuomi T, et al. Clinical and genetic characteristics of type 2 diabetes with and without GAD antibodies. Diabetes. 1999;48:150–157. doi: 10.2337/diabetes.48.1.150. - DOI - PubMed
    1. Zinman B, et al. Phenotypic characteristics of GAD antibody-positive recently diagnosed patients with type 2 diabetes in North America and Europe. Diabetes. 2004;53:3193–3200. doi: 10.2337/diabetes.53.12.3193. - DOI - PubMed
    1. Hawa MI, et al. Metabolic syndrome and autoimmune diabetes: Action LADA 3. Diabetes Care. 2009;32:160–164. doi: 10.2337/dc08-1419. - DOI - PMC - PubMed
    1. Andersen MK, et al. Latent autoimmune diabetes in adults differs genetically from classical type 1 diabetes diagnosed after the age of 35 years. Diabetes Care. 2010;33:2062–2064. doi: 10.2337/dc09-2188. - DOI - PMC - PubMed

MeSH terms