. 2024 Jun;31(6):738-752.
doi: 10.1038/s41418-024-01292-8. Epub 2024 Apr 9.

IFI35 regulates non-canonical NF-κB signaling to maintain glioblastoma stem cells and recruit tumor-associated macrophages

Affiliations

IFI35 regulates non-canonical NF-κB signaling to maintain glioblastoma stem cells and recruit tumor-associated macrophages

Daqi Li et al. Cell Death Differ. 2024 Jun.

Abstract

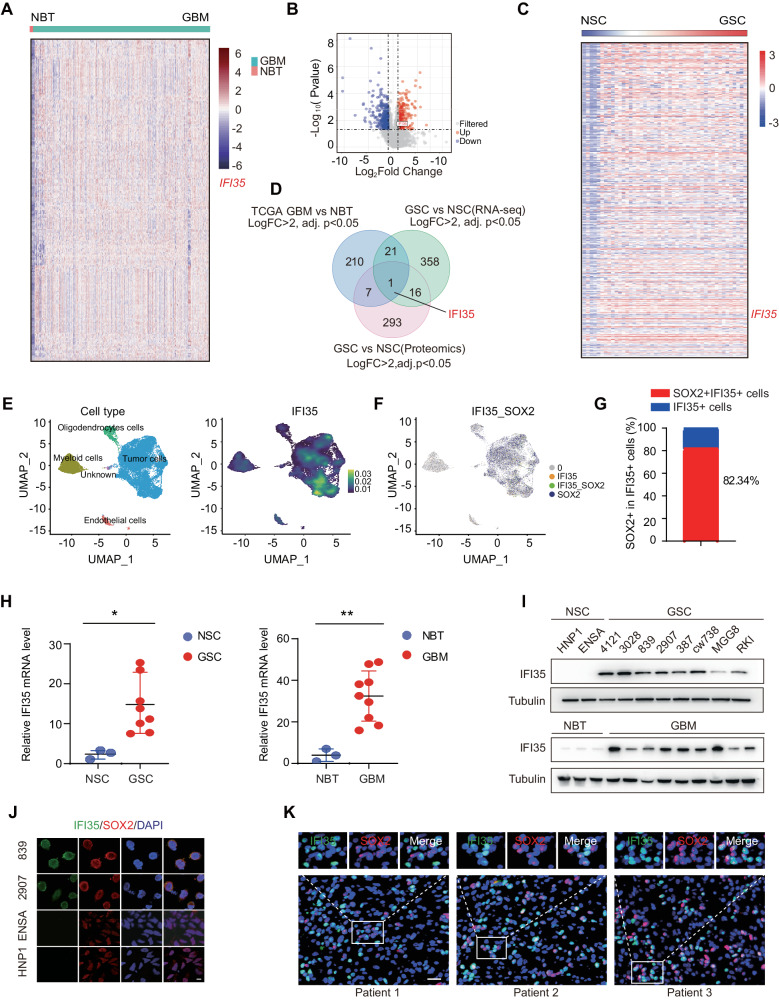
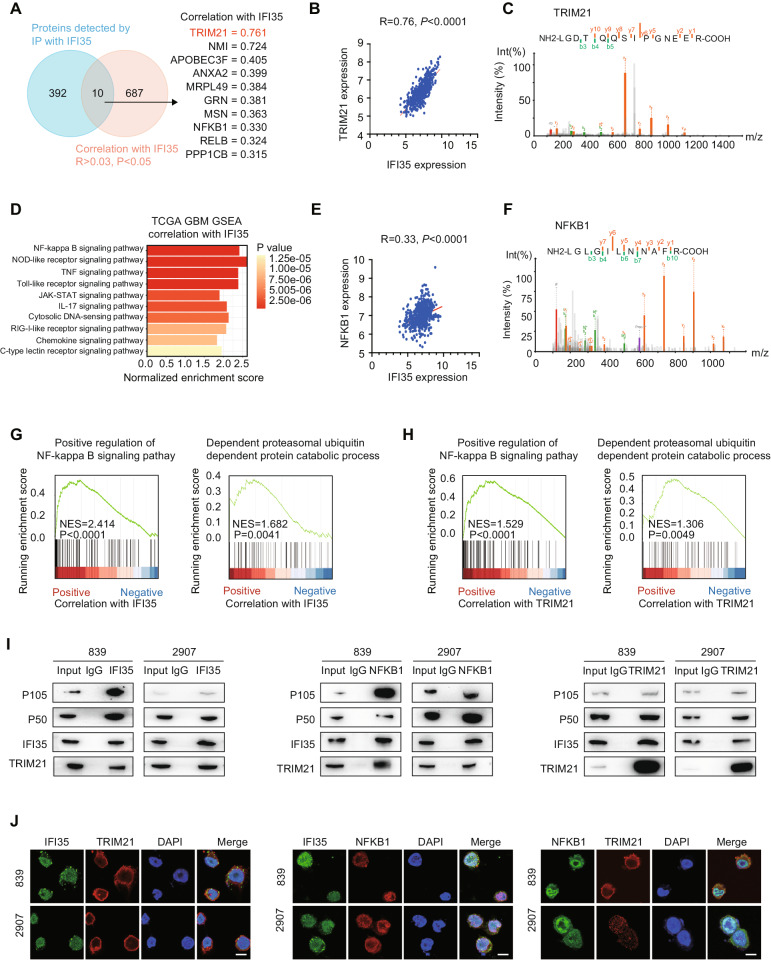
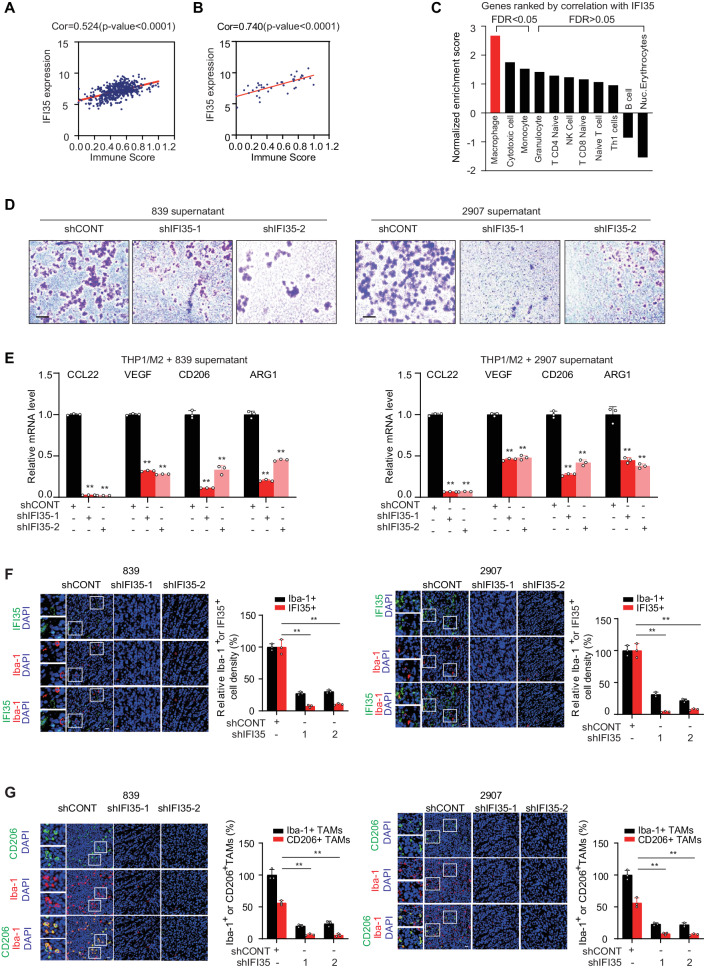
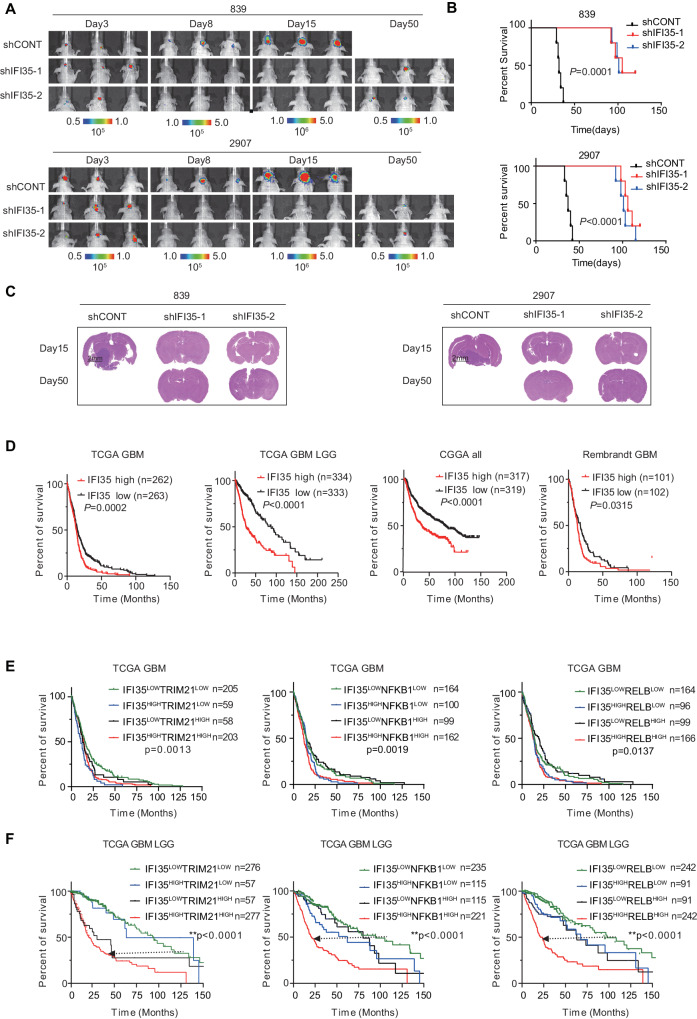
Glioblastoma (GBM) is the most aggressive malignant primary brain tumor characterized by a highly heterogeneous and immunosuppressive tumor microenvironment (TME). The symbiotic interactions between glioblastoma stem cells (GSCs) and tumor-associated macrophages (TAM) in the TME are critical for tumor progression. Here, we identified that IFI35, a transcriptional regulatory factor, plays both cell-intrinsic and cell-extrinsic roles in maintaining GSCs and the immunosuppressive TME. IFI35 induced non-canonical NF-kB signaling through proteasomal processing of p105 to the DNA-binding transcription factor p50, which heterodimerizes with RELB (RELB/p50), and activated cell chemotaxis in a cell-autonomous manner. Further, IFI35 induced recruitment and maintenance of M2-like TAMs in TME in a paracrine manner. Targeting IFI35 effectively suppressed in vivo tumor growth and prolonged survival of orthotopic xenograft-bearing mice. Collectively, these findings reveal the tumor-promoting functions of IFI35 and suggest that targeting IFI35 or its downstream effectors may provide effective approaches to improve GBM treatment.


Conflict of interest statement

The authors declare no competing interests.

Figures

Fig. 1
Fig. 1. IFI35 is upregulated in GBM and GSCs compared with non-tumors and NSCs.
A Heatmap of differentially expressed genes (average change more than fourfold, adjusted P value < 0.05) in 528 GBMs and 10 non-tumors (TCGA_GBM HG-U133A). B Volcano plot of differentially expressed genes in eight GSCs and two NSCs using quantifies proteome sequence. As indicated by the dotted lines, cutoff was set as fold change >4, adjusted P value < 0.05. C Heatmap of differentially expressed genes (average change more than fourfold, adjusted P value < 0.05) in 41 GSCs and 5 NSCs using RNA sequencing [18]. D Venn diagram shows the overlap of TCGA GBM dataset, proteomics data of GSCs and NSCs, and RNA sequencing for GSCs and NSCs analysis for the genes. E Annotated cell clusters were visualized in a uniform manifold approximation and projection (UMAP) representation derived from GSE141383. F The overlap of IFI35 and SOX2 positive cells with analysis of single-cell RNA-seq of GEO database (GSE141383). G Quantitation of IFI35 and SOX2 positive cells with analysis of single-cell RNA-seq of GEO database (GSE141383). H qRT-PCR quantification of IFI35 mRNA levels in GSCs and NSCs (left), glioblastomas and normal brain tissues (right). Data were determined by unpaired t test and shown as mean ± SD. *P < 0.05, **P < 0.01. I Protein levels of IFI35 were assessed by immunoblotting in NSCs (HNP1 and ENSA) and GSCs (4121, 3028, 839, 2907, 387, CW738, MGG8, and RKI) (top), glioblastoma and normal brain tissue (bottom). J Immunofluorescent staining of IFI35 (green) and SOX2 (red) in 839 and 2907 GSCs and matched ENSA and HNP1 NSCs. Scale bar, 10 μm. K Immunofluorescent staining shows the fraction of IFI35+ cells in SOX2+ cells in GBM patients from glioblastoma specimens. Scale bar, 50 μm.
Fig. 2
Fig. 2. IFI35 promotes GSC proliferation and self-renewal.
A IFI35 mRNA levels were assayed by qRT-PCR in GSCs with IFI35 knockdown using two independent shRNAs. A shCONT was used as the control. Data were determined by ANOVA and shown as mean ± SD from three independent experiments. **P < 0.01. B The protein levels of IFI35 after transduction in 839 and 2907 GSCs with two independent shRNAs. A shCONT was used as the control. Two independent shRNAs targeting IFI35 decreased the growth and self-renewal of GSCs compared with shCONT, as measured by cell number count (C), CellTiter-Glo assay (D), and sphere number quantification (E). Data are presented as mean ± SD from six independent experiments. **P < 0.01, one-way ANOVA with Dunnett’s multiple-comparison test. F The extreme limiting dilution assays revealed that knockdown of IFI35 in 839 (top) and 2907 (bottom) decreased the sphere formation. **P < 0.01. G, H Representative images of neurospheres of 839 and 2907 expressing shCONT, shIFI35-1, or shIFI35-2. Scale bar, 100 μm. Each image is representative of at least six independent experiments. I Overexpression of IFI35 increased the growth of 839 and 2907 GSCs compared with vector. Results were measured by a CellTiter-Glo assay. Data were determined. Data are presented as mean ± SD from six independent experiments. *P < 0.05, **P < 0.01, one-way ANOVA with Dunnett’s multiple-comparison test. J Overexpression of IFI35 rescued the decreased GSC growth caused by shRNA-mediated knockdown. Results were measured by a CellTiter-Glo assay. Data are presented as mean ± SD from six independent experiments. **P < 0.01, one-way ANOVA with Dunnett’s multiple-comparison test.
Fig. 3
Fig. 3. IFI35 interacts with TRIM21 to regulate NF-κB signaling pathway.
A Venn diagram shows the overlap of proteins identified by immunoprecipitation followed by mass spectrometry using anti-IFI35 antibody from cell lysates of 839 GSC and correlation with IFI35 in TCGA GBM dataset. B The correlation analysis of IFI35 with TRIM21 in TCGA GBM dataset. C Representative peptide of TRIM21 identified by immunoprecipitation followed by mass spectrometry using anti-IFI35 antibody in 839 GSC cell lysates. D Top 10 of KEGG signaling pathway enrichment analysis related with IFI35 expression in TCGA GBM dataset. E The correlation analysis of IFI35 with NFKB1 in TCGA GBM dataset. F Representative peptide of NFKB1 identified by immunoprecipitation followed by mass spectrometry using anti-IFI35 antibody in 839 GSC cell lysates. Gene Set Enrichment Analysis (GSEA) using Gene Ontology (GO) gene sets showing IFI35 (G) and TRIM21 (H) expression correlates with a transcriptional signature of positive regulation of NF-κB signaling and dependent proteasomal ubiquitin dependent protein catabolic process signaling in TCGA GBM dataset. I Immunoblot of immunoprecipitation with anti-IFI35, anti-NFKB1, anti-TRIM21 antibody in 839 and 2907 GSCs. The nonspecific IgG is the control. J The confocal image of IFI35, NFKB1, and TRIM21 distribution in 839 and 2907 GSCs. Scale bar, 10 μm.
Fig. 4
Fig. 4. IFI35-TRIM21 complex mediates NFKB1 P105 processing through K48-linked ubiquitin chain.
A qRT-PCR analysis of NFKB1 mRNA expression in 839 and 2907 GSCs after transduction with shCONT, shIFI35 (left), or shTRIM21 (right). Data are presented as mean ± SD from three independent experiments. B Immunoblot analysis of IFI35, TRIM21, and NFKB1 levels in 839 and 2907 GSCs transduced with control shRNA, shIFI35 (left), or shTRIM21 (right). C 839 and 2907 GSCs expressing shCONT, shIFI35, or shTRIM21 were treated with 100 μg/ml CHX, harvested at the indicated times, and then subjected to immunoblot with antibodies against IFI35, TRIM21, and NFKB1. D, E 839 and 2907 GSCs were transduced with HA-IFI35 or HA-TRIM21, His-Ub and treated with 20 μM MG132 for 8 h. Extracts were immunoprecipitated with anti-NFKB1 antibody, followed by immunoblotting. F 839 and 2907 GSCs were co-transduced with Flag-NFKB1, HA-IFI35 or HA-TRIM21, and His-Ub, K48 or K63 plasmids for 72 h, then immunoprecipitated with anti-Flag antibody, followed by immunoblotting. G 839 and 2907 GSCs were co-transduced with Flag-NFKB1, HA-IFI35 or HA-TRIM21, and His-Ub, K48R or K63R plasmids for 72 h, then immunoprecipitated with anti-Flag antibody, followed by immunoblotting.
Fig. 5
Fig. 5. IFI35 with RELB/p50 complex transcriptionally regulates chemokines.
A Venn diagram shows the overlap of TOP 50 of GSEA enriched Gene Ontology (GO) pathways using TCGA GBM dataset of IFI35 expression and TOP 50 of GSEA enriched GO pathways after IFI35 knockout. B The bar plot shows GSEA enriched GO pathways after IFI35 knockout. C GSEA scores calculated for RNA sequencing data using GO gene sets showing IFI35 expression correlates with a transcriptional signature of cell chemotaxis signaling (left) and leukocyte chemotaxis signaling (right) in 839 GSC. D Gene Ontology (GO) pathway enrichment analysis of transcription signaling pathways related with IFI35 expression in TCGA GBM dataset. E GSEA scores calculated for TCGA GBM dataset using GO gene set showing IFI35 expression correlates with a transcriptional signature of regulation of DNA-binding transcription factor activity in 839 GSC. F Representative peptide of RELB identified by immunoprecipitation followed by mass spectrometry using anti-IFI35 antibody in 839 GSC cell lysates. G Immunoblot of immunoprecipitation with anti-IFI35, anti-NFKB1, anti-RELB antibody in 839 and 2907 GSCs. The nonspecific IgG is the control. H The confocal image of IFI35, NFKB1, and RELB distribution in 839 and 2907 GSCs. Scale bar, 10 μm. I Heatmap shows down-regulated genes (average change more than 1.5-fold, adjusted P value < 0.05) after sgIFI35 knockout in cell chemotaxis signaling pathway. J IFI35 knockout-induced chromatin accessibility alteration of cell chemotaxis pathway from ATAC-seq. K CCL2, LOX, ANXA1, CX3CL1, WNT5A, and SLIT2 signals detected by ATAC-seq in 839 GSC transduced with sgCONT and sgIFI35. L Chip-PCR assays using nonspecific IgG, anti-IFI35, anti-RELB, or anti-NFKB1 antibody. Data were determined by ANOVA and shown as mean ± SD from three independent experiments. **P < 0.01.
Fig. 6
Fig. 6. IFI35 induces recruitment and maintenance of M2-like TAMs.
A The immune scores showing IFI35 is associated with immune cell infiltration in TCGA GBM dataset. B The immune scores showing IFI35 is associated with immune cell infiltration with RNA sequencing analysis for GSCs and NSCs dataset. C GSEA for immune cells with correlation to IFI35 in TCGA GBM dataset. D THP1-derived M2 macrophages were treated with supernatants from GSCs transduced with either shIFI35 or shCONT for 24 h, transwell assays were performed to measure macrophages migration. E The mRNA level of M2-like markers (CCL22, VEGF, CD206, and ARG1) decreased in THP1-derived M2-like TAMs by stimulating with the supernatant of 839 or 2907 GSCs with loss of IFI35. Data are presented as mean ± SD from three independent experiments. F Immunofluorescent staining of IFI35 (green) and the pan-macrophage marker Iba1 (red) in GBM xenografts derived from 839 and 2907 GSCs expressing shCONT or shIFI35. Scale bar, 20 μm. G Immunofluorescent staining of the M2-like TAM marker CD206 (green) and the pan-macrophage marker Iba1 (red) in GBM xenografts derived from 839 and 2907 GSCs expressing shCONT or shIFI35. Scale bar, 20 μm.
Fig. 7
Fig. 7. IFI35 promotes in vivo tumor growth and has therapeutic potential in GSCs.
A In vivo bioluminescent imaging of tumor growth was performed in nude mice bearing glioblastoma xenografts derived from 5 × 104 GSCs (839 and 2907) transduced with shCONT, shIFI35-1, or shIFI35-2 on days 3, 8, 15, and 50. The control groups (mice bearing 839 and 2907 GSCs) on day 50 were dead. The groups of shIFI35-1 and shIFI35-2 formed a tumor in mice brains. B Kaplan–Meier survival curves of immunodeficiency mice with intracranial 839 or 2907 GSCs expressing shCONT, shIFI35-1, or shIFI35-2. n = 6 mice per group. C Representative images of hematoxylin and eosin staining of mouse brains collected on days 15 and 50 after transplantation of 839 or 2907 GSCs expressing shCONT, shIFI35-1, or shIFI35-2. Scale bar, 2 mm. Each image is representative of at least three similar experiments. D Kaplan–Meier survival analysis of IFI35 by the median of different glioma datasets: TCGA GBM, TCGA GBM LGG, CGGA all, and Rembrandt GBM datasets. E Kaplan–Meier survival analysis of IFI35 combined with TRIM21, NFKB1, and RELB by the median of TCGA GBM dataset. F Kaplan–Meier survival analysis of IFI35 combined with TRIM21, NFKB1, and RELB by the median of TCGA GBM LGG dataset.

References

    1. Miller KD, Ostrom QT, Kruchko C, Patil N, Tihan T, Cioffi G, et al. Brain and other central nervous system tumor statistics, 2021. CA Cancer J Clin. 2021;71:381–406. doi: 10.3322/caac.21693. - DOI - PubMed
    1. Ostrom QT, Price M, Neff C, Cioffi G, Waite KA, Kruchko C, et al. CBTRUS Statistical Report: primary brain and other central nervous system tumors diagnosed in the United States in 2015–2019. Neuro Oncol. 2022;24:v1–v95. doi: 10.1093/neuonc/noac202. - DOI - PMC - PubMed
    1. Perry JR, Laperriere N, O’Callaghan CJ, Brandes AA, Menten J, Phillips C, et al. Short-course radiation plus temozolomide in elderly patients with glioblastoma. N Engl J Med. 2017;376:1027–37. doi: 10.1056/NEJMoa1611977. - DOI - PubMed
    1. Karachi A, Dastmalchi F, Mitchell DA, Rahman M. Temozolomide for immunomodulation in the treatment of glioblastoma. Neuro Oncol. 2018;20:1566–72. doi: 10.1093/neuonc/noy072. - DOI - PMC - PubMed
    1. Hernandez Martinez A, Madurga R, Garcia-Romero N, Ayuso-Sacido A. Unravelling glioblastoma heterogeneity by means of single-cell RNA sequencing. Cancer Lett. 2022;527:66–79. doi: 10.1016/j.canlet.2021.12.008. - DOI - PubMed