. 2024 Apr 10;24(2):72.
doi: 10.1007/s10142-024-01356-5.

Targeting nucleotide metabolic pathways in colorectal cancer by integrating scRNA-seq, spatial transcriptome, and bulk RNA-seq data

Affiliations

Targeting nucleotide metabolic pathways in colorectal cancer by integrating scRNA-seq, spatial transcriptome, and bulk RNA-seq data

Songyun Zhao et al. Funct Integr Genomics. .

Abstract

Background: Colorectal cancer is a malignant tumor of the digestive system originating from abnormal cell proliferation in the colon or rectum, often leading to gastrointestinal symptoms and severe health issues. Nucleotide metabolism, which encompasses the synthesis of DNA and RNA, is a pivotal cellular biochemical process that significantly impacts both the progression and therapeutic strategies of colorectal cancer METHODS: For single-cell RNA sequencing (scRNA-seq), five functions were employed to calculate scores related to nucleotide metabolism. Cell developmental trajectory analysis and intercellular interaction analysis were utilized to explore the metabolic characteristics and communication patterns of different epithelial cells. These findings were further validated using spatial transcriptome RNA sequencing (stRNA-seq). A risk model was constructed using expression profile data from TCGA and GEO cohorts to optimize clinical decision-making. Key nucleotide metabolism-related genes (NMRGs) were functionally validated by further in vitro experiments.

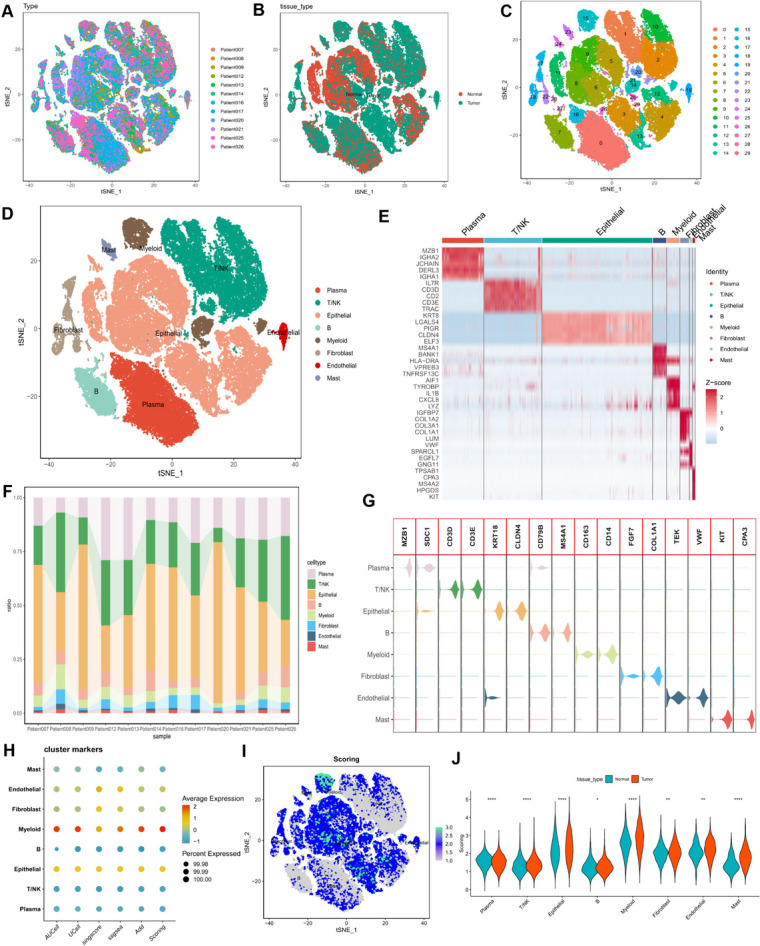
Results: In both scRNA-seq and stRNA-seq, colorectal cancer (CRC) exhibited unique cellular heterogeneity, with myeloid cells and epithelial cells in tumor samples displaying higher nucleotide metabolism scores. Analysis of intercellular communication revealed enhanced signaling pathways and ligand-receptor interactions between epithelial cells with high nucleotide metabolism and fibroblasts. Spatial transcriptome sequencing confirmed elevated nucleotide metabolism states in the core region of tumor tissue. After identifying differentially expressed NMRGs in epithelial cells, a risk prognostic model based on four genes effectively predicted overall survival and immunotherapy outcomes in patients. High-risk group patients exhibited an immunosuppressive microenvironment and relatively poorer prognosis and responses to chemotherapy and immunotherapy. Finally, based on data analysis and a series of cellular functional experiments, ACOX1 and CPT2 were identified as novel therapeutic targets for CRC.

Conclusion: In this study, a comprehensive analysis of NMRGs in CRC was conducted using a combination of single-cell sequencing, spatial transcriptome sequencing, and high-throughput data. The prognostic model constructed with NMRGs shows potential as a standalone prognostic marker for colorectal cancer patients and may significantly influence the development of personalized treatment approaches for CRC.

Keywords: Colorectal cancer; Immunotherapy; Nucleotide metabolism; Prognostic model; scRNA-seq; stRNA-seq.


Conflict of interest statement

The authors declare no conflicts of interest.

Figures

Fig. 1
Fig. 1
Classification of Cell Subpopulations and Gene Expression Scores Related to Nucleotide Metabolism in Colorectal Cancer. (A-D) t-SNE plots depicting diverse samples, tissue origins, cell clusters, and cell subpopulations, color-coded for clarity. (E) Heatmap illustrating the relative expression of marker genes within eight distinct cell subpopulations. Genes with high expression are represented in red, while those with low expression are displayed in blue. (F) Histogram displaying the distribution of cell types across different samples. (G) Expression patterns of commonly used marker genes for cellular annotation within these cell subpopulations. (H) Bubble plots demonstrating the enrichment scores of nucleotide metabolism-related genes per cell type in colorectal cancer. (I) t-SNE plots illustrate the enrichment scores of nucleotide metabolism-related genes for each cell type, with darker shades of green indicating higher scores. (J) The discrepancy in enrichment scores of nucleotide metabolism-related genes for each cell type between cancer and normal tissues. ns, Not significant; * p< 0.05; ** p< 0.01; *** p< 0.001; **** P< 0.0001
Fig. 2
Fig. 2
Cell Developmental Trajectory Analysis and Cell Communication Analysis. (A) Cell trajectory and pseudo-time analysis for malignant cells. (B) Heatmap illustrating the expression patterns of 40 genes related to nucleotide metabolism that exhibit differential expression during cell development. Low expression is represented in blue, while high expression is depicted in red. (C) Bubble diagram showcasing the activity analysis of signaling pathways across various cell types. (D) Circle diagram visualizing the strength of ligand-receptor interactions between different cell types. (E) Identification of highly ranked ligand-receptor pairs and their associated transcription factors between epithelial cells and fibroblasts. (F) Assessment of ligand-receptor strength between diverse cell types
Fig. 3
Fig. 3
Characterization of nucleotide metabolism in the spatial transcriptome of CRC. (A) Spatial representation illustrating the identification of 14 clusters through stRNA-seq. (B) Bubble plot displaying the expression levels of genes related to nucleotide metabolism within distinct clusters. Red signifies high expression, while blue indicates low expression. (C) Bubble chart presenting the metabolic intensity across various clusters. (D) Spatial depiction of pyrimidine metabolism intensity. (E) Spatial visualization of purine metabolic intensity. (F) Spatial representation of the 11 cellular clusters identified using Python. (G) Spatial map showcasing the developmental trajectory of clusters 1 through 8. (H) An algorithm is used to identify the predominant distribution of different cell types within the CRC spatial map using RCTD. (I) Extrapolation of spatial clustering of different cell types based on MISTy. (J) Projection of spatial correlations among different cell types based on MISTy
Fig. 4
Fig. 4
Calculation of Risk Scores Associated with Nucleotide Metabolism and Development of Prognostic Models. (A) Forest plot presenting the five prognostic genes identified through univariate Cox analysis. (B) Profiles of LASSO coefficients. (C) Ten-fold cross-validation for selecting tuning parameters in the LASSO model. (D) Results of multivariate Cox analysis for model genes and their corresponding coefficients. (E-H) Kaplan-Meier survival curves for overall survival (OS) of patients categorized into low-risk and high-risk groups in the TCGA cohort, the complete GEO cohort, the GSE17538 cohort, and the GSE39582 cohort. (I) Area under the curve (AUC) values for risk scores at 1, 3, and 5 years in the TCGA cohort. (J-L) Distribution of scores among low-risk and high-risk groups in the TCGA cohort, the GSE17538 cohort, and the GSE39582 cohort, along with patient survival data
Fig. 5
Fig. 5
Independent Prognostic Analysis of Risk Scores and Clinicopathologic Factors in the TCGA Cohort. (A, B) Univariate and multivariate Cox regression analyses of clinicopathologic variables and risk scores for overall survival (OS) in the TCGA training cohort. (C) Integrated nomograms combining age, grade, and stage for the prediction of OS at 1, 3, and 5 years in colorectal cancer patients. (D) Calibration curves for the nomograms. (E) Area under the curve (AUC) values for risk scores and clinical characteristics at 3 years in the TCGA cohort. (F) Decision curve analysis (DCA) curves for risk scores, nomogram scores, and other clinical characteristics. (G) Assessment of predictive performance using C-Index for different clinical characteristics, nomogram scores, and risk scores. (H) Heatmap displaying the expression profiles of the four model genes and clinical characteristics associated with subgroups, as determined by the chi-square test. (I) Distribution of clinical stages within various score subgroups. ns, Not significant; * p< 0.05; ** p< 0.01; *** p< 0.001; **** P< 0.0001
Fig. 6
Fig. 6
Mutational Landscape and Microsatellite Instability in CRC Samples. (A) Overview of the mutation landscape in 542 CRC samples. (B) Detailed breakdown of mutation types, with missense mutations being the most common. Single-nucleotide polymorphisms (SNPs) constituted the majority of mutations, with C>T mutations occurring most frequently. Horizontal histograms present the top 10 mutated genes in CRC. (C) Mutation status and tumor mutation load (TMB) of the 20 genes with the highest mutation frequency across different risk subgroups. (D) Comparison of TMB among different subgroups. (E) Correlation analysis between risk scores and TMB. (F) Survival disparities among four subgroups: H-TMB+ high-risk score, H-TMB+ low-risk score, L-TMB+ high-risk score, and L-TMB+ low-risk score. (G) Differences in risk scores of CRC patients in three subgroups based on microsatellite instability: microsatellite high instability (MSI-H), microsatellite low instability (MSI-L), and microsatellite stable (MSS). (H) Percentage of MSI classifications for patients in high-risk and low-risk groups
Fig. 7
Fig. 7
Analysis of the immune microenvironment and immune-related functions in different risk-scoring subgroups of the TCGA cohort. (A) Evaluation of variations in immune infiltration across risk score subgroups employing seven different algorithms. (B) Assessment of differences in immune scores and stromal scores calculated via ESTIMATE for distinct risk score subgroups. (C) Examination of variations in immune checkpoint expression within different risk score subgroups. (D) Heatmap displaying distinctions in tumor microenvironment (TME) score, immune checkpoint expression, and immune cell infiltration among diverse risk subgroups. (E) Radar chart depicting variations in immune cell infiltration and immune-related pathways assessed via ssGSEA among patients in different risk groups. (F) Correlation analysis between cancer RNA stemness score (RNAss) and risk score. ns, Not significant; * p< 0.05; ** p< 0.01; *** p< 0.001; **** P< 0.0001
Fig. 8
Fig. 8
Biological characteristics of different risk score groups in the TCGA cohort. (A) MsigDB-based GSVA analysis describing the biological properties of the two nucleotide metabolism-related score groups. (B) Metascape-based enrichment analysis of differentially expressed genes between the two risk-scoring groups. (C) t-SNE plots of both GO and Reactome terms describing the differences in nucleotide metabolic pathway activities in the two risk-scoring groups. (D) . GSEA of GO and KEGG terms for the risk signature. ns, Not significant; * p< 0.05; ** p< 0.01; *** p< 0.001; **** P< 0.0001
Fig. 9
Fig. 9
Prediction of the effects of immunotherapy and chemotherapy. (A) Comparison of the relative distributions of immunization scores (IPS) in the high-risk scoring group and the low-risk scoring group. (B) The relationship between risk scores, ICB response traits, and the various stages of the tumor-immunity cycle. (C) Heatmap of modeled gene-immunity gene correlations. (D) Differences in TIDE between CRC patients in the high-risk scoring group and those in the low-risk scoring group. (E) Correlation of risk scores with IC50 values for cisplatin, imatinib, and doxorubicin. ns, Not significant; * p< 0.05; ** p< 0.01; *** p< 0.001; **** P< 0.0001
Fig. 10
Fig. 10
ACOX1 and CPT2 are protective genes in CRC patients. (A) Spatial map demonstrating the expression of ACOX1 in colorectal cancer. (B) Kaplan-Meier survival curves of OS for patients in the ACOX1+ epithelial cells high and low expression groups. The proportion of ACOX1+ epithelial cells in patients producing different immune responses. (C) Spatial maps of different cell types were obtained by the algorithm of reverse convolution. Included here are ACOX1 expression-positive and expression-negative epithelial cells, endothelial cells, myeloid cells, mast cells, fibroblasts, and T/NK cells. (D, E) Heatmaps and network diagrams to predict the strength of communication between different cell types based on the stlearn method. (F) Spatial map demonstrating the expression of CPT2 in colorectal cancer. (G) Kaplan-Meier survival curves for OS in patients in the CPT2+ epithelial cells high and low expression groups. The proportion of CPT2+ epithelial cells in patients who produced different immune responses. (H) Spatial maps of different cell types were obtained by an algorithm of reverse convolution. Included here are CPT2 expressing positive and expressing negative epithelial cells, fibroblasts, T/NK cells, endothelial cells, myeloid cells, and B cells. (I, J) Heatmaps and network diagrams of the strength of communication between different cell types were extrapolated according to the method of stlearn
Fig. 11
Fig. 11
Expression of ACOX1 and CPT2 in CRC. (A) Immunohistochemical staining results showed the protein expression levels of ACOX1 and CPT2 in colorectal cancer tissues. (B) Compared with human intestinal epithelial NCM cell lines, ACOX1 and CPT2 were expressed at lower levels in CRC cell lines. (C) Relative expression of ACOX1 and CPT2 in CRC cells transfected with si-RNA or negative control (NC) was detected by RT-qPCR. ns, Not significant; * p< 0.05; ** p< 0.01; *** p< 0.001; **** P< 0.0001
Fig. 12
Fig. 12
Functional experiments of ACOX1 and CPT2 in CRC. (A) Transwell assay showed that down-regulation of ACOX1 and CPT2 expression promoted the migration and invasion ability of CRC cells. (B) CCK8 assay showed that the proliferation ability of CRC cells with reduced expression of ACOX1 and CPT2 was significantly enhanced compared with the NC group. ns, Not significant; * p< 0.05; ** p< 0.01; *** p< 0.001; **** P< 0.0001

References

    1. Andreatta M, Carmona SJ. UCell: Robust and scalable single-cell gene signature scoring. Comput Struct Biotechnol J. 2021;19:3796–3798. - PMC - PubMed
    1. Aran D. Single-Cell RNA Sequencing for Studying Human Cancers. Annu Rev Biomed Data Sci. 2023;6:1–22. - PubMed
    1. Barresi V, et al. Histological grading in colorectal cancer: new insights and perspectives. Histol Histopathol. 2015;30(9):1059–1067. - PubMed
    1. Beatty GL, et al. CD40 agonists alter tumor stroma and show efficacy against pancreatic carcinoma in mice and humans. Science. 2011;331(6024):1612–1616. - PMC - PubMed
    1. Borcherding N, et al. Single-Cell Profiling of Cutaneous T-Cell Lymphoma Reveals Underlying Heterogeneity Associated with Disease Progression. Clin Cancer Res. 2019;25(10):2996–3005. - PMC - PubMed