. 2024 Apr 9;7(1):430.
doi: 10.1038/s42003-024-06087-8.

Pancreatic cancer-associated fibroblasts modulate macrophage differentiation via sialic acid-Siglec interactions

Affiliations

Pancreatic cancer-associated fibroblasts modulate macrophage differentiation via sialic acid-Siglec interactions

Kelly Boelaars et al. Commun Biol. .

Abstract

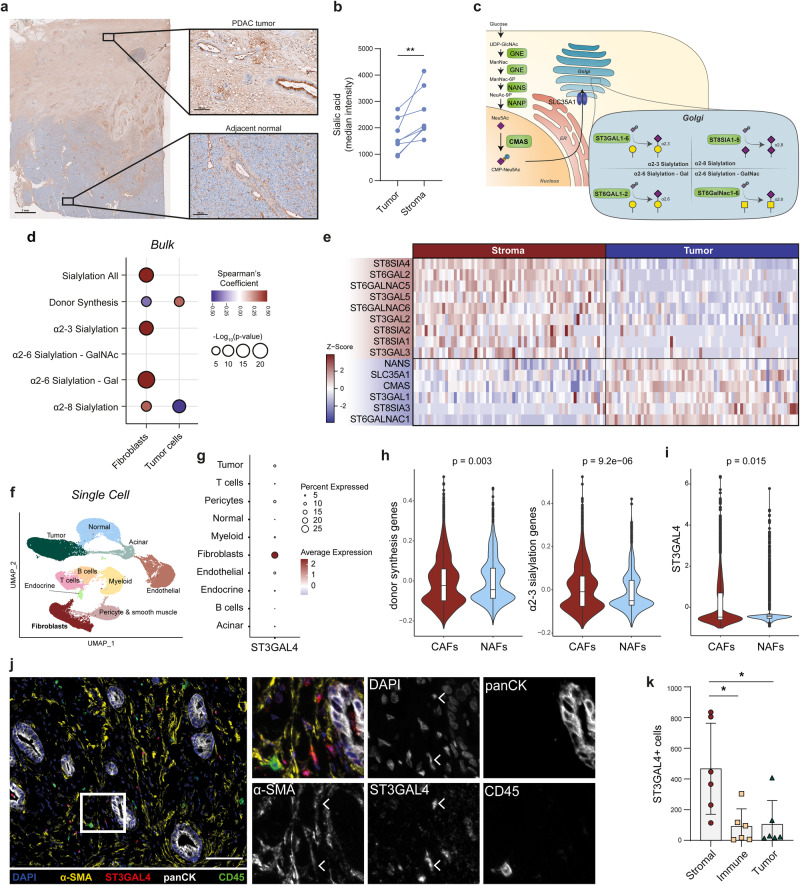
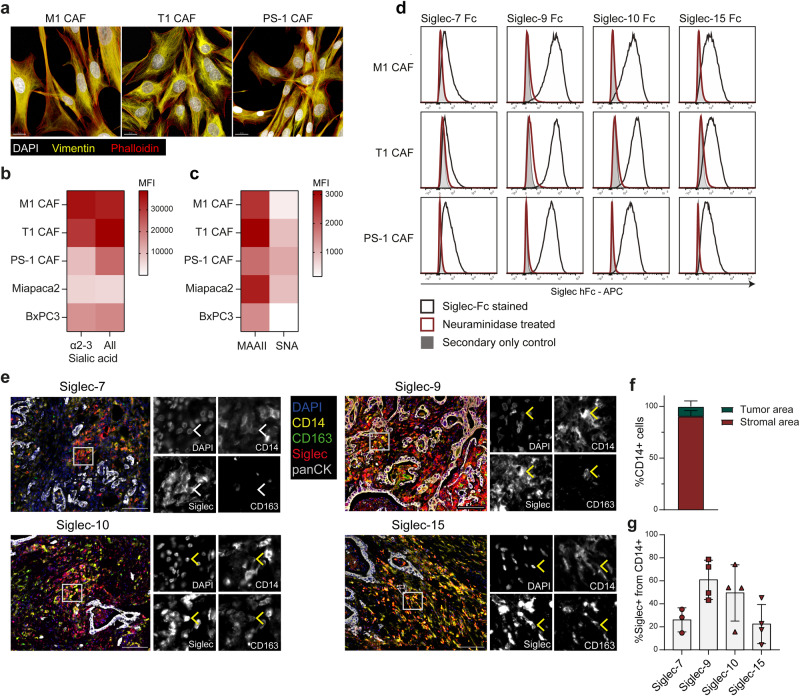
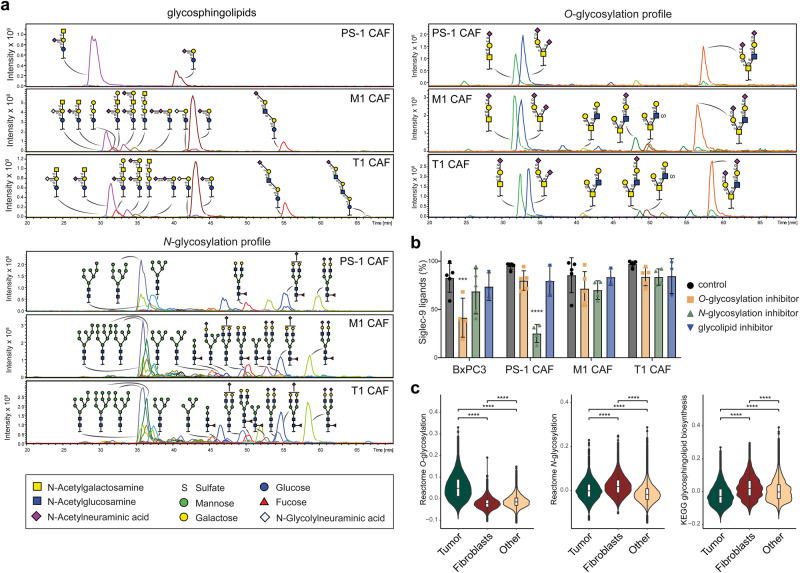
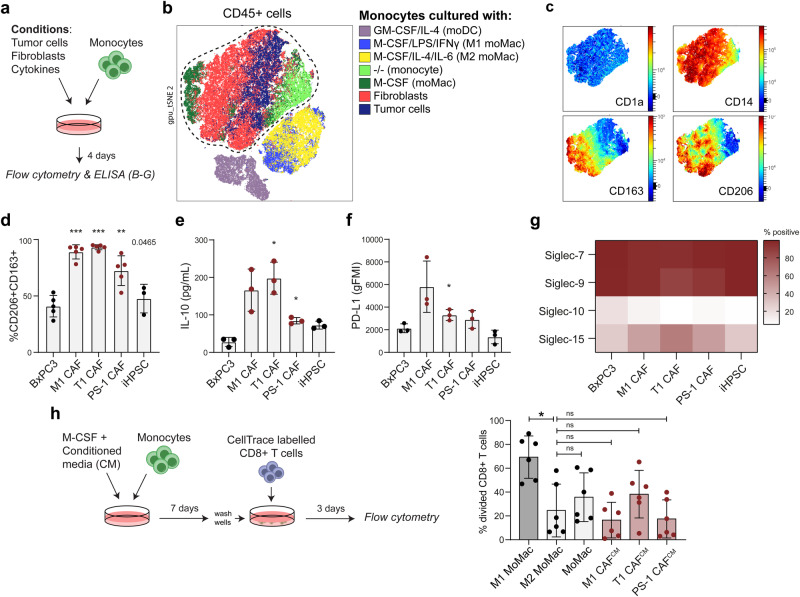
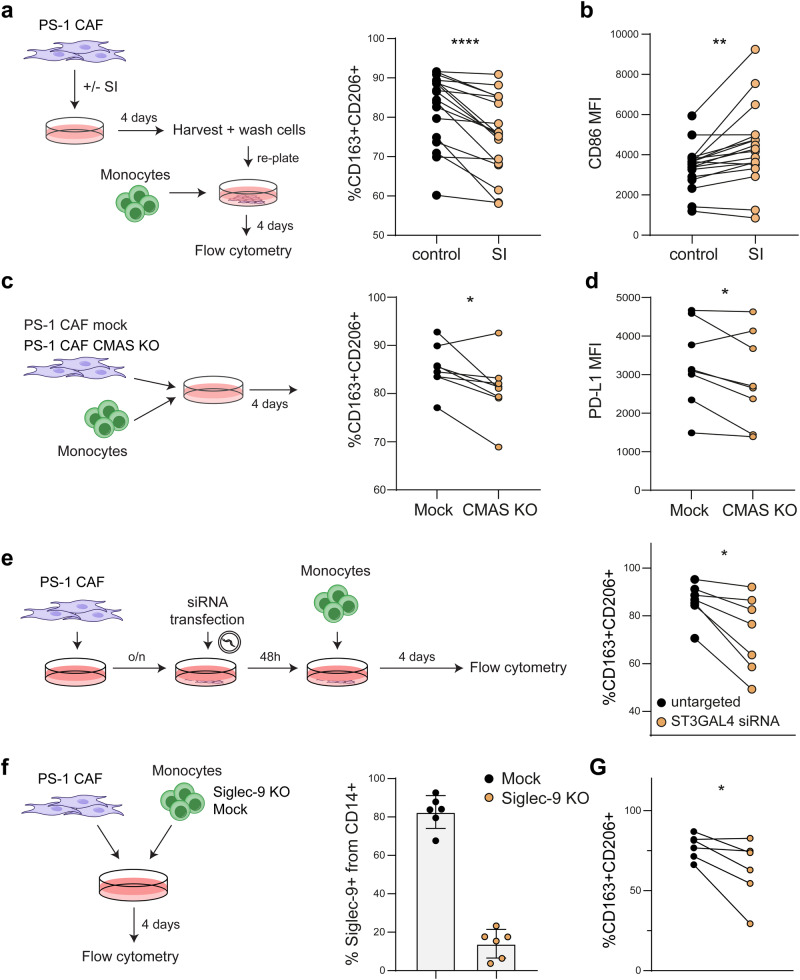
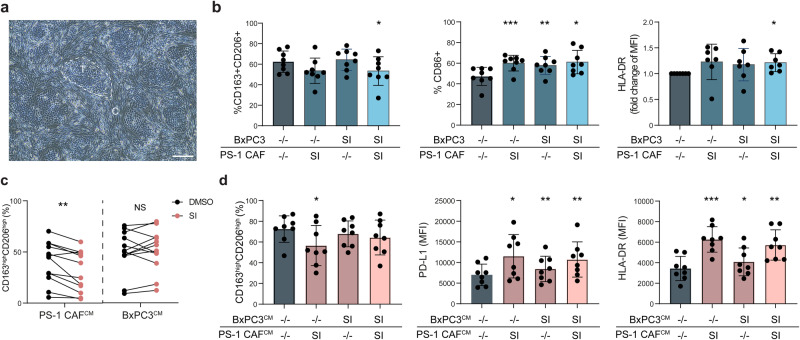
Despite recent advances in cancer immunotherapy, pancreatic ductal adenocarcinoma (PDAC) remains unresponsive due to an immunosuppressive tumor microenvironment, which is characterized by the abundance of cancer-associated fibroblasts (CAFs). Once identified, CAF-mediated immune inhibitory mechanisms could be exploited for cancer immunotherapy. Siglec receptors are increasingly recognized as immune checkpoints, and their ligands, sialic acids, are known to be overexpressed by cancer cells. Here, we unveil a previously unrecognized role of sialic acid-containing glycans on PDAC CAFs as crucial modulators of myeloid cells. Using multiplex immunohistochemistry and transcriptomics, we show that PDAC stroma is enriched in sialic acid-containing glycans compared to tumor cells and normal fibroblasts, and characterized by ST3GAL4 expression. We demonstrate that sialic acids on CAF cell lines serve as ligands for Siglec-7, -9, -10 and -15, distinct from the ligands on tumor cells, and that these receptors are found on myeloid cells in the stroma of PDAC biopsies. Furthermore, we show that CAFs drive the differentiation of monocytes to immunosuppressive tumor-associated macrophages in vitro, and that CAF sialylation plays a dominant role in this process compared to tumor cell sialylation. Collectively, our findings unravel sialic acids as a mechanism of CAF-mediated immunomodulation, which may provide targets for immunotherapy in PDAC.


Conflict of interest statement

The authors declare no competing interests

Figures

Fig. 1
Fig. 1. Sialic acid-containing glycans are expressed in the tumor stroma, characterized by the expression of ST3GAL4 in CAFs.
a Sialic acid expression in PDAC patient biopsy, as assessed by staining with pan-Lectenz (n = 8, see Fig. S1a), which binds all sialic acid linkages. Scale bar on left image equals 2 mm, scale bar on zoomed in images on the right equals 100 µm. b Median intensity of pan-Lectenz staining for sialic acids in PDAC patient biopsies, comparing tumor area (panCK + ) with stroma (panCK-) (n = 8). Statistical analysis with paired student-t test. c Schematic representation of sialylation-related genes involved in sialic acid metabolism and the sialyltransferases involved in the transfer of sialic acids to glycans. d Correlation between different sialic acid-related gene signatures and cell signatures of fibroblast or tumor cells in PDAC patients, analyzed using a bulk-RNA sequencing dataset from TCGA. e Heatmap of significant differentially expressed sialylation genes comparing microdissected tumor versus stroma in a RNA-seq dataset from Maurer et al.. f UMAP of scRNA-seq data of PDAC patients from Peng et al. illustrating the different cell populations identified in this dataset. g Expression of the sialyltransferase enzyme ST3GAL4 in the scRNA-seq dataset from (e) across cell type clusters. h Sialylation gene scores in CAFs versus NAFs from scRNA-seq data from (e). Statistical analysis using Wilcoxon test. Data presented as boxplot indicate the median, 25th and 75th percentiles (hinges) and whiskers represent 1.5 times the interquantile range. (i) ST3GAL4 expression in CAFs versus NAFs from scRNA-seq data from (e). Statistical analysis using Wilcoxon test. Data presented as boxplot indicate the median, 25th and 75th percentiles (hinges) and whiskers represent 1,5 times the interquantile range. j Multiplex immunohistochemistry on PDAC biopsies stained for nuclei (DAPI), immune cells (CD45), tumor cells (panCK), cancer-associated fibroblasts (α-SMA) and the sialyltransferase ST3GAL4. White arrows indicate expression of ST3GAL4 in α-SMA+ cells (representative image of n = 6). Scale bar equals 100 µm. k Quantification of ST3GAL4+ cells within stroma, immune cells and tumor cells. Tumor and stromal area’s divided based on panCK signal. Tumor cells were identified with panCK, immune cells in the stroma identified based on CD45 expression, stromal cell identified as panCK- and CD45- within the stromal region. Statistical analysis with one-way repeated measures ANOVA and dunnett’s multiple comparison test.
Fig. 2
Fig. 2. Sialic acids on CAFs serve as ligands for Siglec-7, -9, -10 and -15 present on myeloid cells in PDAC.
a Morphology of CAF cell lines by immunofluorescence staining. Scale bar equals 20 µm. b Sialic acid expression on tumor and CAF cell lines assessed by flow cytometry using Lectenz probes. c Sialic acid expression on tumor and CAF cell lines assessed by flow cytometry using the plant lectins MAAII (binding α2-3 linked sialic acids) and SNA (binding α2-6 linked sialic acids). d Flow cytometric analysis of Siglec ligand expression in CAF cell lines treated with/without neuraminidase. e Multiplex immunohistochemistry on a PDAC biopsy for myeloid cells (CD14), TAMs (CD163), Siglec receptors and tumor cells (panCK). White boxes indicate zoomed in areas for which individual channels are shown in black/white. Image is representative for ≥3 patients. Scale bar equals 100 µm, white arrows indicate CD14+ Siglec+ cells, yellow arrows indicate CD14+ CD163+ Siglec+ cells. f Quantification of CD14+ cells in tumor region or stromal region of determined by panCK signal. g Percentage Siglec+ cells from total CD14+ cells in the stroma.
Fig. 3
Fig. 3. Detailed glycan profiles of CAF cell lines.
a Glycosphingolipid, N-glycan and O-glycan profiles of CAF cell lines determined by mass spectrometry (n = 3). b Percentage of cells expressing Siglec-9 ligands after treatment with glycosylation inhibitors for glycosphingolipid synthesis (PPMP), N-glycosylation (Kifunensine) and O-glycosylation (Benzyl-GalNAc). Statistical analysis using two-way ANOVA and dunnett’s multiple comparison test, comparing individual glycan inhibitor conditions to control within each cell line. c Gene module scores for O-glycosylation, N-glycosylation and glycosphingolipid biosynthesis in tumor cells, fibroblasts and other cells using scRNA-seq dataset from Peng et al..
Fig. 4
Fig. 4. Compared to tumor cells, PDAC CAFS have enhanced capacity to differentiate monocytes to macrophages with an immune suppressive phenotype.
a Schematic representation of the experimental setup related to Figure (bg). Monocytes were co-cultured with either a fibroblast cell line (including M1 CAF, T1 CAF, PS-1 or iHPSC), or with a tumor cell line. b tSNE of monocyte-derived immune cells after co-culture with either fibroblasts or tumor cell lines. Additionally, tSNE shows monocytes differentiated in vitro using cytokines which serve as controls. Cells plotted in tSNE are pre-gated CD45+CD14+ cells, with the exception of the moDCs that were pre-gated only for CD45+ cells. c Expression of macrophage markers in the cluster containing TAMs and fibroblast-induced moMACs. d Percentages CD206+CD163+ cells gated from CD45+CD14+ cells. Statistical analysis with paired t test compared to BxPC3. Statistical significance from p ≤ 0.0125 (Bonferroni correction). e Cytokine levels of IL-10 in the co-cultures. Statistical analysis with one-way repeated measures ANOVA and dunnett’s multiple comparison test, comparing fibroblast cell lines to BxPC3. f PD-L1 expression on differentiated monocytes after co-culture with BxPC3 or fibroblast cell lines. Statistical analysis with one-way repeated measures ANOVA and dunnett’s multiple comparison test, comparing fibroblast cell lines to BxPC3. g Percentage of Siglec positive cells after co-culture with BxPC3 or fibroblast cell lines, gated from CD45+CD14+. Data represents the mean of 3 donors. h CD8+ T cell proliferation after 3 days of co-culture with different macrophage phenotypes. Macrophage phenotypes were generated by differentiating monocytes in the presence of conditioned media from M1 CAF, T1 CAF or PS-1 CAF, or alternatively by differentiating monocytes with M-CSF (moMac), or differentiating and polarizing them with IFN-γ (M1-moMac) or IL-4/IL-6 (M2-moMac). Statistical analysis with one-way repeated measures ANOVA and dunnett’s multiple comparison test, comparing conditions to M2-moMAC control.
Fig. 5
Fig. 5. Removal of sialic acids on PS-1 CAFs results in reduced TAM differentiation.
a Percentage of CD163+CD206+ cells within the CD45+CD14+ population after co-culture with PS-1 CAFs, treated prior to the co-culture with SI or DMSO as control. b Expression of CD86 in macrophages after co-culture with PS-1 CAFs, treated prior to the co-culture with SI or DMSO as control. c Differentiation of monocytes after co-culture with PS-1 CAF Mock or CMAS KO. d PD-L1 expression on macrophages after co-culture with PS-1 CAF Mock or CMAS KO. e Percentage of CD163+CD206+ cells within the CD45+CD14+ population after co-culture with PS-1 CAF, transfected with untargeted or ST3GAL4 siRNA. f Percentage of Siglec-9+ cells within CD14+ monocytes on day 4 of co-culture after transfection with Siglec-9 KO plasmid or Mock plasmid. G Differentiation of Mock and Siglec-9 KO monocytes after co-culture with PS-1 CAF. %CD163+CD206+ cells were gated within CD14+ cells for Mock transfected monocytes and gated on the CD14+ Siglec-9- population for the Siglec-9 KO transfected monocytes.
Fig. 6
Fig. 6. Both tumor and stromal sialylation involved in TAM differentiation.
a Brightfield image of BxPC3 and PS-1 after 4 day co-culture. Dotted line illustrates an island of BxPC3 tumor cells “T”, surrounded with PS-1 cells marked with “C”. Scale bar equals 200 µm. b Percentage of CD163+CD206+ cells, CD86+ cells and MFI of HLA-DR within the CD45+CD14+ population after co-culture with BxPC3 and PS-1, that were treated prior to the co-culture with SI or DMSO as control. Statistical analysis with one-way repeated measures ANOVA and dunnett’s multiple comparison test. c Percentage of CD163+CD206+ cells within the CD45+CD14+ population after differentiation in the presence of conditioned media from either BxPC3 or PS-1. Conditioned media was generated over 24 h, after 3-day treatment of cells with SI or DMSO as control. d Percentage of CD163+CD206+ cells and MFI of PD-L1 and HLA-DR, within the CD45+CD14+ population after differentiation in the presence of conditioned media from BxPC3 and PS-1. Conditioned media was generated over 24 h, after 3-day treatment of cells with SI or DMSO as control. Statistical analysis with one-way repeated measures ANOVA and dunnett’s multiple comparison test.

References

    1. Siegel RL, Miller KD, Fuchs HE, Jemal A. Cancer statistics, 2022. CA Cancer J Clin. 2022;72:7–33. doi: 10.3322/caac.21708. - DOI - PubMed
    1. Hegde PS, Chen DS. Top 10 Challenges in Cancer Immunotherapy. Immunity. 2020;52:17–35. doi: 10.1016/j.immuni.2019.12.011. - DOI - PubMed
    1. Valkenburg KC, de Groot AE, Pienta KJ. Targeting the tumour stroma to improve cancer therapy. Nat Rev Clin Oncol. 2018;15:366–381. doi: 10.1038/s41571-018-0007-1. - DOI - PMC - PubMed
    1. Sahai E, et al. A framework for advancing our understanding of cancer-associated fibroblasts. Nat Rev Cancer. 2020;20:174–186. doi: 10.1038/s41568-019-0238-1. - DOI - PMC - PubMed
    1. Liu L, et al. Stromal myofibroblasts are associated with poor prognosis in solid cancers: A meta-analysis of published studies. PLoS One. 2016;11:e0159947. doi: 10.1371/journal.pone.0159947. - DOI - PMC - PubMed

Publication types

MeSH terms

Substances