. 2024 May;26(5):719-730.
doi: 10.1038/s41556-024-01403-0. Epub 2024 Apr 9.

CD32 captures committed haemogenic endothelial cells during human embryonic development

Affiliations

CD32 captures committed haemogenic endothelial cells during human embryonic development

Rebecca Scarfò et al. Nat Cell Biol. 2024 May.

Abstract

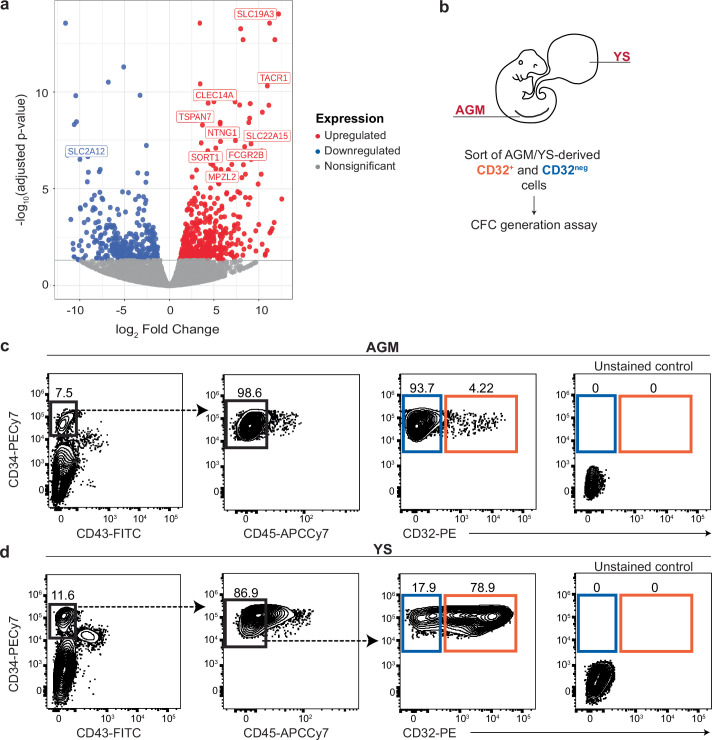
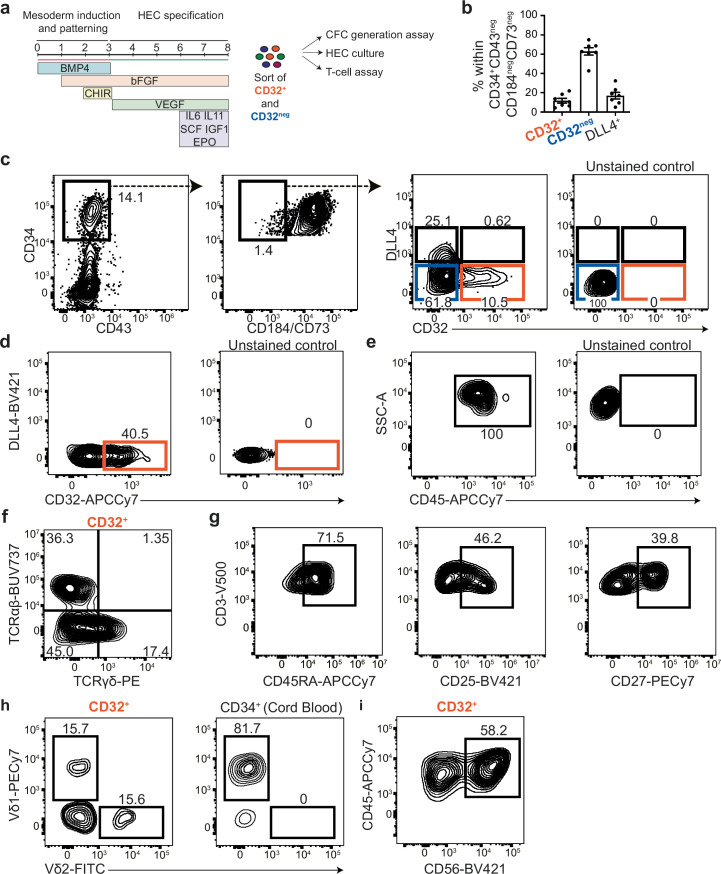
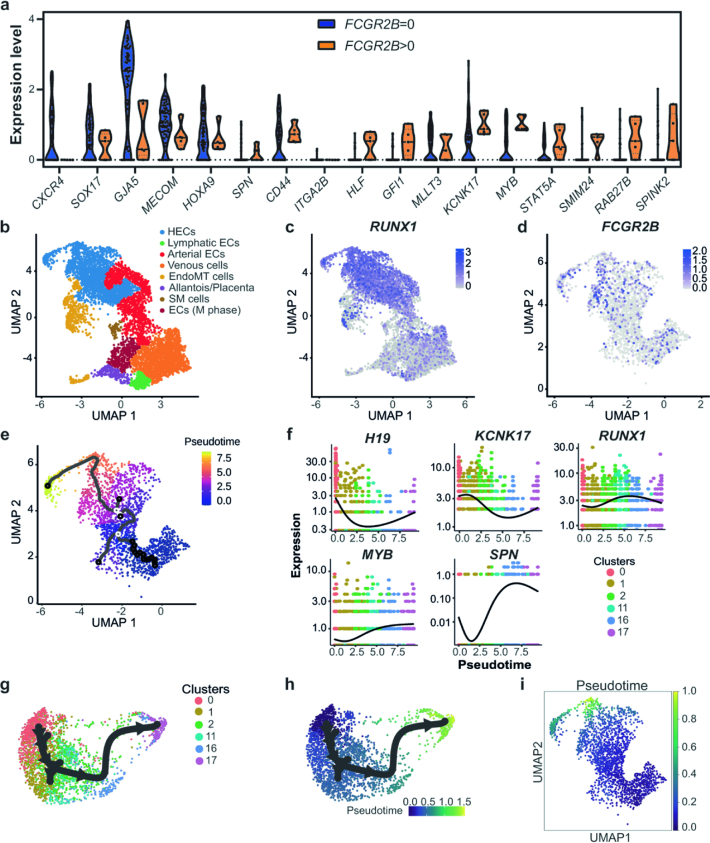
During embryonic development, blood cells emerge from specialized endothelial cells, named haemogenic endothelial cells (HECs). As HECs are rare and only transiently found in early developing embryos, it remains difficult to distinguish them from endothelial cells. Here we performed transcriptomic analysis of 28- to 32-day human embryos and observed that the expression of Fc receptor CD32 (FCGR2B) is highly enriched in the endothelial cell population that contains HECs. Functional analyses using human embryonic and human pluripotent stem cell-derived endothelial cells revealed that robust multilineage haematopoietic potential is harboured within CD32+ endothelial cells and showed that 90% of CD32+ endothelial cells are bona fide HECs. Remarkably, these analyses indicated that HECs progress through different states, culminating in FCGR2B expression, at which point cells are irreversibly committed to a haematopoietic fate. These findings provide a precise method for isolating HECs from human embryos and human pluripotent stem cell cultures, thus allowing the efficient generation of haematopoietic cells in vitro.


Conflict of interest statement

A.D. and R.S. have filed a patent application for the methodology described in this manuscript. C.M.S. is a scientific founder and Scientific Advisory Board member of Clade Therapeutics. The other authors declare no competing interests.

Figures

Fig. 1
Fig. 1. Human embryonic ACE+ endothelial cells express arterial and haemogenic markers.
a, A transverse section of the AGM region of a 23 dpf (CS10, top, n = 2 independent) and a 27 dpf (CS12, bottom, n = 3 independent) human embryo, immunostained with ACE (left, in red), RUNX1 (middle, in green) and merge (right). Ao, aorta; NT, neural tube. Scale bars, 50 μm. be, An RNA-seq analysis of human embryonic populations isolated from four CS12–CS13 embryos, referred to as ‘donor’: E1, E2, E3 and E4. The ACEneg population is coloured in beige and ACE+ population in light blue. PCA (b) of the top 500 DEGs within human embryonic populations. A heatmap of DEGs within human embryonic populations (c), where gene counts were corrected for donor and the rlog gene expression values shown in rows and tiles referring to DEGs are coloured according to upregulation (red) or downregulation (blue). A heatmap of selected pan-endothelial (CD34, CDH5, PECAM and TEK), vein-specific (NR2F2 and FLRT2), arterial-specific (GJA5, DLL4, CXCR4 and HEY2) and haemogenic (MYB, GFI1 and CD44) gene expression (d), where the rlog gene expression values shown in rows and tiles referring to DEGs are coloured according to upregulation (red) or downregulation (blue). A barplot (e) showing significantly enriched GO terms (Fisher exact test; FDR <0.05) using ORA on DEGs. The barplot shows enriched terms grouped by custom categories: cell cycle (upregulated in ACEneg), migration and adhesion (upregulated in ACE+).
Fig. 2
Fig. 2. CD32 is expressed in AGM and YS HECs during human embryonic development.
a, A heatmap of top ten differentially expressed surface genes within human embryonic ACE+ (light blue) and ACEneg (beige) cells derived from four CS12–CS13 human embryos (E1, E2, E3 and E4). rlog gene expression values are shown in rows. Colouring indicates differential expression by upregulation (red) or downregulation (blue). b, CD34 (top) and CD32 (bottom) expression by immunohistochemistry of consecutive sections of the AGM of a 29 dpf (CS13) human embryo (n = 5 independent). Inset shows high magnification of haematopoietic clusters (black arrowhead) and surrounding endothelial cells (white arrowhead) immunostained by CD32. Ao, aorta. Scale bars, 50 μm and 25 μm (inset). c, Transverse consecutive sections of the AGM region of a 29 dpf (CS13) human embryo, immunostained with CD34 (green), CD32 (red) and merge (top, from left to right) and RUNX1 (green), ACE (red) and merge (bottom, from left to right). Scale bars, 50 μm, n = 3 independent. d, CD34 (top) and CD32 (bottom) expression by immunohistochemistry of consecutive sections of the YS of a 26 dpf (CS12) human embryo (n = 5 independent). Scale bars, 25 μm. e,f, Flow cytometric analysis (e) and quantification of erythro-myeloid CFC potential (f) of CD32+ (orange) and CD32neg (blue) cell populations isolated from the AGM and YS of CS13 human embryos (E5 and E6). n = 2, independent. PE, phycoerythrin; PE-Cy7, phycoerythrin-cyanine7; BFU-E, burst-forming unit erythroid; CFU-GM, colony-forming unit granulocyte macrophage; CFU-M, colony-forming unit macrophage. Source data
Fig. 3
Fig. 3. CD32 is expressed in WNTd hPSC-derived HECs.
a, A flow cytometric analysis of day 8 WNTd hPSC-derived haematopoietic cultures. Left: CD43 and CD34 expression within SSC/FSC/Live. Right: CD32 and ACE expression within SSC/FSC/Live/CD34+CD43neg. H1 hESCs, n = 3, independent. PE-Cy7, phycoerythrin-cyanine7; FITC, fluorescein isothiocyanate; PE, phycoerythrin; APC-Cy7, allophycocyanin-cyanine7. b, A flow cytometric analysis at day 8 of WNTd hPSC-derived haematopoietic cultures of CD32 and DLL4 expression within SSC/FSC/Live/CD34+CD43negCD184negCD73neg. CD32+ is shown in orange and CD32neg in blue. H1 hESCs, n = 7, independent. APC, allophycocyanin. c,d, Flow cytometric analysis (c) and barplot (d) showing the frequency of CD32 and RUNX1C–EGFP expression in day 8 WNTd hPSC-derived haematopoietic cultures within SSC/FSC/Live/CD34+CD43negCD184negCD73negDLL4neg. H9 hESCs, n = 4, independent, mean ± s.e.m. e, Photo-micrographs of CD32+ cells isolated at day 8 of WNTd hPSC-derived haematopoietic culture and after 1 (day 8 + 1, top) or 5 (day 8 + 5, bottom) days of HEC culture. H9 hESCs, n = 3, independent. Scale bars, 200 μm (top) and 400 μm (bottom). f, A flow cytometric analysis of endothelial (CD34+CD45neg) and haematopoietic cells (CD45+, RUNX1C–EGFP+) derived from CD32+ cells isolated at day 8 of WNTd hPSC-derived haematopoietic culture and analysed after 5 days of HEC culture. Gated on SSC/FSC/Live. H9 hESCs, n = 3, independent. g, The quantification of erythro-myeloid CFC potential of CD32+ and CD32neg populations isolated from day 8 WNTd hPSC-derived haematopoietic cultures and cultured on OP9DLL1, H1 hESCs (n = 4), on the left, and H9 hESCs (n = 3), on the right. One-tail paired Student’s t-test, non-parametric, for all biological replicates, statistics performed considering the total number of colonies, mean ± s.e.m., (*P = 0.0155; **P = 0.0092). BFU-E, burst-forming unit erythroid; CFU-GM, colony-forming unit granulocyte macrophage; CFU-M, colony-forming unit macrophage; CFU-GEMM, colony-forming unit granulocytes, erythrocytes, macrophages, megakaryocytes. h,i, Flow cytometric analysis (h) and barplot (i) of CD4+CD8+ T cell potential of CD32+ (orange) and CD32neg (blue) cells isolated at day 8 of WNTd hPSC-derived haematopoietic cultures. Gated on SSC/FSC/Live/CD45+CD56negCD7+CD5+ H1 hESCs, n = 3, independent; One-tail paired Student’s t-test, non-parametric, for all biological replicates, mean ± s.e.m., **P = 0.0073. j, The quantification of the erythro-myeloid CFC potential of CD44+ (green) and CD44neg (purple) populations isolated at day 8 of WNTd hPSC-derived haematopoietic cultures and cultured on OP9DLL1. One-tail paired Student’s t-test, non-parametric, for all biological replicates (H1 hESCs, n = 3, independent) considering the total number of colonies, mean ± s.e.m., **P = 0.0098. k,l, A barplot showing the frequency (k) and a table showing the clonal analysis (l) of CD45+ and CD45neg clones derived from CD32+ or CD44+ cells isolated at day 8 of WNTd hPSC-derived haematopoietic cultures. One-way ANOVA for all biological replicates (H1 hESCs, n = 4), mean ± s.e.m. (NS, not significant P = 0.9855; ****P < 0.0001; **P = 0.0028). Source data
Fig. 4
Fig. 4. Transcriptomic similarity between CD32+ cells and AGM-derived HECs.
a, A heatmap showing a selection of DEGs in CD34+CD184+CD73+DLL4+CD43neg (DLL4+, in green) or CD34+CD43negCD184negCD73negCD32+ (CD32+, in orange) samples isolated at day 8 of WNTd hPSC-derived haematopoietic culture. H1 hESCs, n = 3 independent (#1 in light blue, #2 in purple and #3 in yellow). Scaled rlog gene expression values are shown in rows. The colouring indicates differential expression by upregulation (red) or downregulation (blue). b, UMAP of integrated publicly available single-cell datasets (accession codes GSE135202 and GSE162950) showing cell clusters of AGM (CS10–CS16) or YS (CS11). Cells clustered at resolution 1.2. c, Feature plots showing HOXA9 and HOXA10 expression across the clusters shown in b. d, A barplot displaying the transcript per million (TPM) values for HOXA9 and HOXA10 genes analysed from the RNA-seq data of CD32+ cells as described in a, mean ± s.e.m. e, A heatmap visualizing the similarity scores between AGM samples from the single-cell data shown in b and annotated as HEC (red) or AEC (blue) in comparison with CD32+ and DLL4+ samples. Scale bar: Z scores of the relative Spearman coefficients. Each column is representative of a single embryonic cell scored across each population indicated by the row name. f, A scorecard dot plot showing landmark genes as reported in ref. . Differential expression was evaluated in CDH5+RUNX1+PTPRCneg cells that either express FCGR2B (FCGR2B > 0) or do not (FCGR2B = 0). Source data
Fig. 5
Fig. 5. CD32 identifies a NOTCH-independent HEC state.
a, UMAP of single-cell data of day 8 WNTd CD34+CD43negCD184negCD73neg cells. H1 hESCs, n = 1. Cells clustered at resolution 0.6. RUNX1-expressing clusters highlighted by a dashed black line. ECs, endothelial cells; EndoMT, endothelial-to-mesenchyme transition; M phase, mitotic phase. b, UMAP of the single-cell trajectory performed by Monocle3 on clusters 0, 1, 2, 11, 16 and 17 displaying RUNX1 as a differential marker. c, GSEA (significantly enriched GO terms, adjusted P value <0.05) on FC pre-ranked genes from the comparison between cluster 11 and clusters 0, 1 and 2 (top) or cluster 11 and clusters 16 and 17 (bottom). Upregulated genes are shown in red, downregulated in blue. NES, normalized enrichment score; ECM, extracellular matrix. d, UMAP (top) and donut charts (bottom) showing the cells in clusters 0, 1 and 2, cluster 11, and clusters 16 and 17 coloured according to the cell cycle phase. G1 phase, yellow; S phase, purple; G2/M phase, green. e, Pseudotime kinetics of the expression variation of FCGR2B and HES1, HEY1 and HEY2 along the clusters with differential RUNX1 expression. Cells coloured by cluster identity. Lines denote relative average expression of each gene in pseudotime. f, Flow cytometric analysis of CD45 and CD34 after HEC culture of CD32+/neg treated with DMSO, as control, or γ-secretase inhibitor L-685,458 (γSi) to block NOTCH signalling. Gated on SSC/FSC/Live. n = 3, independent. APC-Cy7, allophycocyanin-cyanine7. g, A barplot showing the frequency of CD45+ cells derived from CD32+ and CD32neg fraction treated with DMSO (in petroleum) or γ-secretase inhibitor L-685,458 (γSi, in white) to block NOTCH signalling. One-way ANOVA for all biological replicates (n = 3), mean ± s.e.m. (*P = 0.0456; NS, not significant, P = 0.9623). h, Flow cytometric analysis of CD45/CD34 after HEC cultures. of wild-type H1 hESCs (left) and H1 hESCs expressing 3× short hairpin RNAs (shRNAs) against FCGR2B (referred to as CD32 knock-down, KD, right), gated on SSC/FSC/Live/GFP+ cells. Source data
Fig. 6
Fig. 6. HEC specification and haematopoietic cell emergence require stage-specific BMP and ROCK signalling modulation.
a, ORA (significant BMP-related BP terms, Fisher exact test; FDR <0.05) on downregulated DEGs between DLL4+ versus CD32+ samples. Bars coloured by adjusted P value. b,c, Fold difference of CD32+ cell frequency in day 8 WNTd cells (b) and of CFC frequency post HEC cultures of cells obtained with BMP signalling modulation (c). Frequencies are shown relative to control. One-way ANOVA for all biological replicates (n = 3, independent, H9 hESCs), mean ± s.e.m. (for b, ***P = 0.0004; ****P < 0.0001; for c, control versus BMP4: *P = 0.0379; control versus BMPi: *P = 0.02170; BMP4 versus BMPi: ***P = 0.001). d,e, Flow cytometric analysis of CD32/DLL4 expression in day 8 WNTd cultures (d) and CD45/CD34 expression after HEC cultures of cells obtained with BMP signalling modulation (e). For d, gated on SSC/FSC/Live/CD34+CD43negCD184negCD73neg; for e, gated on SSC/FSC/Live. H9 hESCs, n = 3, independent. APC, allophycocyanin; PE, phycoerythrin; PE-Cy7, phycoerythrin-cyanine7; APC-Cy7, allophycocyanin-cyanine7. f, ORA (significant RHO-related Reactome Pathways terms, Fisher exact test; FDR <0.05) on downregulated DEGs between cells of cluster 11 versus clusters 0, 1 and 2. Bars are coloured by adjusted P value. g,h, Flow cytometric analysis of CD45/CD34 expression (g) and fold difference of CFC frequency after ROCK inhibition (h). Gated on SSC/FSC/Live. Frequencies are shown relative to control. One-tail paired Student’s t-test, non-parametric, for all biological replicates (H9 hESCs, n = 3, independent), mean ± s.e.m., *P = 0.0404. i, Model depicting the emergence of blood cells during human embryonic development. HECs are specified from mesodermal cells via VEGF and BMP signalling. HECs then undergo a NOTCH-dependent determination process that culminates with CD32 expression, which is followed by a cell cycle re-entry for the NOTCH-independent differentiation into blood cells. ECM, extracellular matrix. Source data
Extended Data Fig. 1
Extended Data Fig. 1. ACE is expressed within CD34+ cells during intra-embryonic hematopoiesis.
a) Representative flow cytometric analysis showing i) the gating strategy and ii) ACE and CD34 expression in day 8 WNTd hPS cell-derived hematopoietic cultures, gated on SSC/FSC/Live. H1 hESCs, n = 4, independent; b) Representative flow cytometric analysis showing CD184/CD73 and ACE expression in CD34+CD43neg cells at day 8 of WNTd hPSC-derived hematopoietic cultures. Anti-CD184 and anti-CD73 antibodies are in the same color. Gated on SSC/FSC/Live/CD34+CD43neg. H1 hESCs, n = 4, independent; c) Representative flow cytometric analysis showing the gating strategy to isolate ACE+ and ACEneg cells from the AGM of n = 4 CS12-CS13 human embryos. Left panel: CD45 and CD34 expression, gated on SSC/FSC/Live. Middle panel: ACE and CD34 expression, gated on SSC/FSC/Live/CD34+CD45neg. Right panel: unstained control, gated on SSC/FSC/Live; d) Volcano plot showing the differentially expressed genes in ACE+ and ACEneg cells isolated from the AGM of four CS12-CS13 human embryos (Wald test; FDR < 0.05). The top 20 differentially expressed genes are highlighted, upregulated in red, downregulated in blue, nonsignificant in grey; e) DESeq2 heatmap distance analysis of four CS12-CS13 human embryos used for RNA-seq. Samples were clustered using unsupervised hierarchical clustering by k-means.
Extended Data Fig. 2
Extended Data Fig. 2. Identification of CD32 in the AGM and the YS of human embryos.
a) Volcano plot showing the differentially expressed cell surface genes in ACE+ vs ACEneg cells isolated from the AGM of four CS12-CS13 human embryos (Wald test; FDR < 0.05). The top 10 differentially expressed cell surface genes are highlighted, upregulated in red, downregulated in blue, nonsignificant in grey; b) Experimental layout: CD34+CD43negCD45negCD32+/neg (referred to as CD32+ and CD32neg) cells were FAC-sorted from the AGM and YS of two CS13 human embryos. Isolated cells were tested for their hematopoietic potential via CFC generation assay; c) Representative flow cytometric analysis showing the gating strategy to isolate CD32+ (orange) and CD32neg (blue) cells from the AGM of CS13 human embryo. From the left, first panel: gated on SSC/FSC/Live. Second panel: gated on SSC/FSC/Live/CD34+CD43neg. Third panel: gated on SSC/FSC/Live/CD34+CD43negCD45neg. Fourth panel: unstained control, gated on SSC/FSC/Live. n = 2, independent; d) Representative flow cytometric analysis showing the gating strategy to isolate CD32+ (orange) and CD32neg (blue) cells from the YS of CS13 human embryo. n = 2, independent. From the left, first panel: gated on SSC/FSC/Live. Second panel: gated on SSC/FSC/Live/CD34+CD43neg. Third panel: gated on SSC/FSC/Live/CD34+CD43negCD45neg. Fourth panel: unstained control, gated on SSC/FSC/Live.
Extended Data Fig. 3
Extended Data Fig. 3. Characterization of the hematopoietic potential of CD32+cells in WNTd hPSC-derived hematopoietic differentiations.
a) Experimental layout showing the timeline of WNTd hPSC-derived hematopoietic cultures obtained by adding the WNT agonist CHIR 99021. CD34+CD43negCD184negCD73negDLL4negCD32+/neg (referred to as CD32+, CD32neg) cells were isolated at day 8 and further cultured to assay the CFC generation, T-lymphoid potential or the generation of hematopoietic progeny through HEC culture; b) Bar plot showing the frequency of DLL4negCD32+/neg cells and DLL4+ within day 8 of WNTd hPSC-derived CD34+CD43negCD184negCD73neg cells. Mean ± SEM. H1 hESCs n = 7, independent; c) Representative flow cytometric analysis showing the gating strategy to isolate CD32+ (orange) and CD32neg (blue) cells from day 8 of WNTd hPSC-derived hematopoietic cultures. DLL4+ cells are highlighted in black. From the left, first panel: gated on SSC/FSC/Live. Second panel: gated on SSC/FSC/Live/CD34+CD43neg. Third panel: gated on SSC/FSC/Live/ CD34+CD43negCD184negCD73neg. Fourth panel: unstained control, gated on SSC/FSC/Live. n = 7, independent; d) Representative flow cytometric analysis of the generation of CD32+ cells from CD32neg cells isolated at day 8 of WNTd hPSC-derived hematopoietic cultures and cultured for 2 extra days using the same culture conditions. Gated on SSC/FSC/Live/CD34+CD43negCD184negCD73neg. H9 hESCs, n = 3, independent; e) Representative flow cytometric analysis of the hematopoietic CD45+ progeny derived from CD32+ cells isolated 2 days after the sorting of the CD32neg fraction at day 8 of WNTd hPSC-derived hematopoietic cultures as shown in d). Gated on SSC/FSC/Live. H9 hESCs, n = 3, independent; f) Representative flow cytometric analysis of TCRs expression from CD32+ cells isolated at day 8 of WNTd hPSC-derived hematopoietic cultures and then cultured as artificial thymic organoid (ATO) for 6 weeks. Gated on SSC/FSC/Live/CD45+CD3+. H9 hESCs, n = 4, independent; g) Representative flow cytometric analysis of CD3 and markers of T cell maturation and activation (CD45RA, left panel; CD25, middle panel and CD27, right panel) from CD32+ cells isolated at day 8 of WNTd hPSC-derived hematopoietic cultures and then cultured as artificial thymic organoid (ATO) for 6 weeks. Gated on SSC/FSC/Live/CD45+CD3+. H9 hESCs, n = 2, independent; h) Representative flow cytometric analysis of Vδ2 and Vδ1 from CD32+ cells isolated at day 8 of WNTd hPSC-derived hematopoietic cultures and Cord blood-derived CD34+ cells cultured as artificial thymic organoid (ATO) for 6 weeks. Gated on SSC/FSC/Live/CD45+CD56negTCRγδ+. H9 hESCs, n = 3, independent; i) Representative flow cytometric analysis showing CD45+CD56+ NK-cells derived from CD32+ cells isolated at day 8 of WNTd hPS cell-derived hematopoietic culture. Gated on SSC/FSC/Live. H1 hESCs. n = 3, independent. Source data
Extended Data Fig. 4
Extended Data Fig. 4. Characterization of the relationship between CD32+ and CD44+ cells in WNTd hPSC-derived hematopoietic differentiations.
a) Representative flow cytometric analysis of CD44 and DLL4 expression in day 8 WNTd hPSC-derived CD34+CD43neg cells. Gated on SSC/FSC/Live/CD34+CD43neg. H1 hESCs, n = 4, independent; b) Representative flow cytometric analysis of CD44 and DLL4 expression in day 8 WNTd hPSC-derived CD34+CD43negCD184negCD73neg cells. Two populations are highlighted within DLL4neg fraction: CD44+ in green and CD44neg in purple. Left panel: gated on SSC/FSC/Live/ CD34+CD43negCD184negCD73neg.Right panel, unstained control, gated on SSC/FSC/Live. H1 hESCs, n = 4, independent; c) Representative flow cytometric analysis of CD32 and CD44 expression in day 8 WNTd hPSC-derived hematopoietic cultures. Gated on SSC/FSC/Live/CD34+CD43negCD184negCD73negDLL4neg. n = 3, independent; d) Representative flow cytometric analysis of CD32 and CD44 expression in day 8 + 1 (left panel), day 8 + 2 (middle panel) and day 8 + 3 (right panel) after HEC culture of day 8 WNTd CD44+CD32neg cells. Gated on SSC/FSC/Live/CD34+CD45neg. H9 hESCs, n = 3, independent; e) and f) Photo-micrograph (left panel) and representative CD45 flow cytometric analysis of a clone composed by adherent non-hematopoietic cells e) or round hematopoietic cells f) derived from single CD32+ cell isolated at day 8 of WNTd hPSC-derived hematopoietic culture. Gated on SSC/FSC/Live. H1 hESCs, n = 3, independent.
Extended Data Fig. 5
Extended Data Fig. 5. Single-cell transcriptomic analysis identifies the heterogeneity of hPSC-derived HECs.
a) Violin plot showing normalized expression level of landmark genes as reported in. Differential expression was evaluated in CDH5 + RUNX1+PTPRCneg cells that either express FCGR2B (FCGR2B > 0), in orange, or do not (FCGR2B = 0), in blue; b) UMAP visualization of manually annotated cells and colour-coded by cell type. H1 hESCs, n = 1. HECs: hemogenic endothelial cells; ECs: endothelial cells; EndoMT: endothelial-to-mesenchyme transition; M phase: mitotic phase; c) Feature plot showing RUNX1 expression across clusters as in Fig. 5a; d) Feature plot showing FCGR2B expression across clusters 0, 1, 2, 11, 16, 17 that display RUNX1 as a differential marker; e) UMAP visualization of the pseudotime analysis by monocle3 showing the principal graph nodes and trajectory on the clusters with differential expression of RUNX1. Cells are coloured according to pseudotime; f) Pseudotime kinetics of the expression alteration of selected genes (H19, KCNK17, RUNX1, MYB, SPN) along the clusters with differential expression of RUNX1 (clusters 0, 1, 2, 11, 16, 17). Cells are coloured by the cluster identity. Lines denote relative average expression of each gene in pseudotime; g) UMAP visualization of the single-cell trajectory, as inferred by the PAGA-tree algorithm, focusing on clusters displaying RUNX1 as a differential marker; h) UMAP representation of the pseudotime analysis conducted using the PAGA-tree algorithm, highlighting cells from clusters 0, 1, 2, 11, 16, and 17, with color-coding corresponding to their respective pseudotime values;. i) UMAP visualization of the pseudotime analysis performed by CellOracle, illustrating cells from clusters 0, 1, 2, 11, 16, and 17, with each cell color-coded according to its pseudotime value.
Extended Data Fig. 6
Extended Data Fig. 6. Downregulation of CD32 signalling impairs hematopoietic development.
a) Quiver plot depicting summarized cell-state transition vectors, as simulated by CellOracle from clusters 0, 1, 2, 11, 16, and 17, with arrows indicating the predicted direction of developmental flow; b) Quiver plot illustrating the simulated cell-state shift vectors resulting from an in-silico CD32 KO, as modeled by CellOracle, with arrows highlighting the predicted alterations in developmental flow due to the FCGR2B knockout; c) Digitized grid representation of the CD32 KO simulation by CellOracle, with each section colored relying on Perturbation Scores (PS). Green indicates a negative PS, suggesting that the transcription factor perturbation inhibits differentiation, while purple signifies a positive PS, indicating promotion of differentiation. Single-cell transition vectors are aggregated at specific grid points; d) Representative map of the donor plasmid used to engineer H1 hPSCs to express 3x shRNAs to silence FCGR2B expression. Donor plasmid was inserted in AAVS1 locus by nucleofection with eCas9, the T2 gRNA plasmid, and p53 dominant negative (DD); e) Representative flow cytometry analysis showing CD32 and CD34 expression in day 8 wild-type (left panel) or CD32 KD (right panel) WNTd hPSC-derived CD34+CD43neg cells. Gated on SSC/FSC/Live/CD34+CD43neg. n = 4, independent; f) Bar plot showing the frequency of CD32+ within CD34+CD43neg cells at day 8 of WNTd hPSC-derived hematopoietic culture as in e). Mean ± SEM. One-tail paired Student’s t-test, nonparametric, for all biological replicates (n = 4,), *p = 0.02203. g) Bar plot showing the frequency of CD45+ derived from CD34+ cells isolated at day 8 of WNTd hPSC-derived hematopoietic culture as in Fig. 4g. Mean ± SEM. One-tail paired Student’s t-test, nonparametric, for all biological replicates (n = 5), *p = 0.0312. Source data
Extended Data Fig. 7
Extended Data Fig. 7. CD32 is expressed in WNT-independent hPSC-derived HECs.
a) Representative flow cytometric analysis showing the gating strategy to isolate CD32+ (orange) and CD32neg (blue) cells from day 8 of WNTi hPSC-derived. From the left, first panel: gated on SSC/FSC/Live. Second panel: gated on SSC/FSC/Live/CD34+CD43neg. Third and fourth panels: gated on SSC/FSC/Live/CD34+CD43negCD184negCD73neg. Fourth panel: unstained control. n = 7, independent; b) Bar plot showing the frequency of CD32+/negDLL4+/neg cells within day 8 of WNTi hPSC-derived CD34+CD43negCD184negCD73neg cells. Gated on SSC/FSC/Live/CD34+CD43negCD184negCD73neg. n = 7, independent, mean ± SEM; c) Quantification of erythro-myeloid CFC potential of CD32+/neg populations isolated at day 8 of WNTi hPSC-derived hematopoietic cultures. Mean ± SEM. One-tail paired Student’s t-test, nonparametric, for all biological replicates (n = 6, H1 hESCs), considering the total number of colonies, *p = 0.0111; d) Representative flow cytometric analysis showing CD45+CD56+ NK-cells derived from CD32+ cells isolated at day 8 of WNTi hPSC-derived hematopoietic culture. Gated on SSC/FSC/Live. H1 hESCs. n = 3, independent. Source data

References

    1. Jaffredo T, Gautier R, Eichmann A, Dieterlen-Lièvre F. Intraaortic hemopoietic cells are derived from endothelial cells during ontogeny. Development. 1998;125:4575–4583. doi: 10.1242/dev.125.22.4575. - DOI - PubMed
    1. DeBruijn MFTR, Speck NA, Peeters MCE, Dzierzak E. Definitive hematopoietic stem cells first develop within the major arterial regions of the mouse embryo. EMBO J. 2000;19:2465–2474. doi: 10.1093/emboj/19.11.2465. - DOI - PMC - PubMed
    1. Oberlin E, Tavian M, Blazsek I, Péault B. Blood-forming potential of vascular endothelium in the human embryo. Development. 2002;129:4147–4157. doi: 10.1242/dev.129.17.4147. - DOI - PubMed
    1. Zovein AC, et al. Fate tracing reveals the endothelial origin of hematopoietic stem cells. Cell Stem Cell. 2008;3:625–636. doi: 10.1016/j.stem.2008.09.018. - DOI - PMC - PubMed
    1. Bertrand JY, et al. Haematopoietic stem cells derive directly from aortic endothelium during development. Nature. 2010;464:108–111. doi: 10.1038/nature08738. - DOI - PMC - PubMed

Publication types

MeSH terms