. 2024 Apr 9;7(1):428.
doi: 10.1038/s42003-024-06123-7.

Visualizing subcellular changes in the NAD(H) pool size versus redox state using fluorescence lifetime imaging microscopy of NADH

Affiliations

Visualizing subcellular changes in the NAD(H) pool size versus redox state using fluorescence lifetime imaging microscopy of NADH

Angela Song et al. Commun Biol. .

Abstract

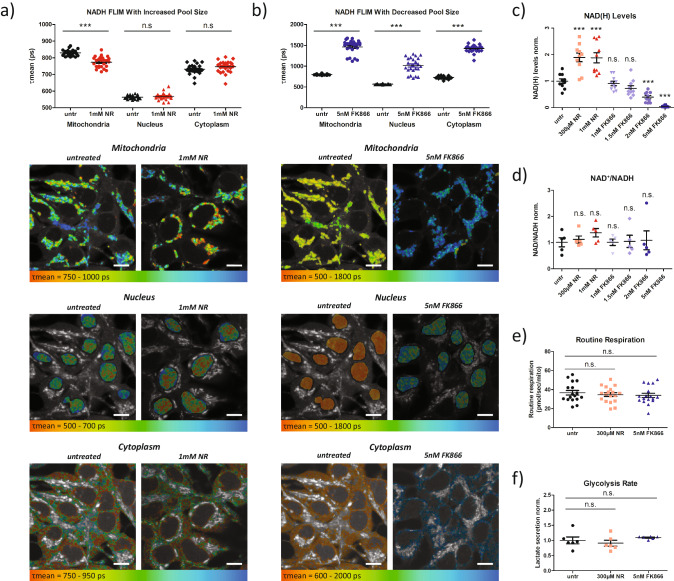
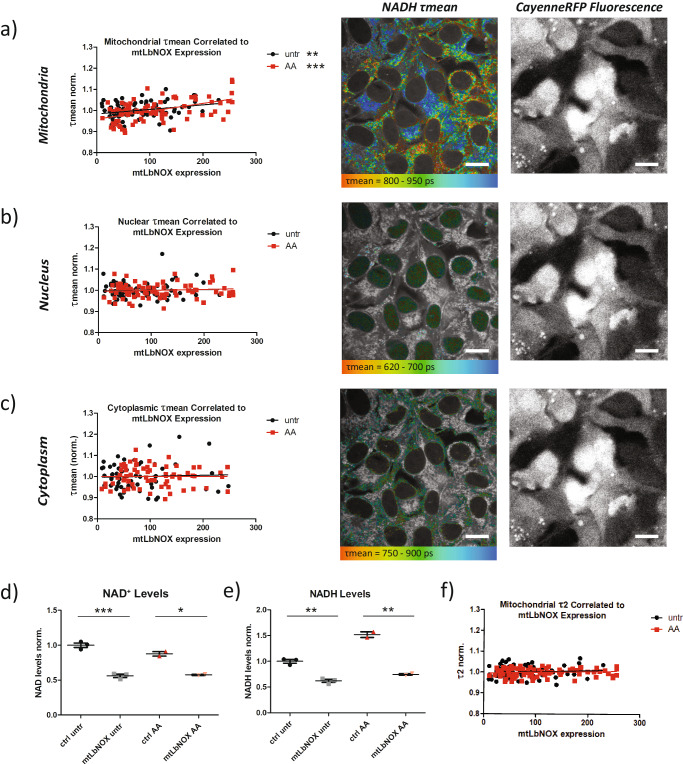
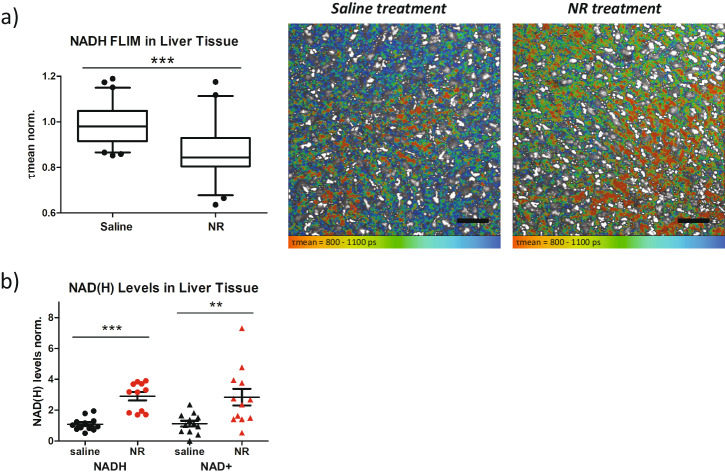
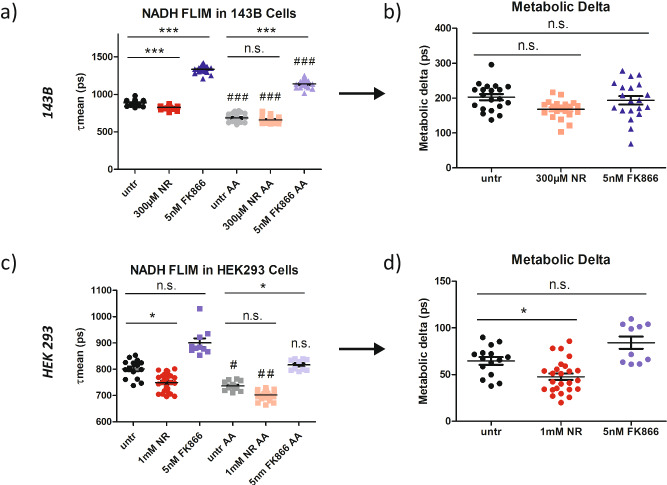
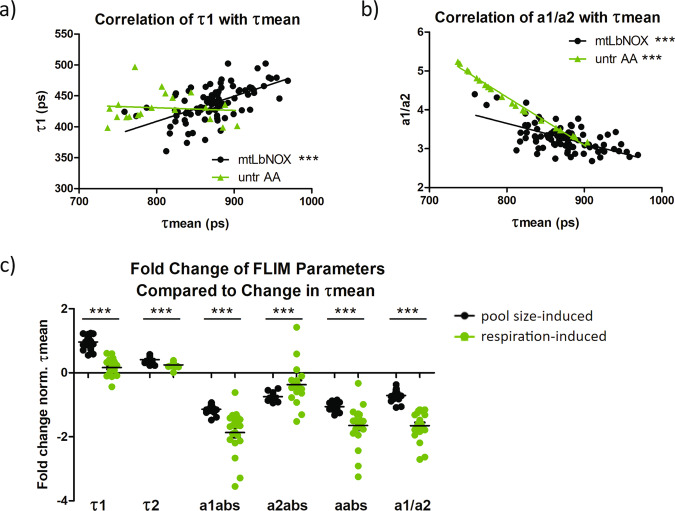
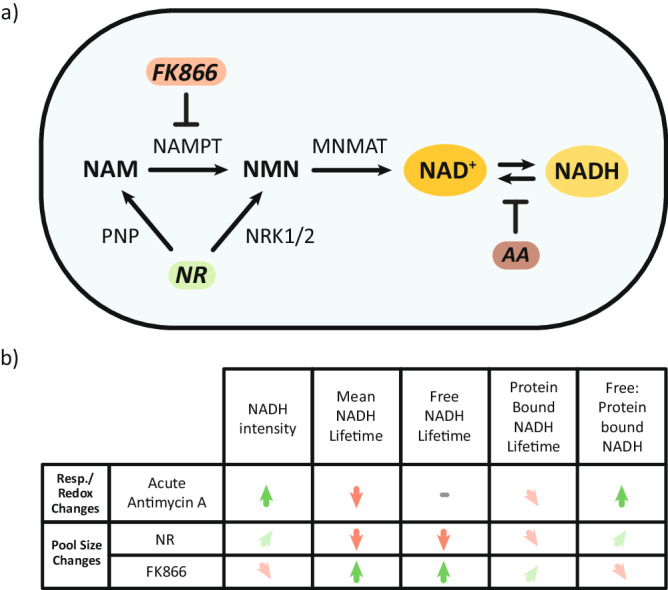
NADH autofluorescence imaging is a promising approach for visualizing energy metabolism at the single-cell level. However, it is sensitive to the redox ratio and the total NAD(H) amount, which can change independently from each other, for example with aging. Here, we evaluate the potential of fluorescence lifetime imaging microscopy (FLIM) of NADH to differentiate between these modalities.We perform targeted modifications of the NAD(H) pool size and ratio in cells and mice and assess the impact on NADH FLIM. We show that NADH FLIM is sensitive to NAD(H) pool size, mimicking the effect of redox alterations. However, individual components of the fluorescence lifetime are differently impacted by redox versus pool size changes, allowing us to distinguish both modalities using only FLIM. Our results emphasize NADH FLIM's potential for evaluating cellular metabolism and relative NAD(H) levels with high spatial resolution, providing a crucial tool for our understanding of aging and metabolism.


Conflict of interest statement

The authors declare the following competing interests: J.A.B. is consultant to Pfizer and Cytokinetics, an inventor on a patent for using NAD+ precursors in liver injury and has received research funding and materials from Elysium Health and Metro International Biotech, both of which have an interest in NAD+ precursors. D.C.W. is part of the scientific advisory boards for Pano Therapeutics and Medical Excellence Capital. All other authors declare no competing interests.

Figures

Fig. 1
Fig. 1. NADH FLIM is sensitive to changes in the NAD(H) pool size.
a Mean NADH lifetime (τmean) of mitochondria, nuclei, and cytoplasm in untreated and nicotinamide riboside (NR) treated HEK293 cells (n = 25 for both) with exemplary images encoding τmean in false-colors (red = shorter, blue = longer). Scale bars represent 10 microns. b Mean NADH lifetime (τmean) of mitochondria, nuclei, and cytoplasm in untreated and FK866 treated HEK293 cells (n = 25 for both) with exemplary images encoding τmean in false-colors (red = shorter, blue = longer). Scale bars represent 10 microns. NAD(H) pool size (c) and ratio (d) quantified biochemically upon different concentrations of NR and FK866 (n = 10 for all groups in (c), n = 5 for all groups in (d)). e Mitochondrial respiration (Routine respiration) of intact untreated HEK293 cells (n = 17), NR treated HEK293 cells (n = 18), and FK866 treated HEK293 cells (n = 17). f Lactate secretion rate as an estimate of anaerobic glycolysis (n = 6 for all groups). Each data point is independent. The bars indicate the mean and standard error. Significances were calculated using t tests between selected groups in (ad) and using ANOVA and Dunn’s post hoc test between selected groups in (e, f). For (c) and (d), significances are calculated against the untreated (untr) group. Significances are indicated as n.s. for not significant and *** for p < 0.001.
Fig. 2
Fig. 2. mtLbNOX supports the effect of NAD(H) pool size on NADH FLIM.
a Mean NADH lifetime (τmean) in mitochondria of antimycin A (AA) treated 143B cells normalized to average mitochondrial τmean in all AA treated cells (red), and in mitochondria of untreated 143B cells normalized to average mitochondrial τmean in all untreated cells (black), correlated to mtLbNOX expression (n = 86 for untr, n = 80 for AA). b Mean NADH lifetime (τmean) in nuclei of AA treated 143B cells normalized to average nuclear τmean in all AA treated cells (red), and in nuclei of untreated 143B cells normalized to average nuclear τmean in all untreated cells (black), correlated to mtLbNOX expression (n = 86 for untr, n = 80 for AA). c Mean NADH lifetime (τmean) in cytoplasm of AA treated 143B cells normalized to average cytoplasmic τmean in all AA treated cells (red), and in cytoplasm of untreated 143B cells normalized to average cytoplasmic τmean in all untreated cells (black), correlated to mtLbNOX expression (n = 57 for untr, n = 72 for AA). mtLbNOX expression was quantified by CayenneRFP fluorescence intensity. Representative FLIM images encode τmean in false-colors (red = shorter lifetime, blue = longer lifetime) and corresponding fluorescence intensity images show CayenneRFP fluoresence (used as a direct measure of mtLbNOX expression levels). NAD+ (d) and NADH (e) levels quantified biochemically with the NAD/NADH GloTM Assay (Promega) upon expression of mtLbNOX and AA treatment (n = 3 for untr, n = 2 for AA). f Protein-bound NADH lifetime (τ2) in mitochondria of AA treated 143B cells normalized to average mitochondrial τ2 in all AA treated cells (red), and in mitochondria of untreated 143B cells normalized to average mitochondrial τ2 in all untreated cells (black), correlated to mtLbNOX expression (n = 86 for untr, n = 80 for AA). Each data point is independent. Scale bars represent 20 microns. Correlations and significances for (a), (b), (c), and (f) were calculated using linear regression. The bars for (d) and (e) indicate the mean and standard error, and significances were calculated using t tests between selected groups and are indicated as * for p < 0.05, ** for p < 0.01, and *** for p < 0.001.
Fig. 3
Fig. 3. NADH pool size impacts FLIM imaging of mouse liver tissues.
a Mean NADH lifetime (τmean) of liver tissue for mice injected with saline (n = 60) or 500 mg/kg NR (n = 58). Representative FLIM images encode τmean in false-colors (red = shorter lifetime, blue = longer lifetime). Scale bars represent 20 microns. b NAD(H) levels quantified biochemically on tissues from mice treated with saline and NR (n = 12 for saline NADH, saline NAD+, and NR NAD+, n = 11 for NR NADH). Box in (a) shows mean and quartiles while whiskers show 95% confidence interval and data points represent outliers. Bars in (b) indicate the mean and standard error. Each data point is independent. Significances were calculated using t tests between selected groups and are indicated as ** for p < 0.01 and *** for p < 0.001.
Fig. 4
Fig. 4. Metabolic delta corrects for the impact of NAD(H) pool size in mitochondria.
a Mean NADH lifetime (τmean) of mitochondria in untreated, NR treated, and FK866 treated 143B cells before and after antimycin A (AA) treatment (1 µM) (n = 20 for all groups). b Metabolic delta of untreated, NR, and FK866 treated 143B cells calculated by subtracting individual points for mean lifetime after AA treatment from average mean lifetime before AA treatment for each treatment group (n = 20 for all groups). c Mean NADH lifetime (τmean) of mitochondria in untreated, NR treated, and FK866 treated HEK293 cells before and after antimycin A (AA) treatment (1 µM) (n = 15 for untr, n = 25 for 1 mM NR, n = 10 for 5 nM FK866). d Metabolic delta of untreated, NR, and FK866 treated HEK293 cells calculated by subtracting individual points for mean lifetime after AA treatment from average mean lifetime before AA treatment for each treatment group (n = 15 for untr, n = 25 for 1 mM NR, n = 10 for 5 nM FK866). Each data point is independent. The bars indicate the mean and standard error. Significances were calculated using ANOVA with Dunn’s post hoc test between selected groups for multiple comparisons and are indicated as n.s. for not significant, * for p < 0.05, and *** for p < 0.001.
Fig. 5
Fig. 5. NADH lifetime components allow differentiation between respiration and pool size induced lifetime changes in 143B cells.
τ1 (a) and a1/a2 (ratio of free to protein-bound NADH) (b) plotted against τmean for mtLbNOX treated cells (n = 86) and untreated/antimycin A treated cells (n = 20). Correlations and significances were calculated for each group using linear regression. c Fold change of FLIM lifetime components (τ1, τ2, a1abs, a2abs, aabs, and a1/a2) normalized to fold change in τmean between 143B cells treated with NR and FK866 (pool size-induced) and between untreated and antimycin A treated cells (respiration-induced) (n = 20 for both groups). Each data point is independent. The bars for (c) indicate the mean and standard error. Significances were calculated using t tests between selected groups and are indicated as *** for p < 0.001.
Fig. 6
Fig. 6. Respiration/redox changes and pool size changes differentially impact NADH FLIM parameters.
a NR increases NAD(H) pool size by feeding into the NAD+ synthesis pathway, while FK866 decreases NAD(H) pool size by inhibiting the pathway. Antimycin A (AA) alters the NAD+/NADH ratio by inhibiting complex III and respiration, preventing the conversion of NADH back to NAD+. b Summary table outlining the impact of pool size and respiration/redox changes on FLIM parameters. Green up arrows indicate increase while red down arrows indicate decrease. Angled arrows indicate smaller increases or decreases. The indicated changes depict overall tendencies across cell lines and tissues and do not relate to a specific measurement/result.

Similar articles

Cited by

References

    1. Wallace DC. A mitochondrial bioenergetic etiology of disease. J. Clin. Invest. 2013;123:1405–1412. doi: 10.1172/JCI61398. - DOI - PMC - PubMed
    1. Katsyuba E, et al. NAD. Nat. Metab. 2020;2:9–31. doi: 10.1038/s42255-019-0161-5. - DOI - PubMed
    1. Kim J, DeBerardinis RJ. Mechanisms and implications of metabolic heterogeneity in cancer. Cell Metab. 2019;30:434–446. doi: 10.1016/j.cmet.2019.08.013. - DOI - PMC - PubMed
    1. Niederschweiberer MA, et al. NADH fluorescence lifetime imaging microscopy reveals selective mitochondrial dysfunction in neurons overexpressing alzheimer’s disease-related proteins. Front Mol. Biosci. 2021;8:671274. doi: 10.3389/fmolb.2021.671274. - DOI - PMC - PubMed
    1. Chance B. Spectrophotometry of intracellular respiratory pigments. Science. 1954;120:767–775. doi: 10.1126/science.120.3124.767. - DOI - PubMed

Publication types