. 2024 Jun;27(6):1051-1063.
doi: 10.1038/s41593-024-01616-4. Epub 2024 Apr 9.

Single-cell long-read sequencing-based mapping reveals specialized splicing patterns in developing and adult mouse and human brain

Affiliations

Single-cell long-read sequencing-based mapping reveals specialized splicing patterns in developing and adult mouse and human brain

Anoushka Joglekar et al. Nat Neurosci. 2024 Jun.

Abstract

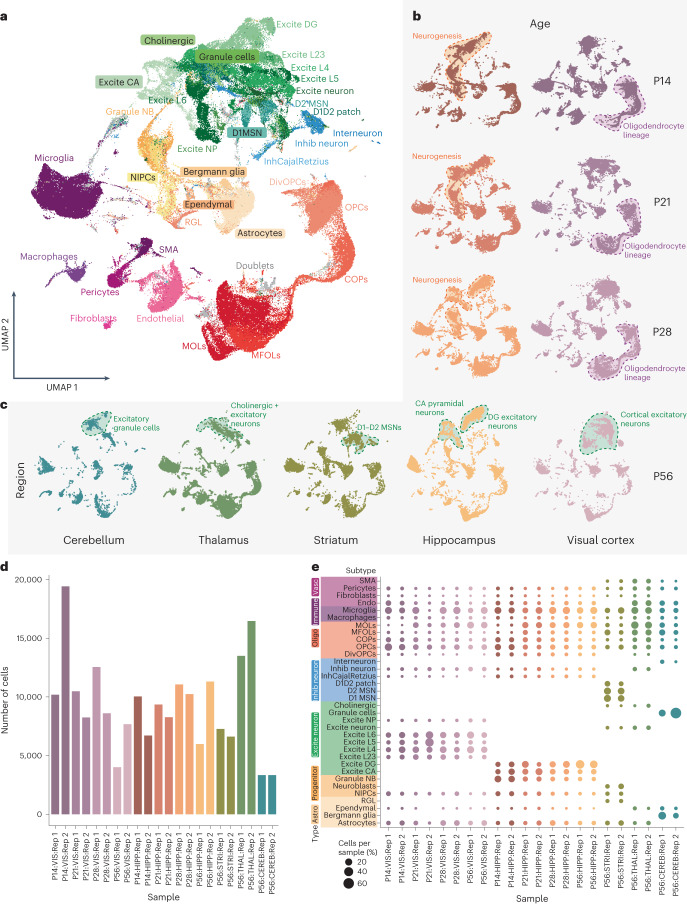
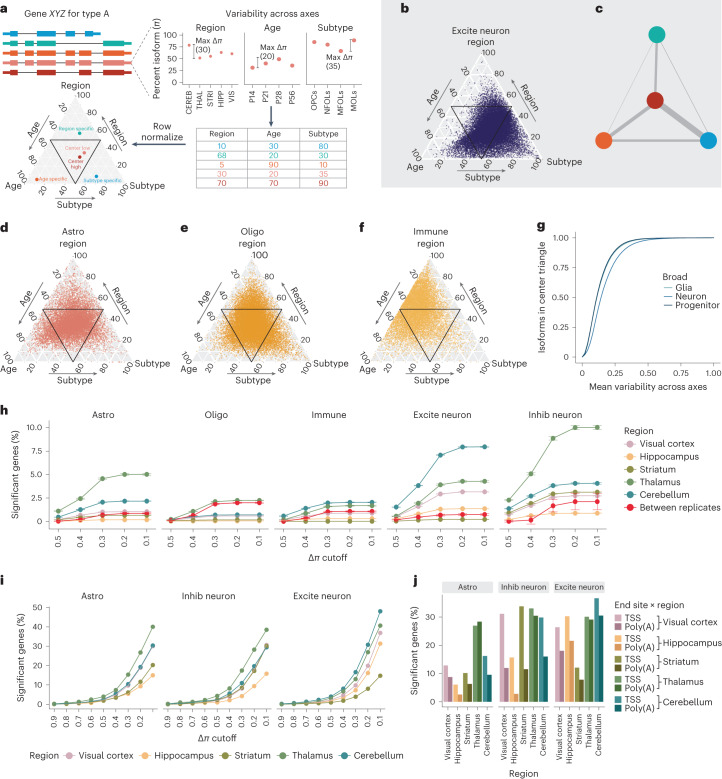
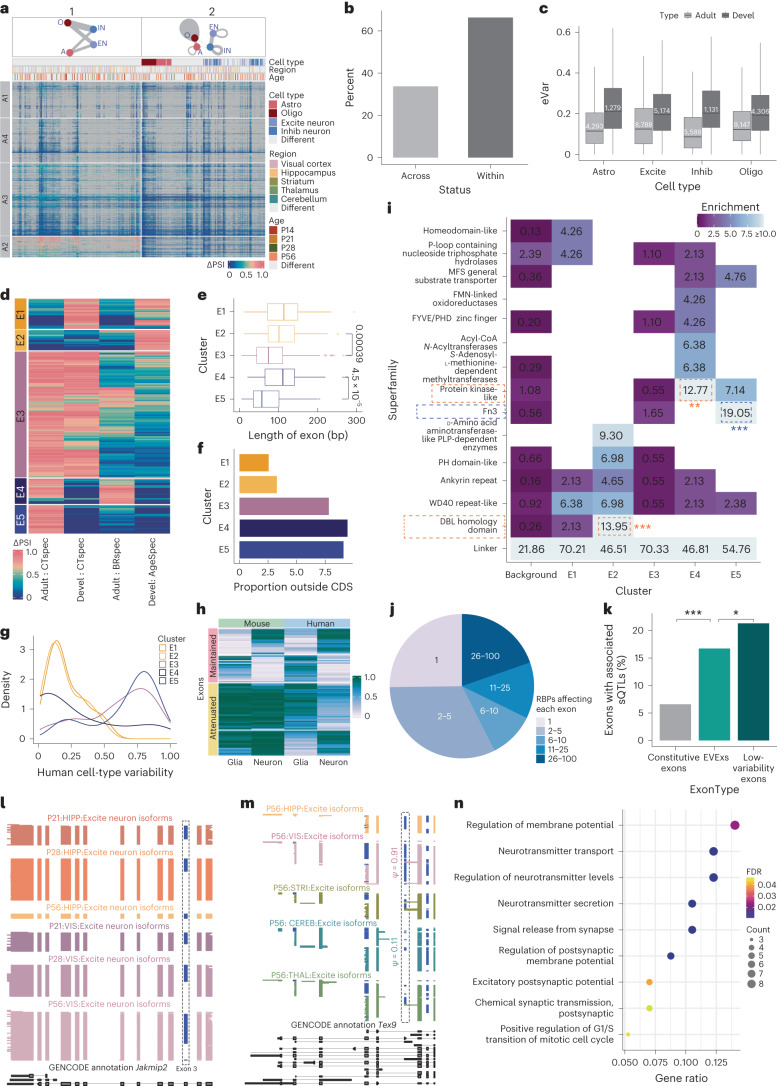
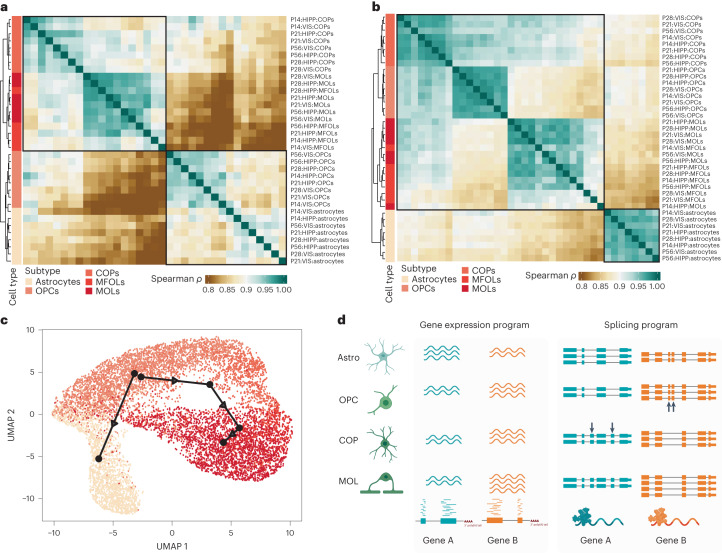
RNA isoforms influence cell identity and function. However, a comprehensive brain isoform map was lacking. We analyze single-cell RNA isoforms across brain regions, cell subtypes, developmental time points and species. For 72% of genes, full-length isoform expression varies along one or more axes. Splicing, transcription start and polyadenylation sites vary strongly between cell types, influence protein architecture and associate with disease-linked variation. Additionally, neurotransmitter transport and synapse turnover genes harbor cell-type variability across anatomical regions. Regulation of cell-type-specific splicing is pronounced in the postnatal day 21-to-postnatal day 28 adolescent transition. Developmental isoform regulation is stronger than regional regulation for the same cell type. Cell-type-specific isoform regulation in mice is mostly maintained in the human hippocampus, allowing extrapolation to the human brain. Conversely, the human brain harbors additional cell-type specificity, suggesting gain-of-function isoforms. Together, this detailed single-cell atlas of full-length isoform regulation across development, anatomical regions and species reveals an unappreciated degree of isoform variability across multiple axes.


Conflict of interest statement

L.C.N. has served as a scientific advisor for Abbvie, ViiV and Cytodyn for work unrelated to this project. The other authors declare no competing interests.

Figures

Fig. 1
Fig. 1. Summary of mouse brain cell subtype assignments by age and region.
a, UMAP embedding of all ~200,000 cells. Each dot represents a cell that is colored according to its cell type of origin based on marker gene annotation; Excite, excitatory; DG, dentate gyrus; L, layer; Inhib, inhibitory; MOLs, mature oligodendrocytes; MFOLs, myelin-forming oligodendrocytes; Granule NB, granule neuroblasts; SMA, smooth muscle actin cells; COPs, committed oligodendrocyte precursors; NIPCs, neuronal intermediate progenitor cells; RGL, radial–glia like cells; NP, neural progenitors; D1 MSN, D1 medium spiny neuron; D2 MSN, D2 medium spiny neuron; D1D2 patch, Patch D1 and D2 striatal; DivOPCs, dividing OPCs; InhCajalRetzius, inhibitory Cajal–Retzius cells. b, Same UMAP representation from a but split by time point for the hippocampal (browns) and visual cortex (purples) lineage. c, Same UMAP representation from a but split by the region of origin at P56; blue, cerebellum; green, thalamus; olive, striatum; yellow, hippocampus; lilac, visual cortex. d, Bar plot depicting the number of cells obtained from each single-cell experiment (11 samples × 2 biological replicates); VIS, visual cortex; HIPP, hippocampus; STRI, striatum; THAL, thalamus; CEREB, cerebellum. e, Dot plot showing the percentage of cells belonging to each cell subtype indicated on the y axis obtained from the samples on the x axis. The color of the dots indicates sample of origin, and the size of the dot indicates the percentage of cells belonging to a subtype per sample; Vasc, vascular; Endo, endothelial; Astro, astrocytes; Oligo, oligodendrocytes; Rep, replicate.
Fig. 2
Fig. 2. Distinct sources contribute to cell-type- and brain region-specific isoform expression in the mouse brain.
a, Outline of full-length isoform variability across developmental age, brain region and cell subtypes. b, Ternary plot of variability in three axes for excitatory neurons. c, Network diagram of genes with isoforms in more than one triangle. The thickness of the lines represents the number of such genes. df, Same as b for astrocytes (d), oligodendrocytes (e) and immune cells (f). g, Comparison of mean variability for three broad cell types. h, Percentage of genes showing significant differences in isoform expression after repeatedly (n = 100) downsampling astrocyte reads of one brain region versus astrocytes of all other brain regions at five ΔΠ cutoffs. The red curve represents the average percentage of significant genes when comparing two biological replicates of astrocytes within one brain region (n = 100 downsampling experiments averaged across N = 5 brain regions; left). The neighboring four plots depict the same for oligodendrocytes and immune cells and excitatory and inhibitory neurons. i, Same as in h but without downsampling for cell types indicated on the x axis. j, Percentage of genes with significant differences in TSS/poly(A) site choice for astrocytes of a fixed brain region versus astrocytes of all other brain regions at ΔΠ ≥ 0.1 (left). The neighboring plots depict the same for inhibitory (Inhib neuron) and excitatory (Excite neuron) neurons.
Fig. 3
Fig. 3. Marker exons underlying distinct splicing programs correlate with function and are conserved in humans.
a, ΔΨ heat map for pairwise cluster comparisons (columns) and exons (rows) where ΔΨ ≥ 0.25 in at least one comparison; ΔΨ, change in percent spliced index (PSI); O, oligodendrocytes; A, astrocytes; IN, inhibitory neurons; EN, excitatory neurons. b, Percentage of hVExs whose variability stems from a comparison of a matched cell type across brain regions or from two cell types in the same region. c, Maximal ΔΨ values for matched cell types across brain regions and across developmental time points. The numbers of exons per condition are indicated in the plot; Devel, development. d, Heat map of EVExs (rows) and axes of variation (columns: adult cell-type specificity (CTspec), developmental cell-type specificity, adult brain region specificity (BRspec) and developmental (Age) specificity of a matched cell type). The five EVEx classes are indicated in the bar on the left. e, Length distribution of five EVEx classes. P values were obtained from a Wilcoxon’s two-sided test without correcting for multiple tests. f, Noncoding fraction for five EVEx classes; CDS, coding sequence. g, Cell-type variability of mouse EVExs in the human hippocampus. h, Heat map of neuron and glia Ψ values for mice (left) and humans (right) for exons that have high cell-type specificity in humans. The left annotation bar indicates whether cell-type specificity was maintained (pink) or attenuated (yellow) in mice. i, Protein domains enriched in five EVEx classes. **P < 0.01, ***P < 105. j, Pie chart of the number of RBPs significantly affecting each exon identified from human cell line data. k, Bar chart of the percentage of exons associated with a known brain region-specific sQTL for exons classified as constitutive, EVEx or lowly variable in mice. P values were obtained by using a Fisher’s two-sided exact test; *P < 0.05; ***P < 2.2 × 10−16. l, Cluster-resolved single-cell long reads for the Jakmip2 gene. Each line is a single cDNA molecule. Blue exons indicate alternative exons. The top three tracks indicate hippocampal excitatory CA isoforms for P21, P28 and P56, and the next three tracks indicate the visual cortex excitatory isoforms from P21, P28 and P56. The bottom black track shows the GENCODE annotation. m, Similar as l for the Tex9 gene with tracks colored for brain region of origin for P56 excitatory neurons. Data in l and m were plotted with ScisorWiz. n, GO biological process annotations for EVExs in E4 from e; FDR, false discovery rate. For box plots in c and e, the center lines indicate the median, box limits indicate the upper and lower quartiles, and whiskers indicate 1.5× the interquartile range.
Fig. 4
Fig. 4. Neuronal exon inclusion changes between the mouse visual cortex and hippocampus and over time.
a, Heat map of pairwise correlations of exon inclusion (Ψ) for excitatory and inhibitory types. b, Box plot of pairwise correlations of Ψ values for pairs of excitatory subtypes (n = 30), all inhibitory subtypes (n = 12) and inhibitory subtypes excluding Cajal–Retzius cells (n = 8). The center lines indicate the median, box limits indicate the upper and lower quartiles, and whiskers indicate 1.5× the interquartile range. c, Correlations of exon inclusion for excitatory clusters between neighboring time points in the visual cortex (yellow). The same is presented for inhibitory clusters (green). d, Correlations of exon inclusion for excitatory clusters at each time point between the visual cortex and hippocampus (yellow). The same is presented for inhibitory clusters (green). In c and d, error bars indicate 95% confidence intervals around the Spearman’s correlation. e, Depiction of cell-type-resolved single-cell long reads for the Bin1 gene in excitatory neurons in the hippocampus and visual cortex. Each line represents one individual cDNA molecule, and blocks are colored by cell type and time point. Green represents alternative exons. Gray blocks indicate oligodendrocyte populations at P56. The bottom black track shows the GENCODE annotation.
Fig. 5
Fig. 5. Exon inclusion patterns in glial subtypes suggest an ordered molecular cascade.
a, Heat map based on pairwise correlations of exon inclusion patterns for astrocyte and oligodendrocyte lineage cells. b, Similar heat map based on pairwise gene expression values. c, Slingshot trajectory of glial cells using exon inclusion values. d, Model depiction summarizing the findings of the presented data. Subtypes in the oligodendrocyte lineage have similar gene expression patterns. However, a switch in splicing patterns occurs after OPCs have matured to committed oligodendrocyte precursors. Arrows represent alternative exons.
Fig. 6
Fig. 6. Developmental exon regulation reveals convergent and divergent patterns of exon variability.
a, Heat map of z-normalized exon variability between the four major cell types across development. b, Line plot of raw values of exon variability for individual genes in groups 3 (left) and 7 (right) for the visual cortex and heat map of exon variability for group 7 in the visual cortex (middle). Some show lower changes, whereas others exhibit drastic differences. c, Heat map of GO enrichment values for highly enriched sets of genes contributing to the nine groups from a. d, Depiction of time point-resolved single-cell long reads from visual cortex excitatory neurons for the Dnm2 gene. Each line represents one individual cDNA molecule. Alternative exons are denoted in orange and are marked A through D. e, Same as in d but for astrocyte (teal) and oligodendrocyte (sea green) clusters. The bottom black track shows the GENCODE annotation.

References

    1. Tasic B, et al. Adult mouse cortical cell taxonomy revealed by single cell transcriptomics. Nat. Neurosci. 2016;19:335–346. - PMC - PubMed
    1. Hochgerner H, Zeisel A, Lönnerberg P, Linnarsson S. Conserved properties of dentate gyrus neurogenesis across postnatal development revealed by single-cell RNA sequencing. Nat. Neurosci. 2018;21:290–299. - PubMed
    1. Zeisel A, et al. Molecular architecture of the mouse nervous system resource molecular architecture of the mouse nervous system. Cell. 2018;174:999–1014. - PMC - PubMed
    1. Saunders A, et al. Molecular diversity and specializations among the cells of the adult mouse brain. Cell. 2018;174:1015–1030. - PMC - PubMed
    1. Cohen OS, et al. Transcriptomic analysis of postmortem brain identifies dysregulated splicing events in novel candidate genes for schizophrenia. Schizophr. Res. 2012;142:188–199. - PMC - PubMed

Grants and funding