. 2024 Jun;115(6):1834-1850.
doi: 10.1111/cas.16171. Epub 2024 Apr 9.

Cytosolic DNA sensor AIM2 promotes KRAS-driven lung cancer independent of inflammasomes

Affiliations

Cytosolic DNA sensor AIM2 promotes KRAS-driven lung cancer independent of inflammasomes

Mohammad Alanazi et al. Cancer Sci. 2024 Jun.

Abstract

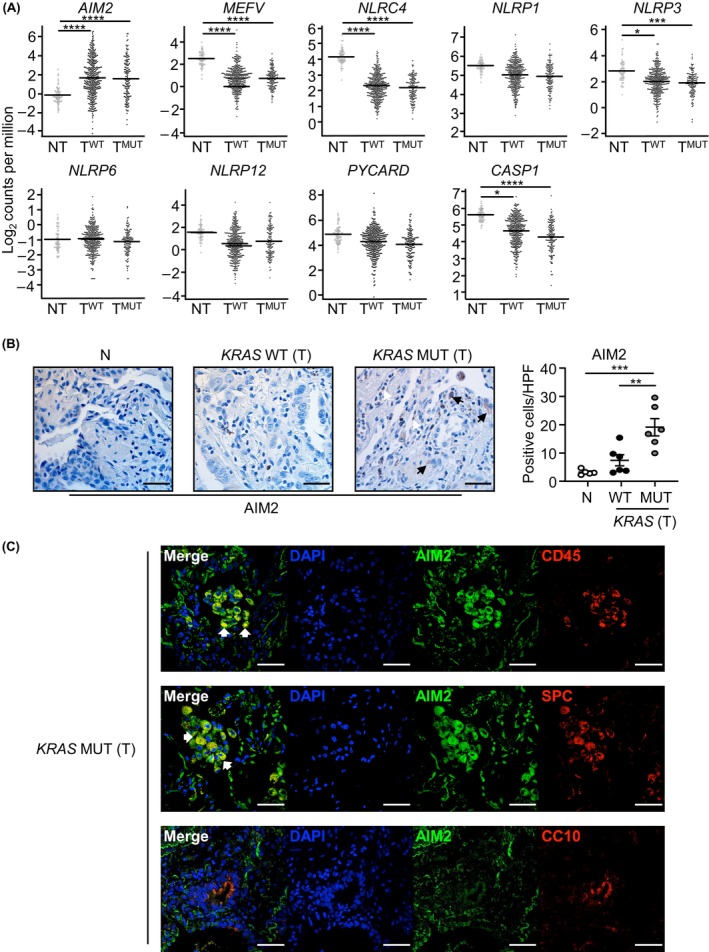
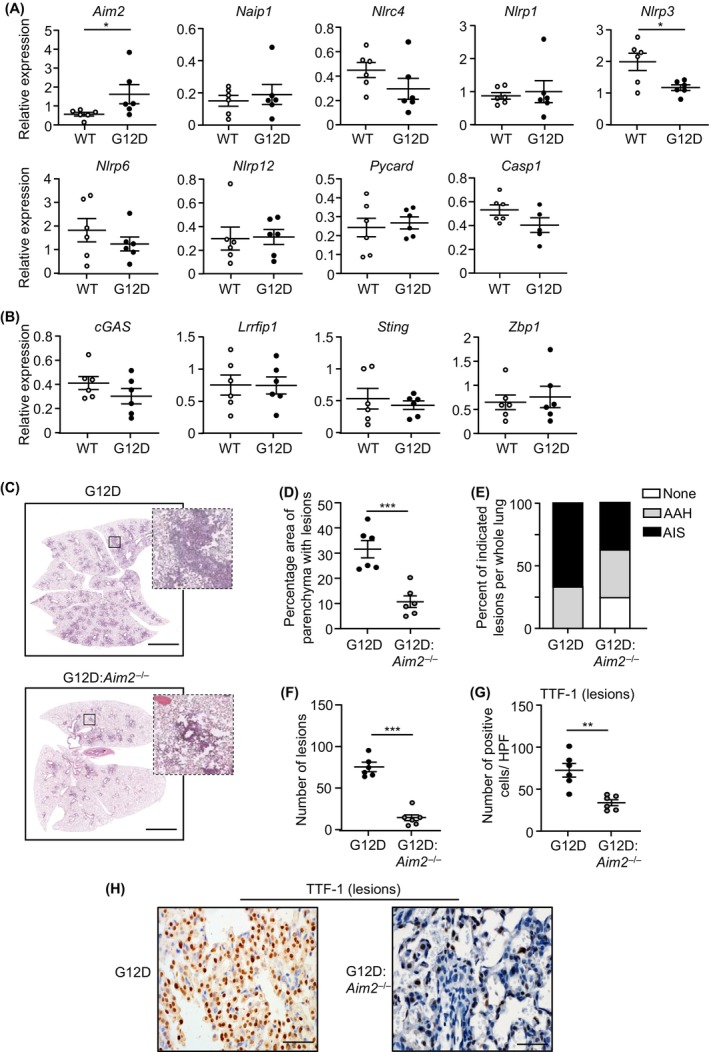
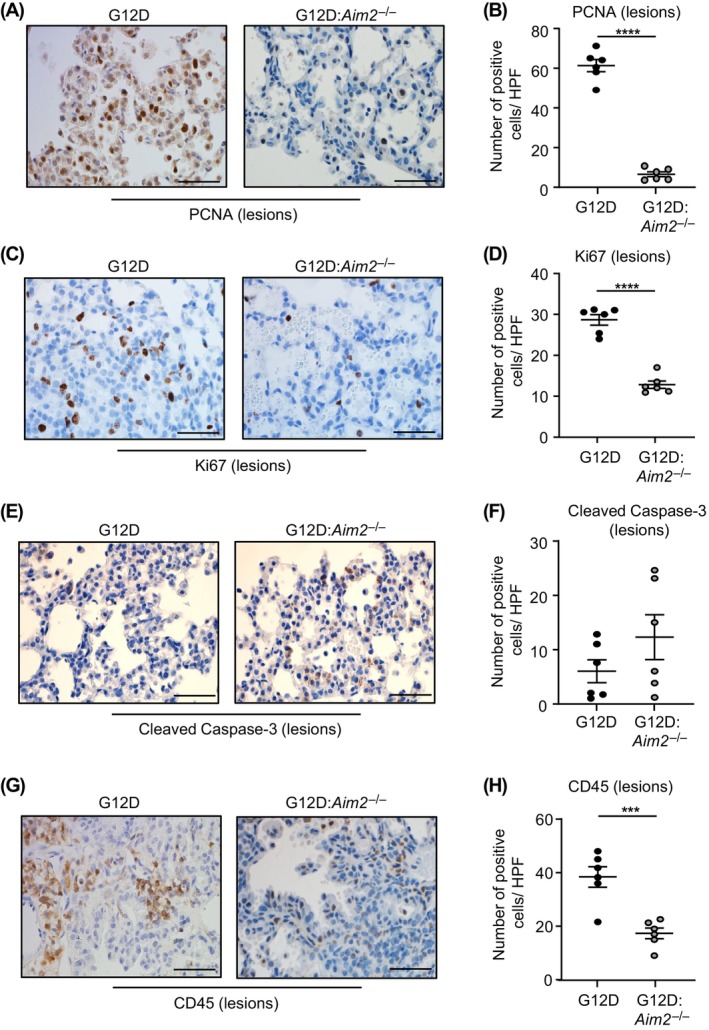
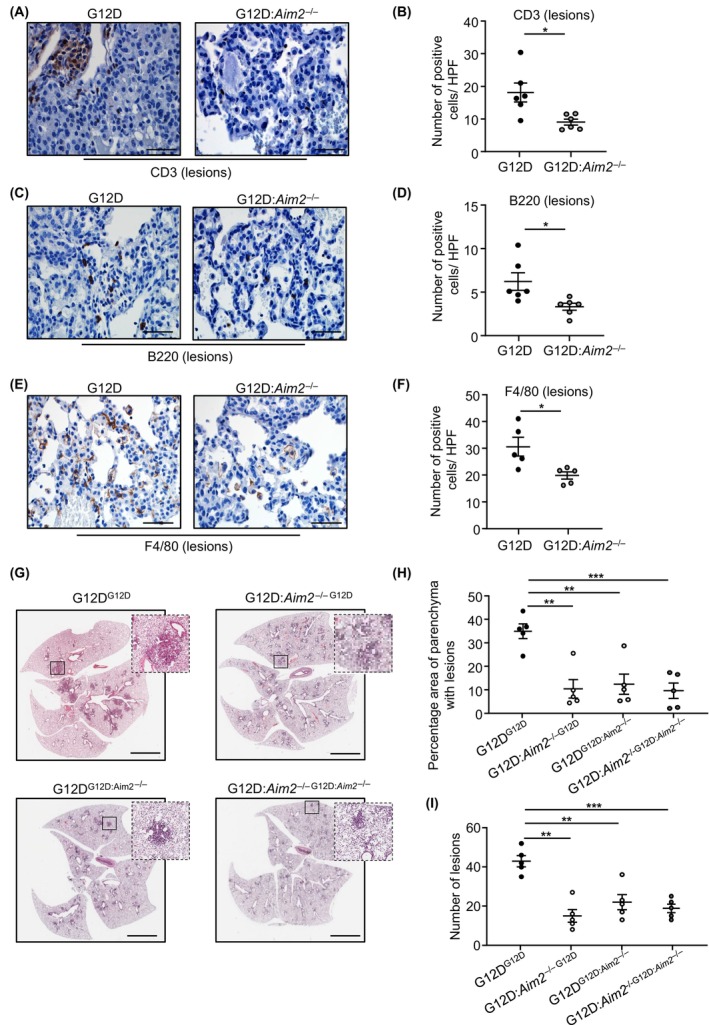
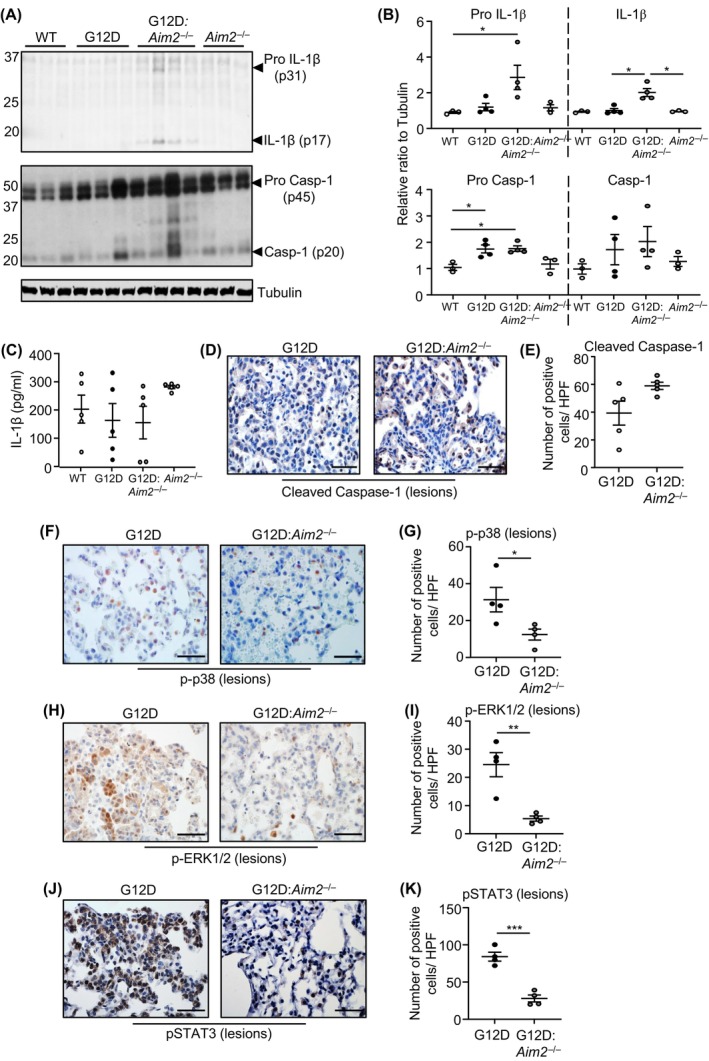
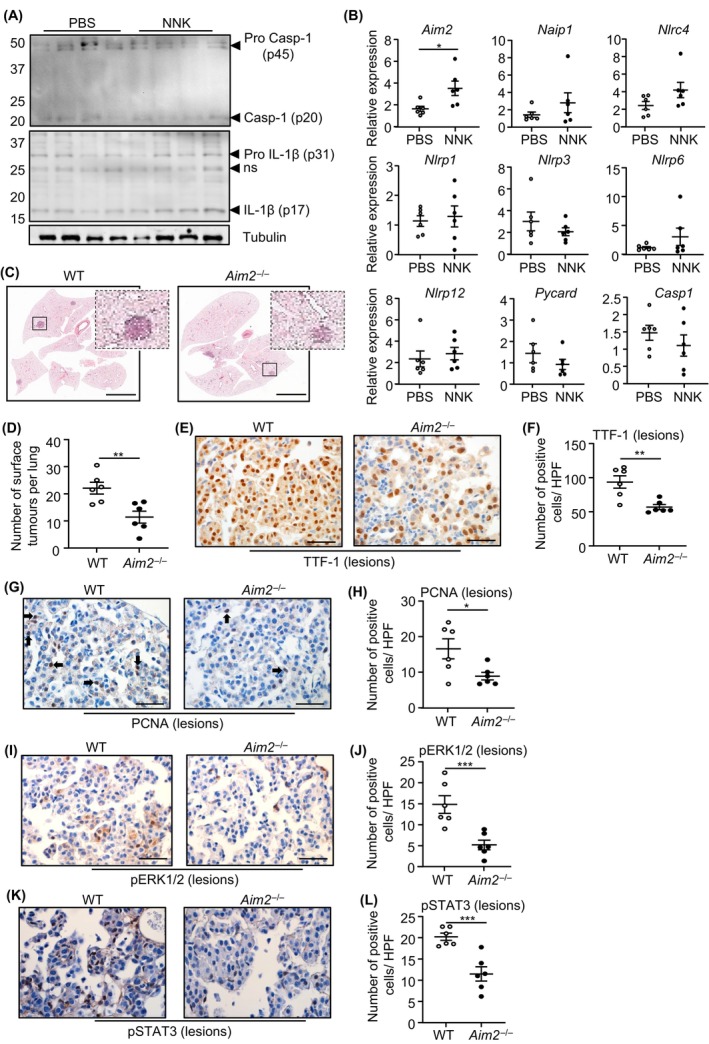
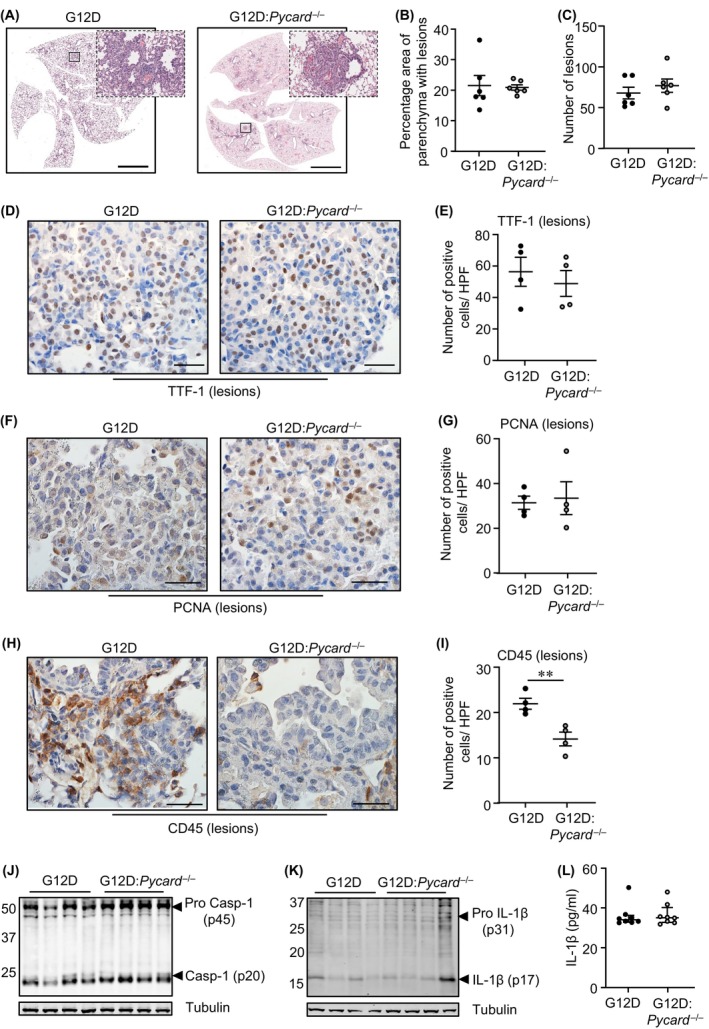
Constitutively active KRAS mutations are among the major drivers of lung cancer, yet the identity of molecular co-operators of oncogenic KRAS in the lung remains ill-defined. The innate immune cytosolic DNA sensor and pattern recognition receptor (PRR) Absent-in-melanoma 2 (AIM2) is best known for its assembly of multiprotein inflammasome complexes and promoting an inflammatory response. Here, we define a role for AIM2, independent of inflammasomes, in KRAS-addicted lung adenocarcinoma (LAC). In genetically defined and experimentally induced (nicotine-derived nitrosamine ketone; NNK) LAC mouse models harboring the KrasG12D driver mutation, AIM2 was highly upregulated compared with other cytosolic DNA sensors and inflammasome-associated PRRs. Genetic ablation of AIM2 in KrasG12D and NNK-induced LAC mouse models significantly reduced tumor growth, coincident with reduced cellular proliferation in the lung. Bone marrow chimeras suggest a requirement for AIM2 in KrasG12D-driven LAC in both hematopoietic (immune) and non-hematopoietic (epithelial) cellular compartments, which is supported by upregulated AIM2 expression in immune and epithelial cells of mutant KRAS lung tissues. Notably, protection against LAC in AIM2-deficient mice is associated with unaltered protein levels of mature Caspase-1 and IL-1β inflammasome effectors. Moreover, genetic ablation of the key inflammasome adapter, ASC, did not suppress KrasG12D-driven LAC. In support of these in vivo findings, AIM2, but not mature Caspase-1, was upregulated in human LAC patient tumor biopsies. Collectively, our findings reveal that endogenous AIM2 plays a tumor-promoting role, independent of inflammasomes, in mutant KRAS-addicted LAC, and suggest innate immune DNA sensing may provide an avenue to explore new therapeutic strategies in lung cancer.

Keywords: cell proliferation; inflammasome; innate immunity; lung cancer; pattern recognition receptors.


Conflict of interest statement

The author declares no conflict of interest.

Figures

FIGURE 1
FIGURE 1
Elevated AIM2 expression in immune and epithelial cells of human KRAS‐mutant LAC lung biopsies. (A) Gene expression of inflammasome‐associated components in KRAS‐mutant (MUT) tumor (T; n = 138) and KRAS wild‐type (WT) tumor (n = 375) versus non‐tumor (NT; n = 59) tissues from TCGA LAC patients. False discovery rate adjusted p‐values: *p < 0.05, ***p < 0.001, ****p < 0.0001. (B) Representative images of AIM2‐stained lung sections from non‐cancer (N) and tumor (T) tissues from an Australian LAC patient cohort stratified into KRAS wild‐type or mutant. Scale bars: 100 μm. The graph depicts quantification of AIM2‐positive cells/high‐power field (HPF) in human lung biopsies (n = 5–6/group). (C) Representative immunofluorescence images of lung tumor sections from a KRAS‐mutant LAC patient co‐stained for AIM2 (green) and total immune cells (CD45, red, top panel), alveolar type‐II cells (surfactant protein‐C (SPC), red, middle panel), and club cells (CC10, red, bottom panel). DAPI nuclear staining is blue. Scale bars: 50 μm. White arrowheads, representative dual‐positive AIM2‐expressing immune (top panel) and alveolar type‐II (middle panel) cells.
FIGURE 2
FIGURE 2
AIM2 deficiency suppresses oncogenic Kras‐induced LAC. (A, B) qPCR of (A) inflammasome‐associated pattern recognition receptors and effectors, and (B) cytosolic DNA sensors, in mouse lungs (n = 6/genotype). *p < 0.05, Student's t‐test. (C) Representative low‐power images of H&E‐stained lung sections from Kras G12D and Kras G12D:Aim2 −/− mice at 6 weeks post Ad‐Cre inhalation. Insets depict magnified areas comprising lesions in the low‐power images (open squares). Scale bars: 3 mm. (D–F) Quantification of (D) lung parenchyma area containing tumor lesions, (E) lesion histological classification, and (F) tumor incidence, per whole mouse lung (n = 6/genotype). ***p < 0.001, Student's t‐test. AAH, atypical adenomatous hyperplasia; AIS, adenocarcinoma in situ. (G) Quantification of TTF‐1‐positive cells/high‐power field (HPF) in lung lesions (n = 6/genotype). **p < 0.01, Student's t‐test. (H) Representative images of TTF‐1‐stained lung sections from Kras G12D and Kras G12D:Aim2 −/− mice at 6 weeks post Ad‐Cre. Scale bars: 100 μm.
FIGURE 3
FIGURE 3
Reduced tumor cell proliferation and inflammation in Kras G12D:Aim2 −/− mouse lungs. (A, C, E, G) Representative images of lung sections containing lesions from Kras G12D and Kras G12D:Aim2 −/− mice at 6 weeks post Ad‐Cre immunostained with antibodies against (A) PCNA, (C) Ki67, (E) cleaved Caspase‐3, and (G) CD45. Scale bars: 100 μm. (B, D, F, H) Quantification of positive cells/high‐power field (HPF) in lesion‐bearing mouse lungs immunostained with antibodies against (B) PCNA, (D) Ki67, (F) cleaved Caspase‐3, and (H) CD45 (n = 6/genotype). ***p < 0.001, ****p < 0.0001, Student's t‐test.
FIGURE 4
FIGURE 4
AIM2 promotion of KRAS‐driven LAC augments immune cell infiltrates, and requires hematopoietic and non‐hematopoietic cellular compartments. (A, C, E) Representative images of lung sections containing lesions from Kras G12D and Kras G12D:Aim2 −/− mice at 6 weeks post Ad‐Cre inhalation immunostained with antibodies against (A) CD3, (C) B220 and (E) F4/80. Scale bars: 100 μm. (B, D, F) Quantification of positive cells/high‐power field (HPF) in lesion‐bearing mouse lungs immunostained with antibodies against (B) CD3, (D) B220 and (F) F4/80 (n = 6/genotype). *p < 0.05, Student's t‐test. (G) Representative images of H&E‐stained lung sections from Kras G12D (G12D) or Kras G12D:Aim2 −/− (G12D:Aim2 −/−) recipient mice reconstituted with Kras G12D or Kras G12D:Aim2 −/− donor bone marrow (indicated in superscript font). Insets depict magnified areas comprising lesions in the low‐power images (open squares). Scale bars: 3 mm. (H, I) Quantification of (H) lung parenchyma area containing tumor lesions, and (I) tumor incidence, per whole mouse lung in chimeras (n = 5/group). **p < 0.01, ***p < 0.001; One‐way ANOVA.
FIGURE 5
FIGURE 5
AIM2‐driven LAC in Kras G12D mice is independent of inflammasome activation, yet aligns with STAT3, ERK1/2 and p38 MAPK signaling. (A) Immunoblots of individual lung lysates from Kras WT, Kras G12D, Kras G12D:Aim2 −/− and Aim2 −/− mice at 6 weeks post Ad‐Cre (Kras G12D, Kras G12D:Aim2 −/−) or PBS vehicle (Kras WT, Aim2 −/−) inhalation with indicated antibodies. (B) Densitometry of blots from (A), with expression levels relative to Tubulin loading. *p < 0.05, one‐way ANOVA. (C) ELISA for total IL‐1β protein levels in the serum of mice at 6 weeks post inhalations (n = 5/genotype). (D, F, H, J) Representative images of (D) cleaved Caspase‐1, (F) phosphorylated (p) p38 MAPK, (H) pERK1/2, and (J) pSTAT3 immunostaining of lung sections containing lesions from Kras G12D and Kras G12D:Aim2 −/− mice at 6 weeks post Ad‐Cre. Scale bars: 100 μm. (E, G, I, K) Quantification of (E) cleaved Caspase‐1, (G) pp38 MAPK, (I) pERK1/2, and (K) pSTAT3 positive cells/high‐power field (HPF) in mouse lung lesions (n = 4/genotype). *p < 0.05, **p < 0.01, ***p < 0.001, Student's t‐test.
FIGURE 6
FIGURE 6
AIM2 promotes NNK tobacco carcinogen‐induced LAC independent of inflammasome activation. (A) Immunoblots with antibodies of individual lung lysates from pseudo‐A/J wild‐type (WT) mice at 20 weeks post NNK or PBS administration. ns, non‐specific. (B) qPCR of inflammasome‐associated genes in lungs from pseudo‐A/J WT mice at 20 weeks post NNK or PBS (n = 6/genotype). *p < 0.05, Student's t‐test. (C) Representative low‐power images of H&E‐stained lung sections from WT and Aim2 −/− pseudo‐A/J mice at 20 weeks post NNK or PBS. Insets depict magnified areas comprising lesions in the low‐power images (open squares). Scale bars: 3 mm. (D) Quantification of surface tumor lesions/whole mouse lung in WT and Aim2 −/− pseudo‐A/J mice at 20 weeks post NNK (n = 6/genotype). **p < 0.01, Student's t‐test. (E, G, I, K) Representative images of (E) TTF‐1, (G) PCNA, (I) pERK1/2 MAPK, and (K) pSTAT3 immunostaining of lung lesions from WT and Aim2 −/− pseudo‐A/J mice at 20 weeks post NNK. Scale bars: 100 μm. (F, H, J, L) Quantification of (F) TTF‐1, (H) PCNA, (J) pERK1/2 MAPK, and (L) pSTAT3 positive cells/high‐power field (HPF) in mouse lung lesions (n = 6/genotype). *p < 0.05, ***p < 0.001, Student's t‐test.
FIGURE 7
FIGURE 7
Genetic ablation of ASC in Kras G12D:Pycard −/− mice does not suppress LAC. (A) Representative low‐power images of H&E‐stained lung sections from Kras G12D and Kras G12D:Pycard −/− mice at 6 weeks post Ad‐Cre inhalation. Insets depict magnified areas comprising lesions in the low‐power images (open squares). Scale bars: 5 mm. (B, C) Quantification of (B) lung parenchyma containing tumor lesions, and (C) tumor incidence, per whole mouse lung (n = 6/genotype). (D, F, H) Representative images of lung sections containing lesions from Kras G12D and Kras G12D:Pycard −/− mice at 6 weeks post Ad‐Cre inhalation immunostained with antibodies against (D) TTF‐1, (F) PCNA, and (H) CD45. Scale bars: 100 μm. (E, G, I) Quantification of positive cells/high‐power field (HPF) in lesion‐bearing mouse lungs immunostained with antibodies against (E) TTF‐1, (G) PCNA, and (I) CD45 (n = 4/genotype). **p < 0.01, Student's t‐test. (J, K) Immunoblots of lung lysates from Kras G12D and Kras G12D:Pycard −/− mice at 6 weeks post Ad‐Cre with antibodies against pro and mature (J) Caspase‐1 (p45, p20) and (K) IL‐1β (p31, p17). (L) ELISA for total IL‐1β protein levels in the serum of mice at 6 weeks post inhalations (n = 8/genotype).

References

    1. Wong MCS, Lao XQ, Ho KF, Goggins WB, Tse SLA. Incidence and mortality of lung cancer: global trends and association with socioeconomic status. Sci Rep. 2017;7(1):14300. - PMC - PubMed
    1. Inamura K. Lung cancer: understanding its molecular pathology and the 2015 WHO Classification. Front Oncol. 2017;7:193. - PMC - PubMed
    1. Ahrendt SA, Decker PA, Alawi EA, et al. Cigarette smoking is strongly associated with mutation of the K‐ras gene in patients with primary adenocarcinoma of the lung. Cancer. 2001;92(6):1525‐1530. - PubMed
    1. Arbour KC, Jordan E, Kim HR, et al. Effects of Co‐occurring genomic alterations on outcomes in patients with KRAS‐mutant non‐small cell lung cancer. Clin Cancer Res. 2018;24(2):334‐340. - PMC - PubMed
    1. Meng D, Yuan M, Li X, et al. Prognostic value of K‐RAS mutations in patients with non‐small cell lung cancer: a systematic review with meta‐analysis. Lung Cancer. 2013;81(1):1‐10. - PubMed

MeSH terms