Review
. 2024 Mar 26:14:1321694.
doi: 10.3389/fonc.2024.1321694. eCollection 2024.

Prostate cancer research: tools, cell types, and molecular targets

Affiliations
Review

Prostate cancer research: tools, cell types, and molecular targets

Alvin Y Liu. Front Oncol. .

Abstract

Multiple cancer cell types are found in prostate tumors. They are either luminal-like adenocarcinoma or less luminal-like and more stem-like non-adenocarcinoma and small cell carcinoma. These types are lineage related through differentiation. Loss of cancer differentiation from luminal-like to stem-like is mediated by the activation of stem cell transcription factors (scTF) such as LIN28A, NANOG, POU5F1 and SOX2. scTF expression leads to down-regulation of β2-microglobulin (B2M). Thus, cancer cells can change from the scTF˜B2Mhi phenotype of differentiated to that of scTF˙B2Mlo of dedifferentiated in the disease course. In development, epithelial cell differentiation is induced by stromal signaling and cell contact. One of the stromal factors specific to prostate encodes proenkephalin (PENK). PENK can down-regulate scTF and up-regulate B2M in stem-like small cell carcinoma LuCaP 145.1 cells indicative of exit from the stem state and differentiation. In fact, prostate cancer cells can be made to undergo dedifferentiation or reprogramming by scTF transfection and then to differentiate by PENK transfection. Therapies need to be designed for treating the different cancer cell types. Extracellular anterior gradient 2 (eAGR2) is an adenocarcinoma antigen associated with cancer differentiation that can be targeted by antibodies to lyse tumor cells with immune system components. eAGR2 is specific to cancer as normal cells express only the intracellular form (iAGR2). For AGR2-negative stem-like cancer cells, factors like PENK that can target scTF could be effective in differentiation therapy.

Keywords: AGR2 immunotherapy; cancer cell reprogramming; cancer differentiation; differentiation therapy; lineage relationship; stem cell transcription factors; stromal PENK.


Conflict of interest statement

The author declares that the research was conducted in the absence of any commercial or financial relationships that could be construed as a potential conflict of interest.

Figures

Figure 1
Figure 1
Cell-type CD pattern. (A) Top: CD antigens present in the different cell types of the prostate are indicated by color fill-ins. A paler hue denotes lower expression. The arrows point to the close similarity between the CD phenotypes of G3 cancer cells and luminal cells. Bottom: serial sections of one tissue specimen show staining of the CD antibodies indicated. Benign glands are at the top, and tumor glands are at the bottom. (B) Shown are reactivities of the CD antibodies on renal cells indicated in the photomicrographs. Positivity is scored by brown staining. The tissue specimens are tagged by an alphanumeric identifier. The left panel shows staining pattern of glomeruli, and the right panel shows that of tubular cells. A renal cell carcinoma (RCC) specimen is stained for CD26, CD57, and CD90. (C) The pancreatic islet cells in serially sectioned specimen 01-181E3 are positive for CD99R and insulin (INS). The bottom photomicrographs show CD99R staining of other areas of the tissue section at 10× and 4× magnification.
Figure 2
Figure 2
Prostate PCA plot. (A) The principal component axes of PC1, PC2, and PC3 are marked in the 3D display. The color cubes represent prostate cell-type transcriptome data points where L, luminal; S, stromal; B, basal; E, endothelial; ES, embryonic stem; EC, embryonal carcinoma, and iPS, induced pluripotent stem. (B) Transcriptome data points of CD26 G3 and G4 cancer and CD90 CP stromal are incorporated to show the gene expression difference from their respective normal counterparts, L and S. The distance between two data points, Δ, is a measure of differential gene expression. (C) The transcriptome data points of cells harvested by laser-capture microdissection, NP (black cubes) or CP (blue), are seen “intermingled” in one area of the PCA plot. In contrast, the transcriptome data points of L, B, and S are in separate areas. Unlike NP vs. CP, L vs. cancer G3, G4 (yellow) and S vs. CP stromal (green) are segregated in different areas.
Figure 3
Figure 3
AGR2 and CD10 in prostate cancer. (A) Top: tumor glands in specimen 99-010D (mainly in lower 2/3 of the section) are AGR2+CD10, whereas benign glands (some in the upper 1/3 of the section outlined in red) are AGR2CD10+. The yellow circle outlines a portion of the benign gland with AGR2+CD10 cells. Bottom: the histogram displays DNA microarray signal intensity values of AGR2 in luminal cells, G3, and G4 cancer cells. The values (y-axis) were retrieved from the Affymetrix microarray datasets archived in our SCGAP Urologic Epithelial Stem Cells Project (UESC) (28). They represent the average after clicking coalesce replicates and probe sets. Dataset query of this public database is described in Ref. 115. (B) Top: Shown are four representative sections of bone and soft tissue metastases identified by case numbers stained for AGR2 and CD10. Their AGR2/CD10 phenotypes are indicated. All four have strong AGR2 reactivity, while two have moderate to weak CD10 reactivity. Bottom: AGR2 was measured by ELISA in metastasis specimens (obtained from either surgery* or autopsy) and selected cell lines identified on the x-axis. The tumor specimens were minced and digested by collagenase, and the cell-free supernatants were analyzed as were media supernatant of cultured cell lines C4-2, C4-2B, PC3, and CL1. OD405 absorbance readings of the chromogenic dye are indicated on the y-axis. The line indicates the level obtained with buffer/media. (C) Prostate cells are tagged by AGR2 and CD10 expression for different AGR2/CD10 cancer phenotypes. The prefix “e” denotes the extracellular and “i” denotes the intracellular forms of these two proteins.
Figure 4
Figure 4
Reprogramming of adenocarcinoma cells. (A) The photomicrographs (left) show (A, B) scTF-transfected LuCaP 70CR* on culture days indicated, (C) mock-transfected LuCaP 70R, and (D) PC3. A similar cell appearance is seen between cultures of LuCaP 70CR* and PC3. The photomicrographs (right) show cultures of other similarly transfected LuCaP lines. (B) The PCA plot shows placements of the LuCaP 70CR and LuCaP 70CR* data points in relation to those of other cancer cell-type data points. A possible lineage (arrows) could be traced from luminal-like to more stem-like cancer cell types.
Figure 5
Figure 5
Stromal induction of EC cells. (A) The 3D PCA displays (in two orientations) show the “transcriptome migration” of NP stromal-induced NCCIT cells from that of stem cells (0 h) to that of stromal cells (S = CD49a-sorted, S_LCM = laser-capture microdissected, S_Pr = cultured) in a time course of 7 d. (B) Shown are selected genes induced in NCCT by stromal cell media. Panel A shows the temporal appearance of STC1, PENK, and STC2 by PSCM (prostate stromal media) vs. BSCM (bladder stromal media). Panel B shows the levels of PENK in different cell types. Panel C shows the downregulation of scTF (blue arrows) and upregulation of B2M (red arrow) in PSCM-induced NCCIT. Panel D shows a comparison between PSCM and BSCM induction. Array signal intensity values are indicated on the y-axis. (C) Top left: the three immunohistochemistry photomicrographs show human (h)Bladder and mouse (m)Bladder proximal lamina propria stained by CD13, while the human (h)Prostate stroma is negative, and the epithelial glands are positive (arrows). Top middle: the identified differentially expressed genes between CD49a prostate and CD13 bladder stromal cells are verified by RT-PCR. Arrowed is PENK. Top right: transcriptome dataset query shows PENK expression specific to prostate stromal cells, which was confirmed by immunostaining shown below. Bottom: RT-PCR results of tissue specimens show the absence of PENK in prostate cancer-associated stroma (CP1–CP3) compared to the normal counterpart (NP1–NP3). G6, G7, and G9 are Gleason sums. The lower amount in G6 could be due to residual NP tissue in the tumor specimen. PENK is absent in bone and liver metastases, PC3, C4-2 cancer cells, placenta, and kidney. (D) Schematic of the RECK pathway in stromal–epithelial interaction in prostate cancer. Decreased RECK expression leads to activation of MMPs and degradation of ECM proteins, allowing the release of tumor cells. Virtual Northern blot format shows array signals for MMP9, HRAS, and RECK in NP stromal vs. CP stromal (1 and 2 from two specimens), and for TIMPs in NP epithelial vs. CP epithelial.
Figure 6
Figure 6
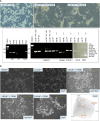
(A) Effect of PENK on LuCaP 145.1. The photomicrographs show LuCaP 145.1 cells with MEF and after transfection by PENK-neo or α-scTF-bsr-neo under appropriate drug selection. α-scTF vectors contained full-length antisense scTF genes, which showed no effect, and served as negative control. Drug-resistant cells proliferated for 3 d (with lysed MEF in the background) before harvest. The electropherogram confirms that PENK+ cells (LuCaP 145.1/PENK) were neo+bsrPENK+ while PENK− cells (LuCaP 145.1/α-scTF) were neo+bsr+PENK. The neo signal provides control for sample loading since it was expressed by both PENK+ and PENK− cells. B2M is typically used to serve as a house-keeping gene control, but in this case, it was differentially expressed between PENK+ and PENK− cells. PENK-transfected LuCaP 145.1 cells show downregulation of scTF and upregulation of B2M as gauged from the intensities of the reaction products in comparison to the corresponding ones seen in α-scTF-transfected LuCaP 145.1 (PENK−). The intensity difference for POU5F1 was not as large as this scTF is also expressed by non-stem-like LuCaP lines. The gel picture is a composite of two halves of a single run (bottom and top rows of gel loading wells with different background ethidium bromide staining). (B) Dedifferentiation and differentiation of cancer cells. The top photomicrographs show cultures of LNCaP, LNCaP*, and LNCaP*/PENK; the bottom photomicrographs show cultures of LNCaP*/PENK and LNCaP/PENK under a higher magnification (yellow bars). The diagram labeled PLIER shows relationships among the LNCaP, LNCaP/scTF = LNCaP*, and LNCaP/PENK data points. LNCaP/AGR2 shows the alteration in LNCaP transcriptome by AGR2 (Ref. 39).
Figure 7
Figure 7
Effect of PENK on LuCaP 70CR. The photomicrographs show LuCaP 70CR before and after PENK transfection. The electropherogram shows an increase in the expression of AGR2 mRNA (arrow). Increased AGR2 expression was validated by measurement of secreted AGR2 in the culture media. The histogram is a representation of the optical density values (y-axis) from ELISA measurement. PENK d6 #2, 3, and 6 are three selected LuCaP 70CR/PENK cell clones analyzed from 1 to 6 d in culture.
Figure 8
Figure 8
Lineage of prostate cancer cells. In this schematic, the different prostate cancer cell types are identified by AR and NE expression. The progression from AR+NE luminal-like to ARNE+ stem-like is through the sequential activation of scTF, which is equivalent to reprogramming. Stem-like cancer cells respond to stromal factors such as PENK by undergoing differentiation changing from scTF+B2Mlo to scTFB2Mhi. The cell types are represented by different LuCaP lines. The AR+NE+ and ARNE types represent intermediates that can become ARNE+ from losing the AR program and gaining the NE program by the former, and gaining the NE program by the latter. The adenocarcinoma antigen AGR2 is associated with differentiation, from AGR2hi/lo to AGR2.
Figure 9
Figure 9
Specific tumor targeting. Top: mice were implanted with Agr2-positive DT6606 mouse pancreatic cancer cells. At post-injection of radiolabeled 111In-anti-AGR2, the tumors were strongly labeled (marked by *). No significant labeling could be detected in iAgr2-positive normal tissues. Bottom: shown are implanted pancreatic cancer PDX sizes in response to treatment with anti-AGR2 P1 (P1G4), P3 (P3A5), alone or in combination with Gemcitabine (Gem). The antibodies alone produced no effect; the best tumor growth suppression was achieved in the P1 + Gem group.
Figure 10
Figure 10
Stanniocalcin 1. Left: array signal intensity values were retrieved from transcriptome datasets (top) in UESC and displayed in histogram format (bottom). The red line shows low expression of STC1 in the cancer cell lines and xenografts listed, as well as NCCIT. Right: downregulation of scTF and upregulation of B2M were seen with induction by CPstrom at d5. Unlike NP stromal cells, CP stromal cells lack expression of PENK but not STC1 (histogram entry #4).
Figure 11
Figure 11
Luminal cells in vitro. The plot shows PSA synthesis by CD57 luminal cells in culture with CD49a stromal cells. Samples of the culture media were assayed by PSA ELISA. The PSA level increased over a span of 6 d. The media was changed, and the PSA level again rose afterwards when measured from d10 to d13. For comparison, a co-culture of CD44 basal cells and CD49a showed minimal level of PSA. PSA levels in ng/mL are indicated on the y-axis.

Similar articles

Cited by

References

    1. Gleason DF, Mellinger GT. Prediction of prognosis for prostatic adenocarcinoma by combined histological grading and clinical staging. J Urol. (1974) 111:58–64. doi: 10.1016/S0022-5347(17)59889-4 - DOI - PubMed
    1. Minner S, Enodien M, Sirma H, Lübke AM, Krohn A, Mayer PS, et al. . ERG status is unrelated to PSA recurrence in radically operated prostate cancer in the absence of anti-hormonal therapy. Clin Cancer Res. (2011) 17:5878–88. doi: 10.1158/1078-0432.CCR-11-1251 - DOI - PubMed
    1. Shill DK, Roobol M, Ehdaie B, Vickers AJ, Carlsson SV. Active surveillance for prosate cancer. Transl Androl Urol. (2021) 10:2809–19. doi: 10.21037/tau - DOI - PMC - PubMed
    1. Egevad L, Granfors T, Karlberg L, Bergh A, Stattin P. Prognostic value of the Gleason score in prostate cancer. BJU Int. (2002) 89:538–42. doi: 10.1046/j.1464-410X.2002.02669.x - DOI - PubMed
    1. Armingol E, Officer A, Harismendy O, Lewis NE. Deciphering cell-cell interactions and communication from gene expression. Nat Rev Genet. (2021) 22:71–88. doi: 10.1038/s41576-020-00292-x - DOI - PMC - PubMed