

Assessment of fetal corpus callosum biometry by 3D super-resolution reconstructed T2-weighted magnetic resonance imaging
- PMID: 38595845
- PMCID: PMC11002102
- DOI: 10.3389/fneur.2024.1358741
Assessment of fetal corpus callosum biometry by 3D super-resolution reconstructed T2-weighted magnetic resonance imaging
Abstract
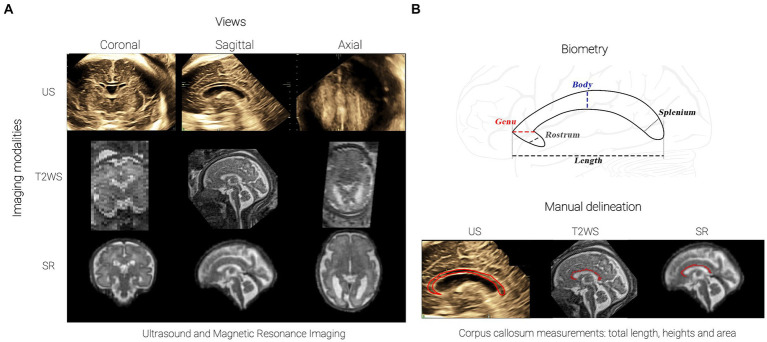
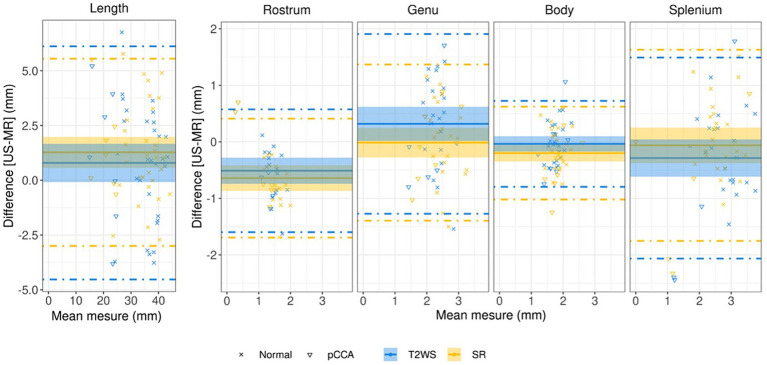
Objective: To assess the accuracy of corpus callosum (CC) biometry, including sub-segments, using 3D super-resolution fetal brain MRI (SR) compared to 2D or 3D ultrasound (US) and clinical low-resolution T2-weighted MRI (T2WS).
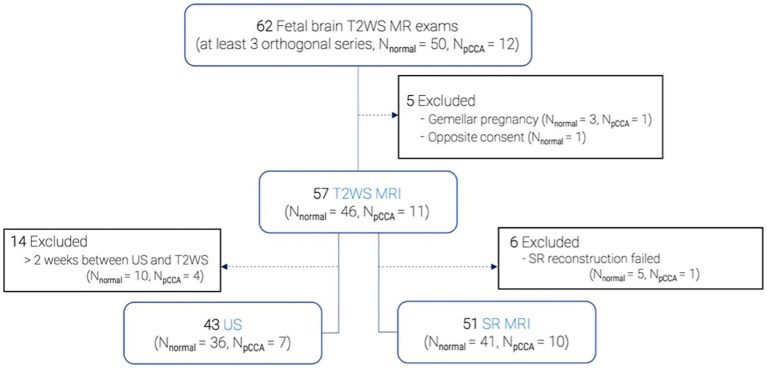
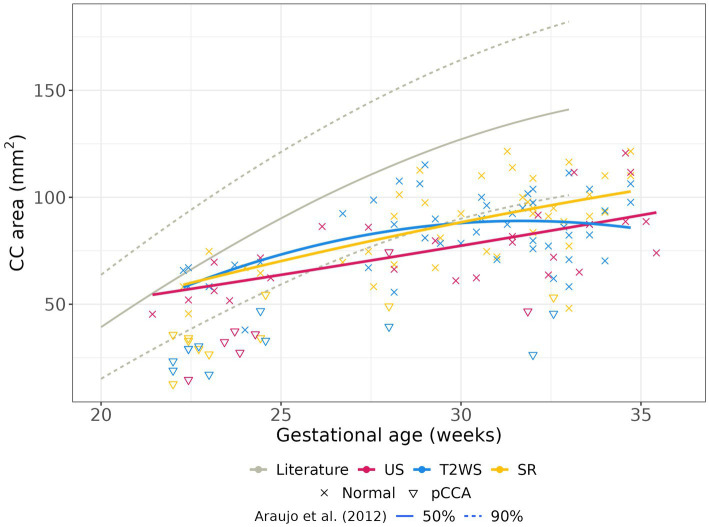
Method: Fetal brain biometry was conducted by two observers on 57 subjects [21-35 weeks of gestational age (GA)], including 11 cases of partial CC agenesis. Measures were performed by a junior observer (obs1) on US, T2WS and SR and by a senior neuroradiologist (obs2) on T2WS and SR. CC biometric regression with GA was established. Statistical analysis assessed agreement within and between modalities and observers.
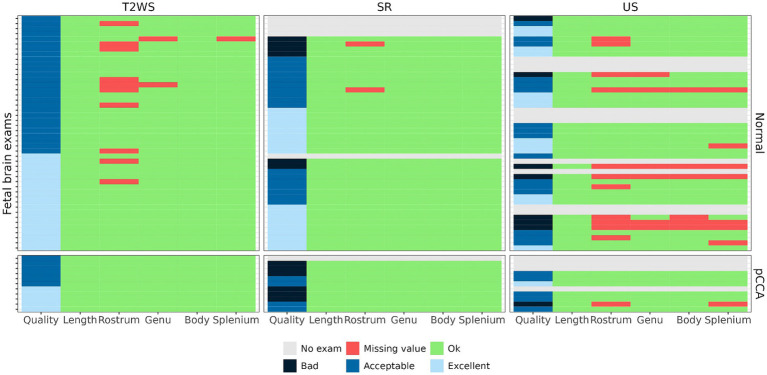
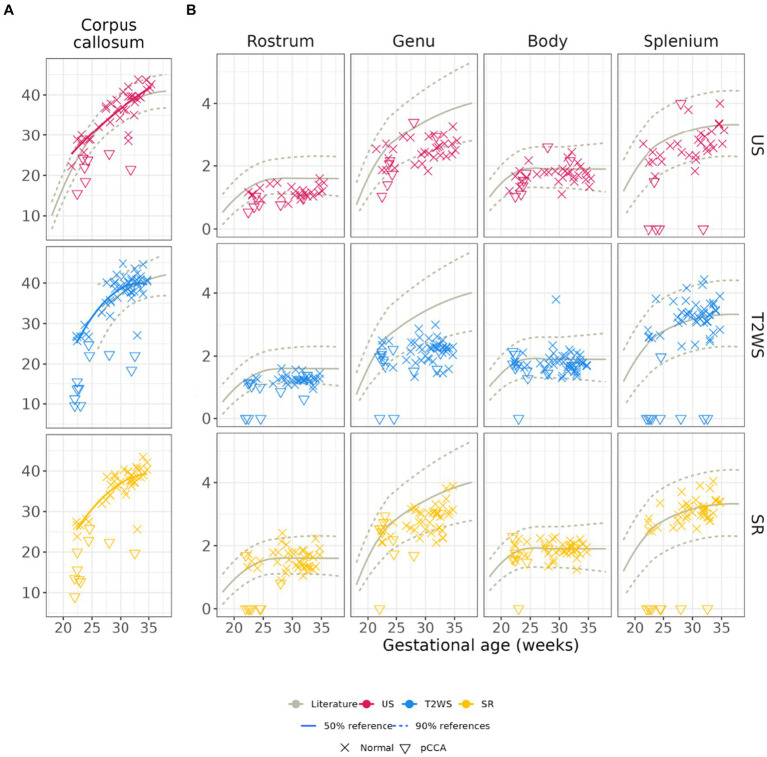
Results: This study shows robust SR to US concordance across gestation, surpassing T2WS. In obs1, SR aligns with US, except for genu and CC length (CCL), enhancing splenium visibility. In obs2, SR closely corresponds to US, differing in rostrum and CCL. The anterior CC (rostrum and genu) exhibits higher variability. SR's regression aligns better with literature (US) for CCL, splenium and body than T2WS. SR is the method with the least missing values.
Conclusion: SR yields CC biometry akin to US (excluding anterior CC). Thanks to superior 3D visualization and better through plane spatial resolution, SR allows to perform CC biometry more frequently than T2WS.
Keywords: agenesis of the corpus callosum; biometry; corpus callosum; corpus callosum segments; fetal brain; magnetic resonance imaging; super-resolution reconstruction; ultrasound.
Copyright © 2024 Lamon, de Dumast, Sanchez, Dunet, Pomar, Vial, Koob and Bach Cuadra.
Conflict of interest statement
The authors declare that the research was conducted in the absence of any commercial or financial relationships that could be construed as a potential conflict of interest.
Figures
Similar articles
-
Assessing the Agreement Between Diffusion Tension Imaging (DTI) and T2-Weighted MRI Sequence for Biometry of the Fetal Corpus Callosum.Diagnostics (Basel). 2024 Nov 29;14(23):2700. doi: 10.3390/diagnostics14232700. Diagnostics (Basel). 2024. PMID: 39682608 Free PMC article.
-
Fetal Brain Biometric Measurements on 3D Super-Resolution Reconstructed T2-Weighted MRI: An Intra- and Inter-observer Agreement Study.Front Pediatr. 2021 Aug 10;9:639746. doi: 10.3389/fped.2021.639746. eCollection 2021. Front Pediatr. 2021. PMID: 34447726 Free PMC article.
-
Biometry of the fetal corpus callosum by three-dimensional ultrasound.Ultrasound Obstet Gynecol. 2013 Dec;42(6):691-8. doi: 10.1002/uog.12501. Ultrasound Obstet Gynecol. 2013. PMID: 23649512
-
Fetal thick corpus callosum: new insights from neuroimaging and neuropathology in two cases and literature review.Neuroradiology. 2021 Dec;63(12):2139-2148. doi: 10.1007/s00234-021-02699-7. Epub 2021 May 21. Neuroradiology. 2021. PMID: 34021362 Review.
-
Role of prenatal magnetic resonance imaging in fetuses with isolated agenesis of corpus callosum in the era of fetal neurosonography: A systematic review and meta-analysis.Acta Obstet Gynecol Scand. 2021 Jan;100(1):7-16. doi: 10.1111/aogs.13958. Epub 2020 Aug 24. Acta Obstet Gynecol Scand. 2021. PMID: 32652537
Cited by
-
Assessing the Agreement Between Diffusion Tension Imaging (DTI) and T2-Weighted MRI Sequence for Biometry of the Fetal Corpus Callosum.Diagnostics (Basel). 2024 Nov 29;14(23):2700. doi: 10.3390/diagnostics14232700. Diagnostics (Basel). 2024. PMID: 39682608 Free PMC article.
References
-
- Timor-Tritsch IE, Monteagudo A, Pilu G. Ultrasonography of the prenatal brain. 3rd ed. New York: McGraw-Hill Professional; (2012). 490 p.
LinkOut - more resources
Full Text Sources
Research Materials