. 2024 Mar 25:15:1364658.
doi: 10.3389/fneur.2024.1364658. eCollection 2024.

Clinical utility of plasma Aβ42/40 ratio by LC-MS/MS in Alzheimer's disease assessment

Affiliations

Clinical utility of plasma Aβ42/40 ratio by LC-MS/MS in Alzheimer's disease assessment

Darren M Weber et al. Front Neurol. .

Abstract

Introduction: Plasma Aβ42/40 ratio can help predict amyloid PET status, but its clinical utility in Alzheimer's disease (AD) assessment is unclear.

Methods: Aβ42/40 ratio was measured by LC-MS/MS for 250 specimens with associated amyloid PET imaging, diagnosis, and demographic data, and for 6,192 consecutive clinical specimens submitted for Aβ42/40 testing.

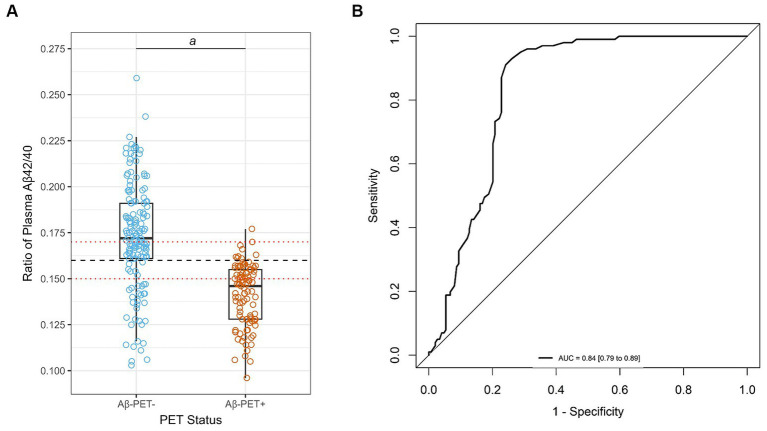
Results: High diagnostic sensitivity and negative predictive value (NPV) for Aβ-PET positivity were observed, consistent with the clinical performance of other plasma LC-MS/MS assays, but with greater separation between Aβ42/40 values for individuals with positive vs. negative Aβ-PET results. Assuming a moderate prevalence of Aβ-PET positivity, a cutpoint was identified with 99% NPV, which could help predict that AD is likely not the cause of patients' cognitive impairment and help reduce PET evaluation by about 40%.

Conclusion: High-throughput plasma Aβ42/40 LC-MS/MS assays can help identify patients with low likelihood of AD pathology, which can reduce PET evaluations, allowing for cost savings.

Keywords: Alzheimer’s disease; LC-MS/MS; PET; beta-amyloid; blood biomarkers; prescreening.


Conflict of interest statement

DW, ST, RL, JK, SG, NC, and MR were employees of Quest Diagnostics. DW and NC hold patents for the detection of beta-amyloid by mass spectrometry as well as for the detection of apolipoprotein E proteoforms by mass spectrometry. The remaining authors declare that the research was conducted in the absence of any commercial or financial relationships that could be construed as a potential conflict of interest. The author(s) declared that they were an editorial board member of Frontiers, at the time of submission. This had no impact on the peer review process and the final decision.

Figures

Figure 1
Figure 1
Correlation and diagnostic performance of the Aβ42/40 ratio and amyloid PET imaging. (A) Plasma Aβ42/40 ratio compared with amyloid PET status (Aβ-PET− and Aβ-PET+). Black dashed line denotes optimal Aβ42/40 ratio cutoff of 0.160. Red dotted lines denote Aβ42/40 ratio indeterminant risk cutoffs (0.150 and 0.170); a = significant at p < 0.001; (B) ROC-AUC of the plasma Aβ42/40 ratio for prediction of amyloid PET positivity. AUC, area under the curve; PET, positron emission tomography; ROC, receiver operating characteristic.
Figure 2
Figure 2
Robustness assessment of Aβ42/40 ratio for predicting amyloid PET imaging results. (A) Densities of plasma Aβ42/40 ratio by LC-MS/MS in ADRC cohort with and without 10% bias (22% total, upper plot) and 2% measured bias (lower plot) added. (B) Scatterplots of Aβ42 and Aβ40 to illustrate proximity to cutoffs defining indeterminate risk and scatterplots of Aβ42/40 ratio with and without 10% CV added noise (upper plot) and 6% added CV (measured) noise (lower plot). Aβ, beta-amyloid; ADRC, Alzheimer’s Disease Research Center; CI, confidence interval; PET, positron emission tomography.
Figure 3
Figure 3
Four-quadrant plot illustrating the relationship between the plasma Aβ42/40 ratio and (A) [18F]-florbetaben SUVR values and (B) [18F]-florbetapir SUVR values in the ADRC cohort. Horizontal dashed line = optimal plasma Aβ42/40 ratio cutoff (0.160). Vertical dashed lines = optimized SUVR cutoff values for each tracer. Color coding for amyloid positivity and negativity is based SUVR cutoffs or gold-standard visuals reads. Aβ, beta-amyloid; ADRC, Alzheimer’s Disease Research Center; PET, positron emission tomography; SUVR, standardized uptake value ratio.
Figure 4
Figure 4
Distribution (upper) and scatterplots by age for the 6,192 clinical specimens submitted for Aβ42/40 testing. (A) Aβ42/40 ratio, Spearman’s rho = −0.25, 95%CI, −0.27 to −0.22. (B) Aβ42 concentrations, Spearman’s rho = 0.22, 95%CI 0.20 to 0.25; and (C) Aβ40 concentrations, Spearman’s rho = 0.41, 95%CI 0.39 to 0.43. Black dashed line denotes Aβ42/40 ratio cutoff of 0.160. Red dotted lines denote Aβ42/40 ratio indeterminant risk cutoffs (0.150 and 0.170). Aβ, beta-amyloid.

Update of

References

    1. Lane CA, Hardy J, Schott JM. Alzheimer's disease. Eur J Neurol. (2018) 25:59–70. doi: 10.1111/ene.13439 - DOI - PubMed
    1. Murphy MP, LeVine H., 3rd. Alzheimer's disease and the amyloid-beta peptide. J Alzheimers Dis. (2010) 19:311–23. doi: 10.3233/JAD-2010-1221, PMID: - DOI - PMC - PubMed
    1. Iqbal K, Liu F, Gong CX, Grundke-Iqbal I. Tau in Alzheimer disease and related tauopathies. Curr Alzheimer Res. (2010) 7:656–64. doi: 10.2174/156720510793611592, PMID: - DOI - PMC - PubMed
    1. Caroli A, Frisoni GB. Alzheimer's disease neuroimaging I. The dynamics of Alzheimer's disease biomarkers in the Alzheimer's disease neuroimaging initiative cohort. Neurobiol Aging. (2010) 31:1263–74. doi: 10.1016/j.neurobiolaging.2010.04.024, PMID: - DOI - PMC - PubMed
    1. Jack CR, Jr, Knopman DS, Jagust WJ, Petersen RC, Weiner MW, Aisen PS, et al. . Tracking pathophysiological processes in Alzheimer's disease: an updated hypothetical model of dynamic biomarkers. Lancet Neurol. (2013) 12:207–16. doi: 10.1016/S1474-4422(12)70291-0, PMID: - DOI - PMC - PubMed

LinkOut - more resources