

Application of early warning signs to physiological contexts: a comparison of multivariate indices in patients on long-term hemodialysis
- PMID: 38595863
- PMCID: PMC11002238
- DOI: 10.3389/fnetp.2024.1299162
Application of early warning signs to physiological contexts: a comparison of multivariate indices in patients on long-term hemodialysis
Abstract
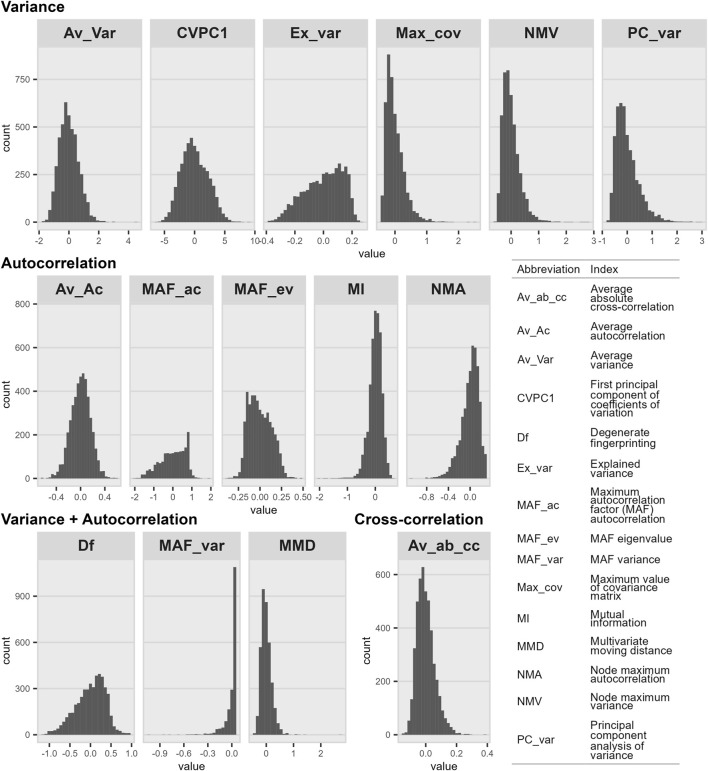
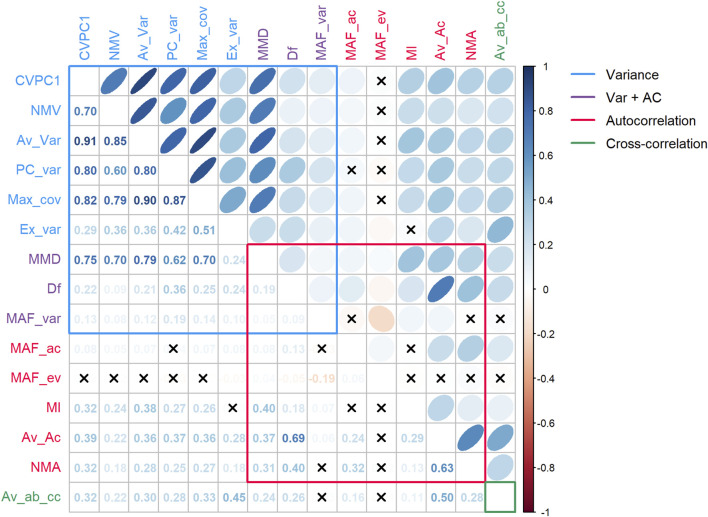
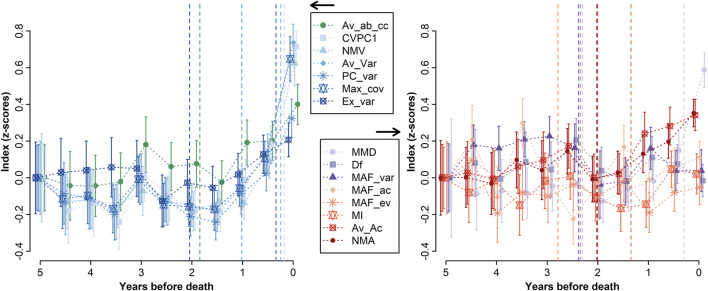
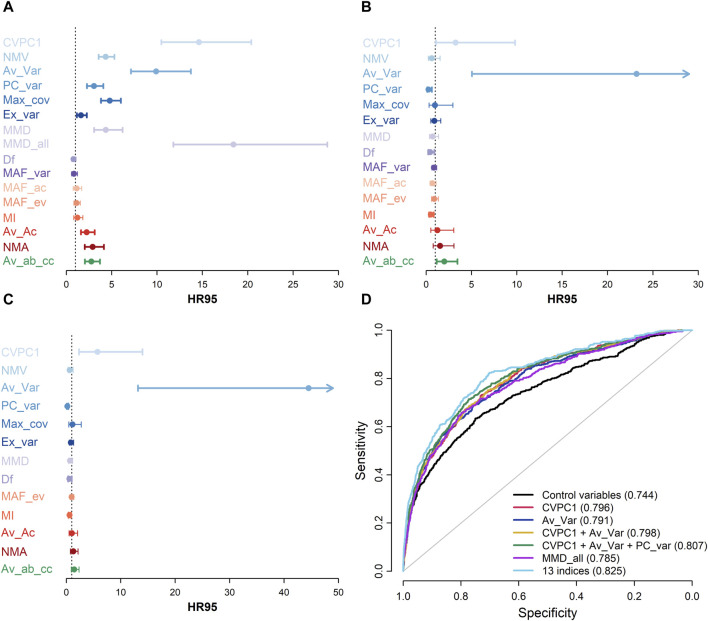
Early warnings signs (EWSs) can anticipate abrupt changes in system state, known as "critical transitions," by detecting dynamic variations, including increases in variance, autocorrelation (AC), and cross-correlation. Numerous EWSs have been proposed; yet no consensus on which perform best exists. Here, we compared 15 multivariate EWSs in time series of 763 hemodialyzed patients, previously shown to present relevant critical transition dynamics. We calculated five EWSs based on AC, six on variance, one on cross-correlation, and three on AC and variance. We assessed their pairwise correlations, trends before death, and mortality predictive power, alone and in combination. Variance-based EWSs showed stronger correlations (r = 0.663 ± 0.222 vs. 0.170 ± 0.205 for AC-based indices) and a steeper increase before death. Two variance-based EWSs yielded HR95 > 9 (HR95 standing for a scale-invariant metric of hazard ratio), but combining them did not improve the area under the receiver-operating curve (AUC) much compared to using them alone (AUC = 0.798 vs. 0.796 and 0.791). Nevertheless, the AUC reached 0.825 when combining 13 indices. While some indicators did not perform overly well alone, their addition to the best performing EWSs increased the predictive power, suggesting that indices combination captures a broader range of dynamic changes occurring within the system. It is unclear whether this added benefit reflects measurement error of a unified phenomenon or heterogeneity in the nature of signals preceding critical transitions. Finally, the modest predictive performance and weak correlations among some indices call into question their validity, at least in this context.
Keywords: autocorrelation; biomarkers; critical transition; cross-correlation; mortality; network physiology; variance.
Copyright © 2024 Legault, Pu, Weinans and Cohen.
Conflict of interest statement
AC is Founder and CEO at Oken Health. The remaining authors declare that the research was conducted in the absence of any commercial or financial relationships that could be construed as a potential conflict of interest.
Figures
Similar articles
-
Synchrony of biomarker variability indicates a critical transition: Application to mortality prediction in hemodialysis.iScience. 2022 May 10;25(6):104385. doi: 10.1016/j.isci.2022.104385. eCollection 2022 Jun 17. iScience. 2022. PMID: 35620427 Free PMC article.
-
Prehospital Early Warning Scores to Predict Mortality in Patients Using Ambulances.JAMA Netw Open. 2023 Aug 1;6(8):e2328128. doi: 10.1001/jamanetworkopen.2023.28128. JAMA Netw Open. 2023. PMID: 37556138 Free PMC article.
-
Early warning signals of infectious disease transitions: a review.J R Soc Interface. 2021 Sep;18(182):20210555. doi: 10.1098/rsif.2021.0555. Epub 2021 Sep 29. J R Soc Interface. 2021. PMID: 34583561 Free PMC article. Review.
-
Applicability of spatial early warning signals to complex network dynamics.J R Soc Interface. 2025 May;22(226):20240696. doi: 10.1098/rsif.2024.0696. Epub 2025 May 7. J R Soc Interface. 2025. PMID: 40328300 Free PMC article.
-
Indicators of transitions in biological systems.Ecol Lett. 2018 Jun;21(6):905-919. doi: 10.1111/ele.12948. Epub 2018 Mar 30. Ecol Lett. 2018. PMID: 29601665 Review.
Cited by
-
Physiological network approach to prognosis in cirrhosis: A shifting paradigm.Physiol Rep. 2024 Jul;12(13):e16133. doi: 10.14814/phy2.16133. Physiol Rep. 2024. PMID: 38961593 Free PMC article. Review.
References
-
- Ashwin P. (1999). Minimal attractors and bifurcations of random dynamical systems. Proc. R. Soc. Lond. Ser. A Math. Phys. Eng. Sci. 455, 2615–2634. 10.1098/rspa.1999.0419 - DOI
LinkOut - more resources
Full Text Sources
Miscellaneous