. 2024 Mar 26:15:1362464.
doi: 10.3389/fphar.2024.1362464. eCollection 2024.

Quercetin reshapes gut microbiota homeostasis and modulates brain metabolic profile to regulate depression-like behaviors induced by CUMS in rats

Affiliations

Quercetin reshapes gut microbiota homeostasis and modulates brain metabolic profile to regulate depression-like behaviors induced by CUMS in rats

Bozhi Li et al. Front Pharmacol. .

Abstract

Quercetin, an abundant flavonoid compound in plants, is considered a novel antidepressant; however, its mechanisms of action are poorly understood. This study aimed to investigate the therapeutic effects of quercetin on chronic unpredictable mild stress (CUMS)-induced depression-like behaviors in rats and explore the underlying mechanisms by combining untargeted metabolomics and 16S rRNA sequencing analysis of brain tissue metabolites and gut microbiota. Gut microbiota analysis revealed that at the phylum level, quercetin reduced Firmicutes and the Firmicutes/Bacteroidetes (F/B) ratio and enhanced Cyanobacteria. At the genus level, quercetin downregulated 6 and upregulated 14 bacterial species. Metabolomics analysis revealed that quercetin regulated multiple metabolic pathways, including glycolysis/gluconeogenesis, sphingolipid metabolism, the pentose phosphate pathway, and coenzyme A biosynthesis. This modulation leads to improvements in depression-like phenotypes, anxiety-like phenotypes, and cognitive function, highlighting the therapeutic potential of quercetin in treating depression.

Keywords: brain metabolomics; depression; gut microbiota; microbiota-gut-brain axis; quercetin.


Conflict of interest statement

The authors declare that the research was conducted in the absence of any commercial or financial relationships that could be construed as a potential conflict of interest.

Figures

FIGURE 1
FIGURE 1
Summary of experimental procedure and results (A) Overview of behavioral analysis, gut microbiota analysis, and brain metabolism (prefrontal cortex, hippocampus, and hypothalamus) analysis in the CON, CUMS, and QUE groups of rats. CON, Control; QUE, Quercetin; CUMS, Chronic Unpredictable Mild Stress; SPT, Sucrose Preference Test; EPMT, Elevated Plus-Maze Test; FST, Forced Swim Test; MWM, Morris WaterMaze. (B) Experimental rat modeling and behavioral test workflow.
FIGURE 2
FIGURE 2
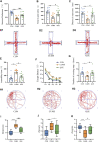
Behavioral test results in rats. (A) Sucrose preference (%) in SPT, n = 12; (B) Time spent in open arms (s) in EPMT, n = 12; (C) Distance traveled in open arms (mm) in EPMT, n = 12; (D) Trajectory plot in EPMT; (E) Immobility time (s) in FST, n = 12; (F) Escape latency (s) in MWM, n = 12; (G) Number of platform crossings in MWM; (H) Trajectory plot on the sixth day in MWM; (I) Zdepression, n = 12; (J) Zanxiety, n = 12; (K) Zcognize, n = 12. Data are presented as mean ± SEM. *p < 0.05, **p < 0.01, ***p < 0.001 compared to CON group; #p < 0.05, ##p < 0.01, ###p < 0.001 compared to CUMS group.
FIGURE 3
FIGURE 3
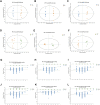
Effects of QUE on the metabolic profile of the brain in CUMS rats. (A–F) OPLS-DA Score Plots for CON vs. CUMS and CUMS vs. QUE in the PFC, HIP and HYP. (G–L) OPLS-DA replacement test (200 times) for CON vs. CUMS and CUMS vs. QUE in the PFC, HIP and HYP.
FIGURE 4
FIGURE 4
Key differential metabolites and metabolic pathways. (A–F) Volcano plots of differential metabolites comparing CON vs. CUMS and CUMS vs. QUE in the PFC, HIP, and HYP. (G–I) Venn diagrams of differential metabolites, heatmap of common differential metabolites, and KEGG topological analysis in the PFC comparing CON vs. CUMS and CUMS vs. QUE. (K–M) Venn diagrams of differential metabolites, heatmap of common differential metabolites, and KEGG topological analysis in the HIP comparing CON vs. CUMS and CUMS vs. QUE. (N–P) Venn diagrams of differential metabolites, heatmap of common differential metabolites, and KEGG topological analysis in the HYP comparing CON vs. CUMS and CUMS vs. QUE.
FIGURE 5
FIGURE 5
Effects of Quercetin on the Gut Microbiota of CUMS Rats. (A) ACE index. (B) Chao1 index. (C) Sobs index. (D) PCoA analysis. (E) In the anosim similarity analysis, R > 0 indicates larger inter-group differences than intra-group differences. (F) Barplot of gut microbiota abundance at the phylum level. (G) Barplot of gut microbiota abundance at the genus level.
FIGURE 6
FIGURE 6
Analysis of differentially abundant bacteria in the gut microbiota of CUMS rats regulated by quercetin intervention. (A) Enriched microbial taxa dendrogram generated from LEfSe analysis. (B) Histogram depicting the distribution of differentially abundant bacteria based on LDA scores. (C) Significantly differentially abundant phyla with reversed abundances by quercetin intervention at the phylum level (Kruskal–Wallis H test). (D) Top 10 genera with reversed abundances by quercetin intervention at the genus level (Kruskal–Wallis H test). (E) Sankey diagram illustrating the significantly differentially abundant genera with reversed abundances by quercetin intervention at the genus level.
FIGURE 7
FIGURE 7
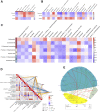
Correlation between behavioral metrics, differential metabolites, and gut differential microbiota. (A) Spearman’s correlation analyses between the behavioral Z scores of rats and key differential metabolites in the PFC, HIP, and HYP. (B) Spearman’s correlation analyses between the behavioral Z scores of rats and differential bacteria at the genus levels. (C) Spearman’s correlation analyses between differential bacteria at the genus level and key differential metabolites in the PFC, HIP, and HYP. (D) Mantel test of the correlation between differential bacteria at the genus level and key differential metabolites in the PFC, HIP, and HYP. (E) Network circle of the Spearman’s correlation between the behavioral Z scores of rats and key differential metabolites in the PFC, HIP, and HYP, along with differential bacteria at the genus level.

Similar articles

Cited by

References

    1. Abildgaard A., Elfving B., Hokland M., Lund S., Wegener G. (2017a). Probiotic treatment protects against the pro-depressant-like effect of high-fat diet in Flinders Sensitive Line rats. Brain Behav. Immun. 65, 33–42. 10.1016/j.bbi.2017.04.017 - DOI - PubMed
    1. Abildgaard A., Elfving B., Hokland M., Wegener G., Lund S. (2017b). Probiotic treatment reduces depressive-like behaviour in rats independently of diet. Psychoneuroendocrinology 79, 40–48. 10.1016/j.psyneuen.2017.02.014 - DOI - PubMed
    1. Adibhatla R. M., Hatcher J. F. (2008). Phospholipase A(2), reactive oxygen species, and lipid peroxidation in CNS pathologies. BMB Rep. 41 (8), 560–567. 10.5483/bmbrep.2008.41.8.560 - DOI - PMC - PubMed
    1. Akoglu H. (2018). User's guide to correlation coefficients. Turk J. Emerg. Med. 18 (3), 91–93. 10.1016/j.tjem.2018.08.001 - DOI - PMC - PubMed
    1. Al-Massadi O., Dieguez C., Schneeberger M., López M., Schwaninger M., Prevot V., et al. (2021). Multifaceted actions of melanin-concentrating hormone on mammalian energy homeostasis. Nat. Rev. Endocrinol. 17 (12), 745–755. 10.1038/s41574-021-00559-1 - DOI - PubMed

LinkOut - more resources