. 2024 Jan 24:3:kvae001.
doi: 10.1093/oons/kvae001. eCollection 2024.

PRDM16 co-operates with LHX2 to shape the human brain

Affiliations

PRDM16 co-operates with LHX2 to shape the human brain

Varun Suresh et al. Oxf Open Neurosci. .

Abstract

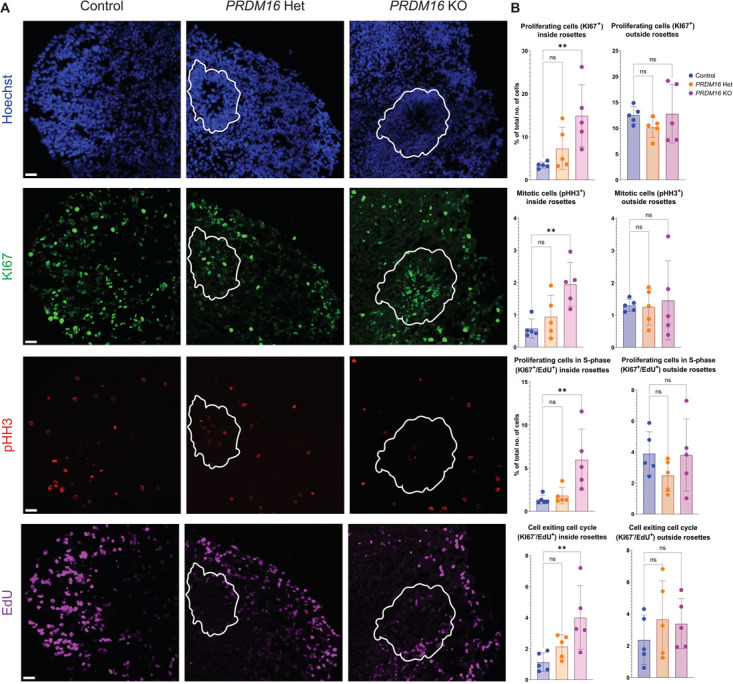
PRDM16 is a dynamic transcriptional regulator of various stem cell niches, including adipocytic, hematopoietic, cardiac progenitors, and neural stem cells. PRDM16 has been suggested to contribute to 1p36 deletion syndrome, one of the most prevalent subtelomeric microdeletion syndromes. We report a patient with a de novo nonsense mutation in the PRDM16 coding sequence, accompanied by lissencephaly and microcephaly features. Human stem cells were genetically modified to mimic this mutation, generating cortical organoids that exhibited altered cell cycle dynamics. RNA sequencing of cortical organoids at day 32 unveiled changes in cell adhesion and WNT-signaling pathways. ChIP-seq of PRDM16 identified binding sites in postmortem human fetal cortex, indicating the conservation of PRDM16 binding to developmental genes in mice and humans, potentially at enhancer sites. A shared motif between PRDM16 and LHX2 was identified and further examined through comparison with LHX2 ChIP-seq data from mice. These results suggested a collaborative partnership between PRDM16 and LHX2 in regulating a common set of genes and pathways in cortical radial glia cells, possibly via their synergistic involvement in cortical development.

Keywords: 1p36 deletion syndrome; LHX2; PRDM16; brain development; cerebral organoids; human disease model.


Figures

Figure 1
Figure 1
PRDM16 expression and patient data. A, B. Immunostaining of human embryonic brain sections of the cingulate cortex (GW20-22). Left to right in A. DAPI, PAX6, EOMES, PRDM16, and merged images of PRDM16 staining with PAX6 and EOMES. B. Zoom-in images of the double immunostainings in the ventricular zone (VZ) and the outer subventricular zone (oSVZ). The scale bars in A and B are 100 μm. C. UMAP of pallial excitatory neuron lineage at 5–14 PCW from [45] colored by selected gene expression (the color scale on the top right ranges from gray (0) to black (99 percentile). D. Box plots showing the gene expression PRDM16 (top) and AURKA (bottom) for each progenitor state in radial glia at 5–14 PCW, the Y axis indicates expression levels in UMI (EMX1+ clusters, data from [45]) (One-sided Mann-Whitney-Wilcoxon test with Bonferroni correction is used to test the significance. ns: not significant; P-value: ****≤0.0001). E. Two MRI images from the patient exhibiting bilateral frontal pachygyria and microcephaly, T2 transverse (left) and sagittal (right)
Figure 2
Figure 2
Cortical progenitors in PRDM16 mutant human brain organoids. A. Immunohistochemistry on 12 μm cryosections of day 32 control and PRDM16 mutant cortical organoids showing the cortical progenitor markers—SOX2 and PAX6 (imaged using 25X objective lens, scale bar represents 50 μm in insets). B (left). Percentage of total number of cells that are PAX6+ neuronal progenitors inside and outside the rosettes respectively, in day 32 control and PRDM16 mutant cortical organoids (Ordinary One-Way ANOVA, n = 5, α = 0.05, ns: not significant; P-values: *≤0.05; **≤0.01; ***≤0.001; ****≤0.0001, each data point on the graph represents an organoid imaged and analyzed) and B (right) the total area of proliferative germinal zones are represented as a percentage of total organoid area in control and PRDM16 mutant organoids (Ordinary One-Way ANOVA, n = 5, α = 0.05). C. Immunohistochemistry on 12 μm cryosections of day 32 control and PRDM16 mutant cortical organoids showing the basal radial glia markers—HOPX (imaged using 25X objective lens, scale bar represents 30 μm). D. Percentage of total number of cells that are HOPX+ inside and outside the rosettes respectively in day 32 control and PRDM16 mutant cortical organoids (Ordinary One-Way ANOVA, n = 5, α = 0.05)
Figure 3
Figure 3
Proliferating cells in PRDM16 mutant human brain organoids. A. Immunohistochemistry on 12 μm cryosections of day 32 control and PRDM16 mutant cortical organoids showing the proliferative markers—KI67, pHH3, and EdU (imaged using 25X objective lens, scale bar represents 30 μm, germinal rosettes are outlined in white line). B. Percentage of the total number of cells that are proliferative (KI67+), mitotically-active (pHH3+), proliferative cells undergoing S-phase (KI67+/EdU+) and cells that are exiting the cell cycle (KI67/EdU+) inside and outside the rosettes respectively, in day 32 control and PRDM16 mutant cortical organoids (Ordinary One-Way ANOVA, n = 5, α = 0.05)
Figure 4
Figure 4
Transcriptomic analysis of PRDM16 mutant organoids identifies dysregulated WNT signaling and cell adhesion. A. Volcano plot shows DEGs identified in PRDM16 mutant organoids vs control—B. Gene ontology: Biological processes and KEGG pathway analysis of DEGs identified in A, the data was plotted using the ‘Network’ plot of ShinyGO [48]. C, D. Fold changes of genes belonging to WNT signaling and cell adhesion biological processes depict multiple dysregulated genes. E. Immunohistochemistry on 12 μm cryosections of day 32 control and PRDM16 mutant cortical organoids showing two markers of WNT signaling; CTNNB1 and LEF1 (imaged using 25X objective lens, scale bar represents 20 μm) and N-cadherin cell adhesion molecule (imaged using 63X objective lens, scale bar represents 20 μm). F. Mean intensity of CTNNB1 inside the nuclei of cells in control and PRDM16 mutant cortical organoids (Nested One-Way ANOVA, n = 5, α = 0.05), percentage of total number of cells that are LEF1+, on day 32 control and PRDM16 mutant cortical organoids (Nested One-Way ANOVA, n = 5, α = 0.05), mean intensity and intensity density of N-cadherin at the boundary of the cells in control and PRDM16 mutant cortical organoids (Nested One-Way ANOVA, ncontrol = 4, nPRDM16 KO = 5, α = 0.05)
Figure 5
Figure 5
A. PRDM16 occupies and regulates multiple genes that regulate cortical neurogenesis. Heatmap and profile plots of the Human PRDM16 ChIP-seq data show PRDM16 consensus binding sites. B. Mouse PRDM16 ChIP-seq data (obtained from [41]) plotted on regions identified in A after a human-to-mouse LiftOver conversion. C. Annotations of Mouse and Human PRDM16 ChIP-seq data reveal the number of PRDM16-occupied regions in both species. D. Gene Ontology Biological Processes directly regulated by PRDM16 identified by genes occupied by PRDM16 and dysregulated in the organoid. E. Select IGV tracks of neuronal genes occupied by PRDM16 in the human fetus, namely—FEZF2 (chr3:62. 327, 944-62, 384, 680), ROBO2 (chr3:77, 228, 242-77, 341, 714), SOX5 (chr12:24, 267, 871-24, 574, 676) and RBFOX1 (chr16:7, 669, 904-7, 877, 008). F. Immunohistochemistry on 12 μm cryosections of day 32 control and PRDM16 mutant cortical organoids showing immunostainings for MAP2 and TBR1 (imaged using a 25X objective, scale bar represents 20 μm). G. Percentage of the total organoid area that has processes of MAP2+ neurons in control and PRDM16 mutant organoids (Nested One-Way ANOVA, n = 5, α = 0.05), percentage of the total number of cells that are TBR1+ neurons in day 32 control and PRDM16 mutant cortical organoids (Nested One-Way ANOVA, n = 5, α = 0.05)
Figure 6
Figure 6
A. Motif analysis of PRDM16 mouse and human ChIP-seq data reveals the LHX2 motif as the top candidate (a list of the top 10 candidates is available in Supplementary Fig. 5A-B). B. Volcano plot of RNA-seq data shows 744 genes downregulated and 852 genes upregulated upon Lhx2 loss in the E12.5 mouse. C. Gene Ontology Biological Processes of the DEGs identified in B show multiple processes related to neurogenesis affected in the Lhx2 mutant. D. Heat map depicts LHX2 occupancy at E12.5 in the mouse, LHX2 occupancy on PRDM16 peaks in the mouse, and heatmaps depict replicates of PRDM16 ChIP-seq data on LHX2 called peaks. E. UMAPs depict PRDM16 and LHX2 expression in the EMX1+ clusters of developing human brains; box plots indicate the expression quantified in G1, S, G2M, post-M, and non-cycling cells [45]. F. IGV tracks show common LHX2 and PRDM16 binding sites; the peaks are around 5 KB downstream of Fezf2 (chr14:12335752-12, 343, 752), while all other peaks are in the intronic regions of the respective genes shown namely—Wls (chr3:159, 846, 672-159, 858, 135), Rbfox1 (chr16:6, 950, 408-6, 978, 545) and Cadps2 (chr6:23, 260, 534-23, 303, 435)

Update of

References

    1. Chi J, Cohen P. The multifaceted roles of PRDM16: adipose biology and beyond. Trends Endocrinol Metab 2016;27:11–23 - PubMed
    1. Pinheiro I, Margueron R, Shukeir N et al. Prdm3 and Prdm16 are H3K9me1 methyltransferases required for mammalian heterochromatin integrity. Cell 2012;150:948–60 - PubMed
    1. Zhou B, Wang J, Lee SY et al. PRDM16 suppresses mll1r leukemia via intrinsic histone methyltransferase activity. Mol Cell 2016;62:222–36 - PMC - PubMed
    1. Warner DR, Horn KH, Mudd L et al. PRDM16/MEL1: a novel Smad binding protein expressed in murine embryonic orofacial tissue. Biochim Biophys Acta 2007;1773:814–20 - PubMed
    1. Takahata M, Inoue Y, Tsuda H et al. SKI and MEL1 cooperate to inhibit transforming growth factor-beta signal in gastric cancer cells. J Biol Chem 2009;284:3334–44 - PubMed