Review
. 2024 Apr 8;11(2):021303.
doi: 10.1063/4.0000241. eCollection 2024 Mar.

Watching a signaling protein function: What has been learned over four decades of time-resolved studies of photoactive yellow protein

Affiliations
Review

Watching a signaling protein function: What has been learned over four decades of time-resolved studies of photoactive yellow protein

Friedrich Schotte et al. Struct Dyn. .

Abstract

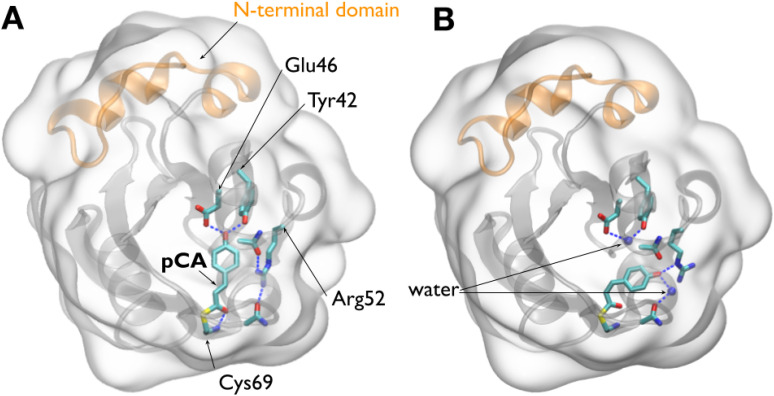
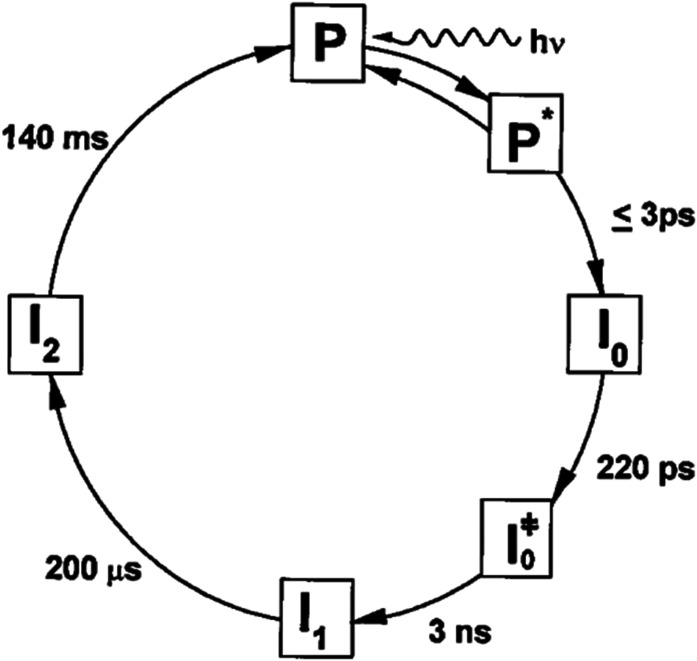
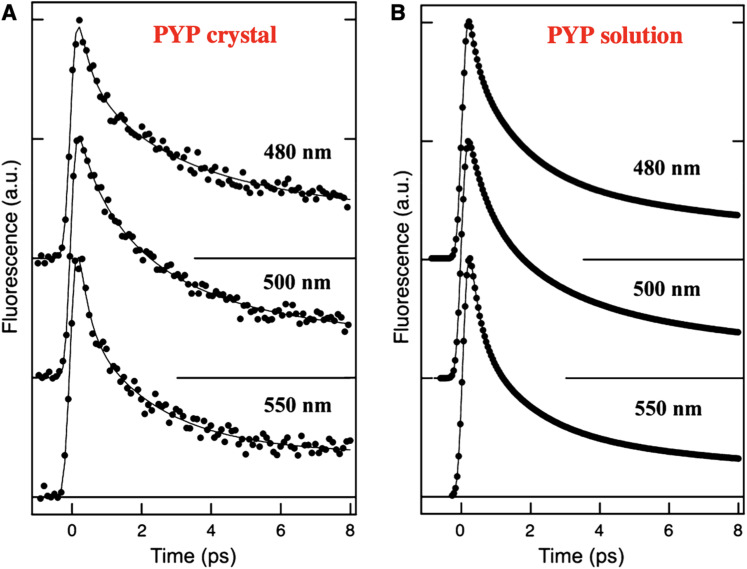
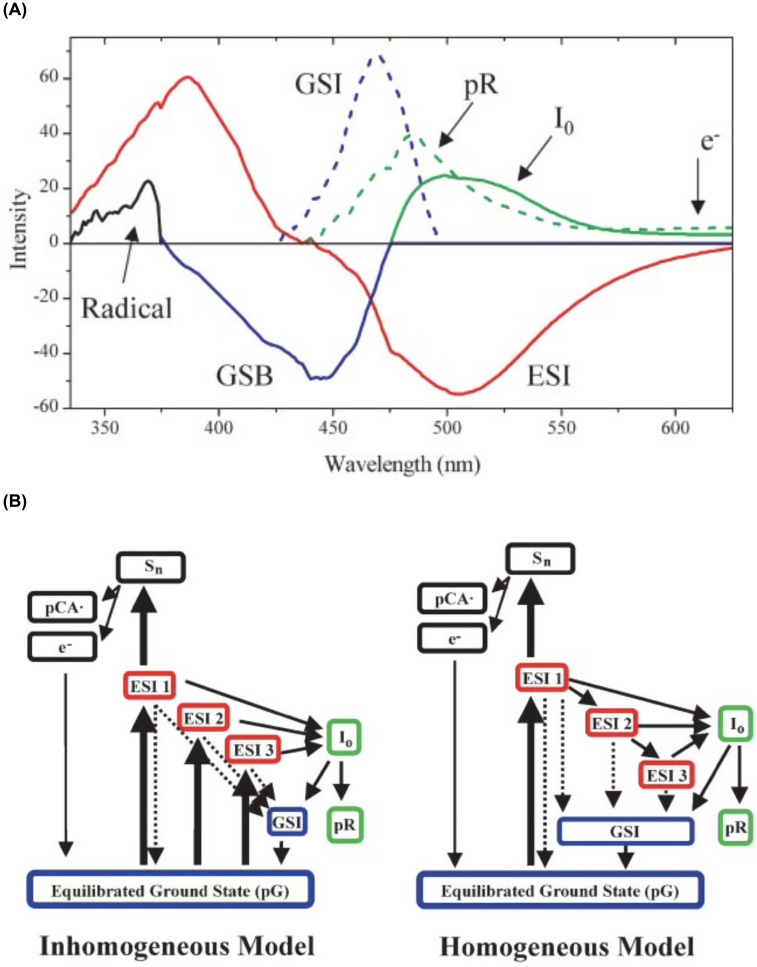
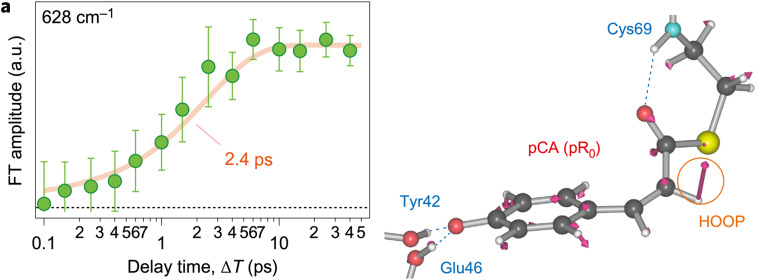
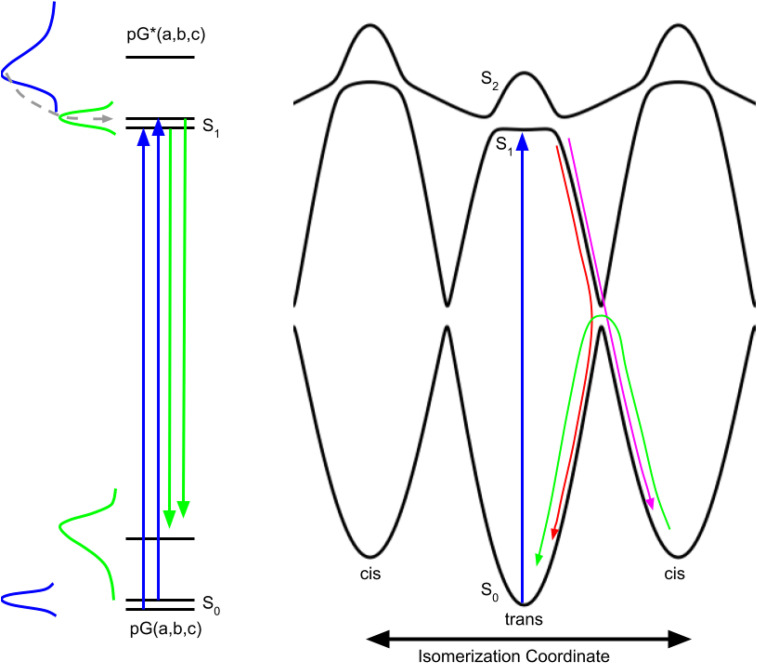
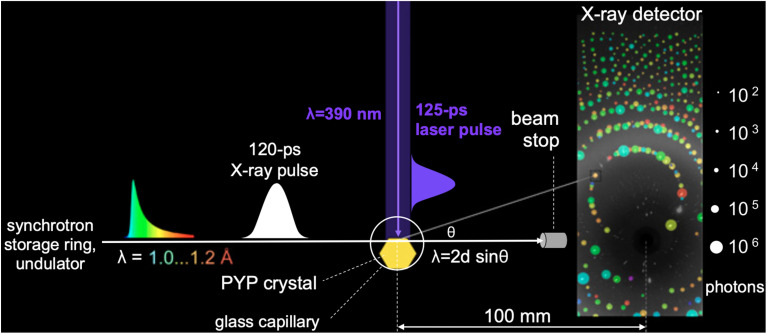
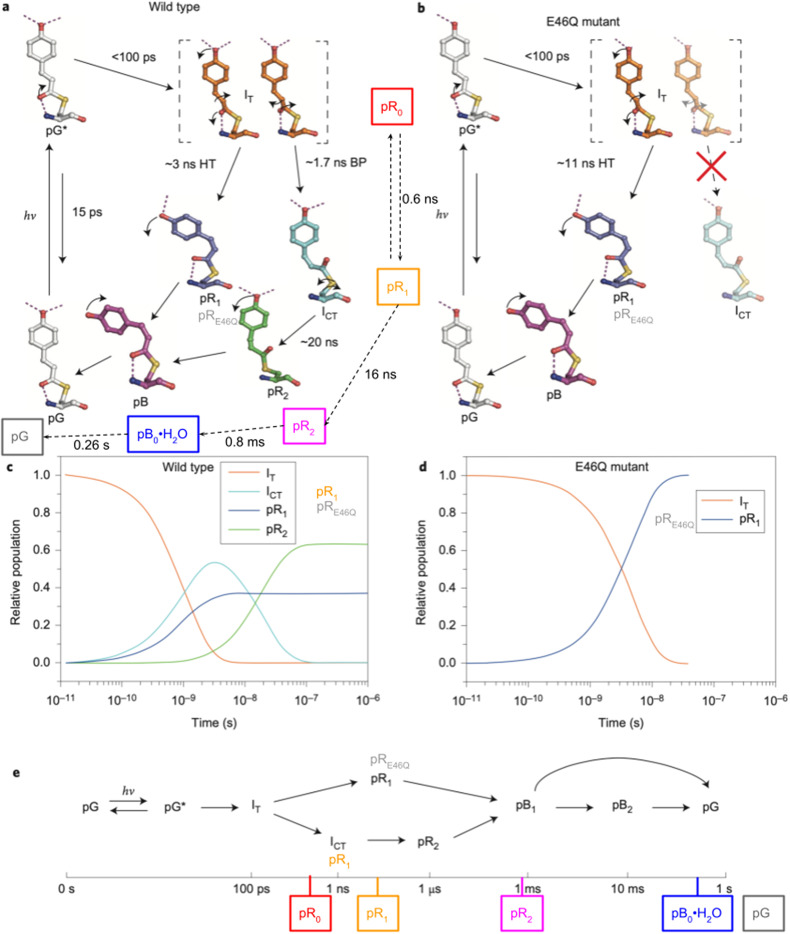
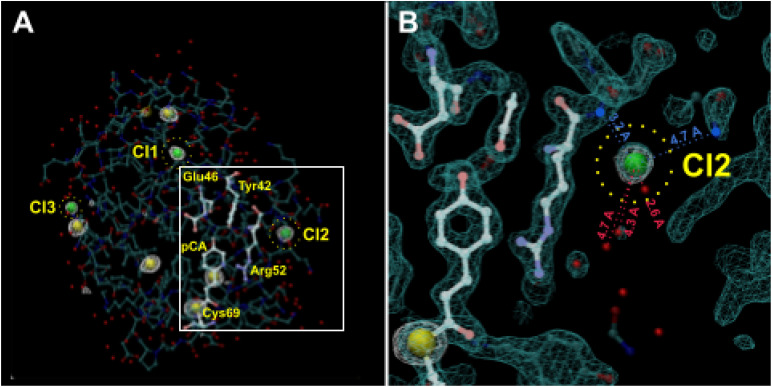
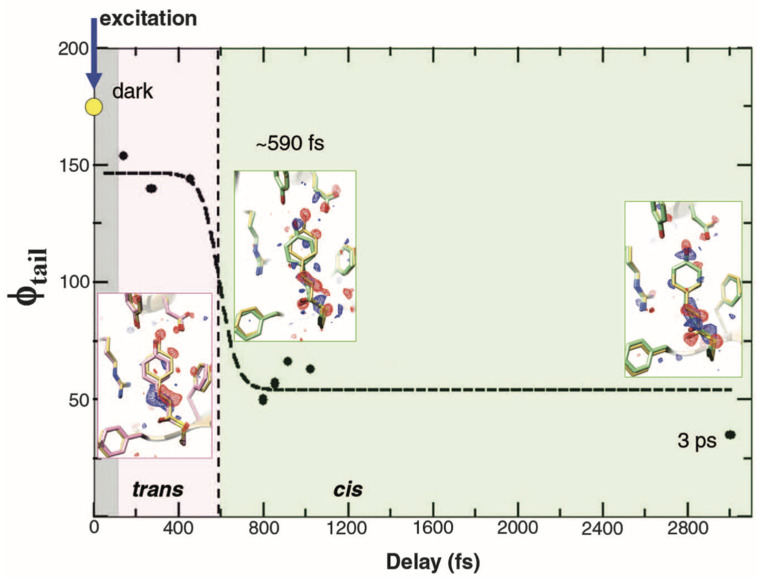
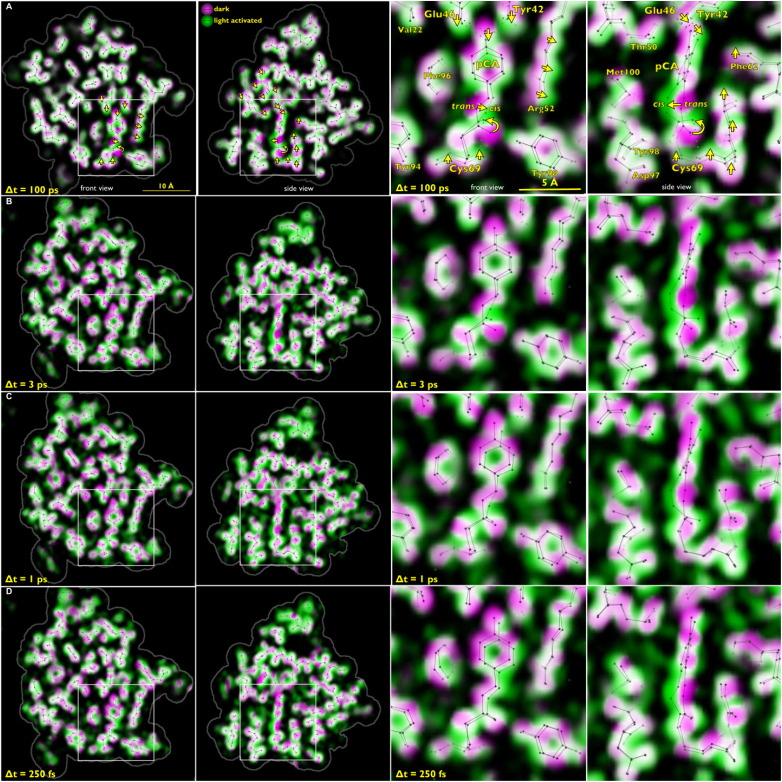
Photoactive yellow protein (PYP) is a signaling protein whose internal p-coumaric acid chromophore undergoes reversible, light-induced trans-to-cis isomerization, which triggers a sequence of structural changes that ultimately lead to a signaling state. Since its discovery nearly 40 years ago, PYP has attracted much interest and has become one of the most extensively studied proteins found in nature. The method of time-resolved crystallography, pioneered by Keith Moffat, has successfully characterized intermediates in the PYP photocycle at near atomic resolution over 12 decades of time down to the sub-picosecond time scale, allowing one to stitch together a movie and literally watch a protein as it functions. But how close to reality is this movie? To address this question, results from numerous complementary time-resolved techniques including x-ray crystallography, x-ray scattering, and spectroscopy are discussed. Emerging from spectroscopic studies is a general consensus that three time constants are required to model the excited state relaxation, with a highly strained ground-state cis intermediate formed in less than 2.4 ps. Persistent strain drives the sequence of structural transitions that ultimately produce the signaling state. Crystal packing forces produce a restoring force that slows somewhat the rates of interconversion between the intermediates. Moreover, the solvent composition surrounding PYP can influence the number and structures of intermediates as well as the rates at which they interconvert. When chloride is present, the PYP photocycle in a crystal closely tracks that in solution, which suggests the epic movie of the PYP photocycle is indeed based in reality.


Conflict of interest statement

The authors have no conflicts to disclose.

Figures

FIG. 1.
FIG. 1.
Crystal structures of PYP. (a) Structure of PYP in its pG ground state (PDB ID: 2ZOH). (b) Structure of PYP in its pB0 state (PDB ID: 4BBV), as determined by time-resolved Laue crystallography (Schotte et al., 2012). In this state, a water molecule penetrates into the interior of the protein and hydrogen bonds to Glu46 and Tyr42. A second water molecule hydrogen bonds to the pCA phenolate oxygen, which is protonated in this state. The surfaces of both figures are rendered as glass and the backbone as ribbon. The pCA chromophore and Arg52, along with their hydrogen-bonding partners, are rendered as licorice. Dashed blue lines depict hydrogen bonds. The 25-residue N-terminal domain, colored orange, caps the β-scaffold of this sensory protein (Cho et al., 2016).
FIG. 2.
FIG. 2.
Revised photocycle for PYP from Ujj et al. (Ujj et al., 1998). Reprinted with permission from Ujj et al., Biophys. J. 75, 406–412 (1998). Copyright 1998 Biophysical Society.
FIG. 3.
FIG. 3.
(a) Normalized stationary absorption and fluorescence spectra of PYP at room temperature. The arrow at 400 nm (25 000 cm−1) indicates the excitation energy for stationary and time-resolved experiments. The dotted line represents the energy ω00 at the crossing point of the absorption and fluorescence spectra. The schematic potential-energy diagram is illustrated in the inset with the crossing point of the absorption and fluorescence spectra denoted ω00, excitation energy ω1, emitted photon energy ω2, and redistribution energy ER. (b) Time-resolved fluorescence spectra of PYP recorded by Kerr-gate spectroscopy. A hump centered at a wavelength of 468 nm and at a delay time of 0.0 ps, indicated by a dotted line, is due to Raman scattering from water. The time-integrated fluorescence spectrum is also shown on top for comparison (Nakamura et al., 2007). Adapted with permission from J. Chem. Phys. 127(21), 215102 (2007). Copyright 2007 AIP Publishing LLC.
FIG. 4.
FIG. 4.
Time-resolved fluorescence emission of PYP in a crystal and in solution at three selected wavelengths following 410 nm excitation. The emission intensities were recorded with ∼200 fs time resolution using the fluorescence upconversion method (Chosrowjan et al., 2015). Reprinted with permission from Chosrowjan et al., FEBS J. 282(16), 3003–3015 (2015). Copyright 2015 FEBS.
FIG. 5.
FIG. 5.
(a) Species-associated spectra (SAS) deduced from global analysis of PP (pump-probe) and PDP (pump-dump-probe) traces. The red curve is the SAS associated with the ESI1, ESI2, and ESI3 (excited state intermediate) states. The dashed blue curve is the ground-state intermediate, and the solid green and dashed green curves are the I0 and pR photoproducts, respectively. The solid blue curve is the bleach common to all transient ground states. The black curve is the pCA radical spectrum. These estimated spectra were also supported with the global fit of polarization-dependent PP data, which is published elsewhere (van Stokkum et al., 2004). (b) Connectivity schemes compatible with the data and used in the global analysis: inhomogeneous model and homogeneous model. Dynamical states are separated into four classes: excited state (red), ground state (blue), photocycle products (green), and two-photon ionization dynamics (black). ESI1, ESI2, and ESI3 refer to the excited-states #1, #2, and #3, respectively. pG is the equilibrated ground-state species, and GSI is the ground-state intermediate. Thick solid arrows represent the initial excitation process from the laser pulse and thin solid arrows represent the “natural” PP population dynamics. The dashed arrows represent the population transfer dynamics that may be enhanced with the dump pulse (Larsen et al., 2004). Reprinted with permission from Larsen et al., Biophys. J. 87(3), 1858–1872 (2004). Copyright 2004 Biophysical Society.
FIG. 6.
FIG. 6.
A strong Raman mode found at 628 cm−1 and associated with I0 appears with a time constant of 2.4 ps (Kuramochi et al., 2017); according to density functional theory (DFT) calculations, this mode is consistent with a normal mode calculated for the pR0 cis intermediate reported by Schotte et al. (Schotte et al., 2012). Reprinted with permission from Kuramochi et al., Nat. Chem. 9(7), 660–666 (2017). Copyright 2017 Macmillan Publishers Limited.
FIG. 7.
FIG. 7.
Schematic representations of PYP photoactivation and three-state potential energy curves along the isomerization coordinate. (Left) Side chain packing differences in PYP generate conformational substates (a,b,c) that coexist in thermal equilibrium with higher energy states having low occupancy (blue Gaussian). Photoexcitation of pG(a,b,c) (blue arrows) maps the ground state thermal distribution onto the first excited electronic state pG*(a,b,c); Frank–Condon overlap favors higher vibrational states (blue absorption spectrum), creating a non-equilibrium vibrational energy distribution that relaxes non-exponentially, first through intramolecular (sub-picosecond), then through intermolecular (ps) vibrational energy redistribution (dashed gray curve with arrow), ultimately generating an equilibrium thermal distribution in the excited state (green Gaussian). PYP fluorescence arises from radiative transitions from the excited to the ground electronic state (green arrows); Frank–Condon overlap favors higher vibrational states in the ground state (green emission spectrum). Fluorescence detected prior to vibrational energy relaxation in the excited electronic state is spectrally broadened, but rapidly narrows as the pCA chromophore cools and returns to thermal equilibrium. (Right) The torsional restraint imposed by the C2=C3 double bond in pCA leads to minima along the isomerization coordinate for trans and cis isomers, and is modeled with separate cos θ diabatic curves for the trans and cis states, but with cis exhibiting a higher potential energy due to steric effects. Photoexcitation of pCA breaks this double bond and frees this restraint, resulting in an excited state diabatic curve that is formally flat, but is modeled with a small amplitude cos θ curve due to steric effects, as in the ground electronic state. Mixing of these ground and excited diabatic curves generates avoided curve crossings with splittings that separate three diabatic curves into three adiabatic electronic states: S0, S1, and S2. Photoexcitation (blue arrow) from the trans ground electronic state (S0) accesses a relatively shallow minimum in the first excited electronic state (S1) with small barriers controlling access to the steeply sloped, reactive portion of the potential energy curve. After accessing the reactive region, a second avoided crossing is encountered and the nuclear motion either continues along the isomerization coordinate toward the cis minimum (magenta arrow) or is redirected back toward the trans minimum (red arrow), with the partitioning between these two pathways influenced by local side chain packing, i.e., conformational substates. For clarity, nuclear motion on the reactive curve is indicated only on the right side, but can also occur on the left side, with partitioning between the two directions influenced by conformational substates. Being higher in free energy than trans, the cis isomer spontaneously reverts back to the trans isomer, but does so on a much longer time scale that is dictated by the activation barrier at the avoided crossing that separates them (green arrow).
FIG. 8.
FIG. 8.
Pump-probe geometry used to acquire time-resolved diffraction snapshots. The PYP crystal is sealed in a thin-walled glass capillary. Because the laser penetration depth in PYP is shallow, an orthogonal pump-probe geometry is used in which the top edge of the protein crystal is positioned at the top edge of the focused x-ray pulse. This geometry ensures optimal overlap between the laser and x-ray illuminated volumes of the crystal. The protein crystal acts as a monochromator with various line spacings (d) and diffracts different x-ray colors (λ) in different directions (θ) according to Bragg's law (λ = 2d sin θ). Approximately 3000 spots are found in each time-resolved diffraction image. The spots in this figure are annotated according to integrated photons (spot dimension) and x-ray wavelength (spot color) (Schotte et al., 2012).
FIG. 9.
FIG. 9.
Time-resolved population of transient intermediates and their structures. (a) Kinetic model used to account for structural changes spanning ten decades; the arrows are labeled with globally refined rate constants. Half the population short-circuits to the ground state during the pR2 → pB0 transition. (b) Time-dependent populations of each intermediate in the PYP photocycle: theoretical population predicted by the kinetic model (solid lines) and least squares contributions from the four electron-density base maps (filled circles). (c)–(f) Structures for pR0, pR1, pR2, and pB0 intermediates. (Left and Center Left) Electron-density base maps were derived from global analysis and phased with refined structures (front and side views). (Center Right) Refined structures of pCA intermediates and their hydrogen-bonding partners. To highlight the structural changes leading to the corresponding intermediate, they are overlaid with a semitransparent structure (gray) of the preceding state. (Right) Color-coded rendering of the protein backbone according to Cα displacement relative to pG, as indicated by the scale (rendered with VMD) (Schotte et al., 2012).
FIG. 10.
FIG. 10.
Time-resolved SAXS/WAXS scattering of PYP in solution. (a) Global analysis of time-dependent scattering differences recorded over ten decades of time spanning 100 ps to 1 s unveils four PYP intermediates plus a vector that corresponds to water differences following a 1 °C temperature jump. (b) Time-dependent amplitudes of scattering vectors shown in (a). (c) GASBOR reconstruction of particle shapes for pG and the four photocycle intermediate states found in solution along with their rates of interconversion in the PYP photocycle. The intermediates follow the color coding used in the Schotte photocycle (Cho et al., 2016).
FIG. 11.
FIG. 11.
PYP photocycle with rates from both time-resolved crystallography and time-resolved x-ray scattering. Photoexcitation of pG (blue arrow) generates an electronically excited state, pG*, which returns to the ground electronic state via fluorescence (green arrow), non-radiatively back to pG (gray dashed arrow), or via a photocycle that commences with the pR0 state (gray arrow). The quantum efficiency for generating pR0 is low. The formation of pR0 triggers a sequence of structural changes that leads to the pB0 state, into which a water molecule is rapidly incorporated to generate the pB0•H2O state. The pB0•H2O → pB1•H2O transition involves partial unfolding of the N-terminal domain (orange helices that cap the top of PYP in the GASBOR envelopes; bottom) and cannot occur in the crystal. There is no structural evidence for the pB0 state without water nor the trans pCA•H2O state, but they are included in the photocycle based on mechanistic arguments (see the text). The kinetic rates are in units of s−1, with cyan values corresponding to rates extracted from solution scattering data.
FIG. 12.
FIG. 12.
Simplified PYP photocycles deduced from time-resolved visible and mid-IR absorption spectra acquired from solution (gray arrows) and from crushed crystals (red arrows) (Konold et al., 2020). The quantum efficiencies for forming the first cis intermediates were extracted from a more complete kinetic scheme. Reprinted with permission from Konold et al., Nat. Chem. 11(1), 4248 (2020). Copyright 2020 Author(s), licensed under a Creative Commons Attribution (CC BY) license.
FIG. 13.
FIG. 13.
PYP photocycle generated from time-resolved Laue crystallography study of wild-type and E46Q PYP crystals grown with precipitant lacking chloride, as reported by Jung et al. (Jung et al., 2013). The top panels depict intermediates characterized in their respective photocycles, the middle panels depict the time-dependent populations of early intermediates, and the bottom panel depicts a timeline with a branching photocycle that accounts for not only multiple pR intermediates that coexist up until their conversion to pB but also to account for non-exponential recovery of the ground, pG state. The color-coded, boxed labels connected with dashed arrows in the upper left panel correspond to intermediates reported by Schotte et al. (Schotte et al., 2012). The timeline in the bottom panel is also annotated according to the estimated lifetimes of these intermediates. Reprinted with permission from Jung et al., Nat. Chem. 5(3), 212–220 (2013). Copyright 2013 Macmillan Publishers Limited.
FIG. 14.
FIG. 14.
Anomalous scattering of PYP. (a) Anomalous electron density map (F+-F-, φc-90°) contoured at 3.6 σ in white reveals five internal sulfur (yellow) and three surface chloride (green) sites. (b) Enlarged view of Cl2. Normal density map (2mFo-DFc, φc) contoured at 1.6 σ in cyan, anomalous density (F+-F-, φc-90°) contoured at 3.6 σ in white. Green balls: Cl- ions; small red balls: waters of hydration with distances from Cl2; blue balls: positive charged amino groups exposed to the surface with distances from Cl2 (PDB ID 9AZ7).
FIG. 15.
FIG. 15.
Chromophore tail torsional angle dynamics. Torsional angle φtail (solid spheres) is from structural refinement at various delays. Dashed line: fit to empirical function used to deduce the transition time (∼590 fs). Gray region: not time-resolved. Pink region: twisted trans on excited state potential energy surface. Light green region: cis on ground state potential energy surface. Insets: structures of PYPfast (pink), PYPslow, and PYP3ps (light green), and dark structure PYPref in yellow. Difference electron density is shown in red (–3σ) and blue (3σ). Reprinted with permission from Pande et al. Science 352(6286), 725–729 (2016). Copyright 2016 American Association for the Advancement of Science.
FIG. 16.
FIG. 16.
Front and side views of time-resolved structural changes recorded as a function of time delay after photoexcitation of PYP. The right two panels show an expanded, annotated view of the boxed region in the left two panels. The ground state electron density map in the color-coded overlays is colored magenta, and the time-resolved map is colored green. Where magenta and green overlap, the electron density blends to white. The magenta-to-green color gradient unveils the direction of atomic motion. Large-amplitude displacements in (a) are indicated with yellow arrows. The stick models correspond to refined structures for the ground state (pG) and the time-resolved intermediate. Hydrogen bonds to the pCA chromophore are indicated as dotted lines in the right side of panel (a). Row (a): PDB ID: 4B9O (Schotte et al., 2012); Row (b)–(d): PDB IDs: 5HDS, 5HDD, 5HDC (Pande et al., 2016). Magenta: Fc map, Green Fc + ΔFo, map. Rendered with LaueMap.

Similar articles

Cited by

References

    1. Baca, M. , Borgstahl, G. E. , Boissinot, M. , Burke, P. M. , Williams, D. R. , Slater, K. A. , and Getzoff, E. D. , “ Complete chemical structure of photoactive yellow protein: Novel thioester-linked 4-hydroxycinnamyl chromophore and photocycle chemistry,” Biochemistry 33(48), 14369–14377 (1994).10.1021/bi00252a001 - DOI - PubMed
    1. Borgstahl, G. E. , Williams, D. R. , and Getzoff, E. D. , “ 1.4 A structure of photoactive yellow protein, a cytosolic photoreceptor: Unusual fold, active site, and chromophore,” Biochemistry 34(19), 6278–6287 (1995).10.1021/bi00019a004 - DOI - PubMed
    1. Cho, H. S. , Schotte, F. , Dashdorj, N. , Kyndt, J. , and Anfinrud, P. A. , “ Probing anisotropic structure changes in proteins with picosecond time-resolved small-angle x-ray scattering,” J. Phys. Chem. B 117(49), 15825–15832 (2013).10.1021/jp407593j - DOI - PMC - PubMed
    1. Cho, H. S. , Schotte, F. , Dashdorj, N. , Kyndt, J. , Henning, R. , and Anfinrud, P. A. , “ Picosecond photobiology: Watching a signaling protein function in real time via time-resolved small- and wide-angle x-ray scattering,” J. Am. Chem. Soc. 138(28), 8815–8823 (2016).10.1021/jacs.6b03565 - DOI - PMC - PubMed
    1. Chosrowjan, H. , Taniguchi, S. , and Tanaka, F. , “ Ultrafast fluorescence upconversion technique and its applications to proteins,” FEBS J. 282(16), 3003–3015 (2015).10.1111/febs.13180 - DOI - PubMed