

Towards optimized tissue regeneration: a new 3D printable bioink of alginate/cellulose hydrogel loaded with thrombocyte concentrate
- PMID: 38595995
- PMCID: PMC11002213
- DOI: 10.3389/fbioe.2024.1363380
Towards optimized tissue regeneration: a new 3D printable bioink of alginate/cellulose hydrogel loaded with thrombocyte concentrate
Abstract
Introduction: Autologous platelet concentrate (APC) are pro-angiogenic and can promote wound healing and tissue repair, also in combination with other biomaterials. However, challenging defect situations remain demanding. 3D bioprinting of an APC based bioink encapsulated in a hydrogel could overcome this limitation with enhanced physio-mechanical interface, growth factor retention/secretion and defect-personalized shape to ultimately enhance regeneration.
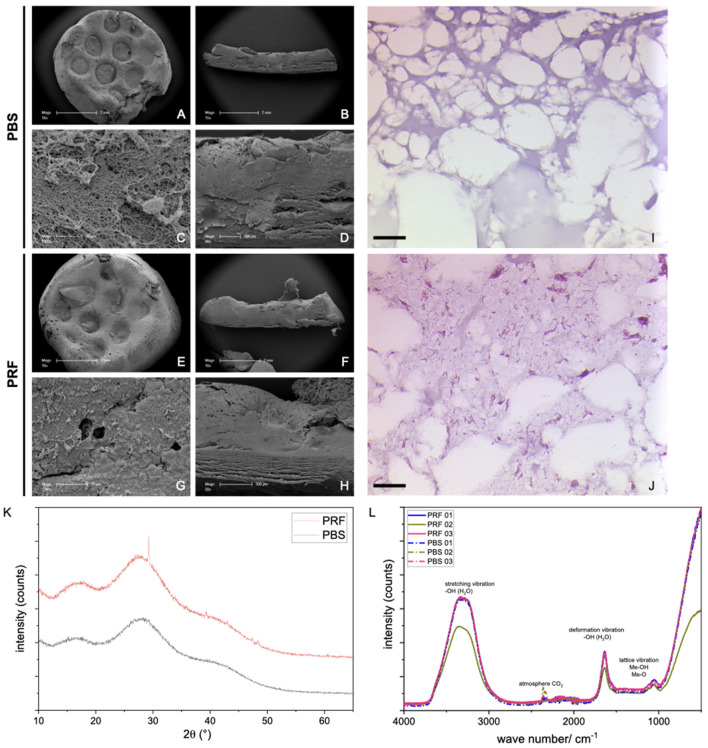
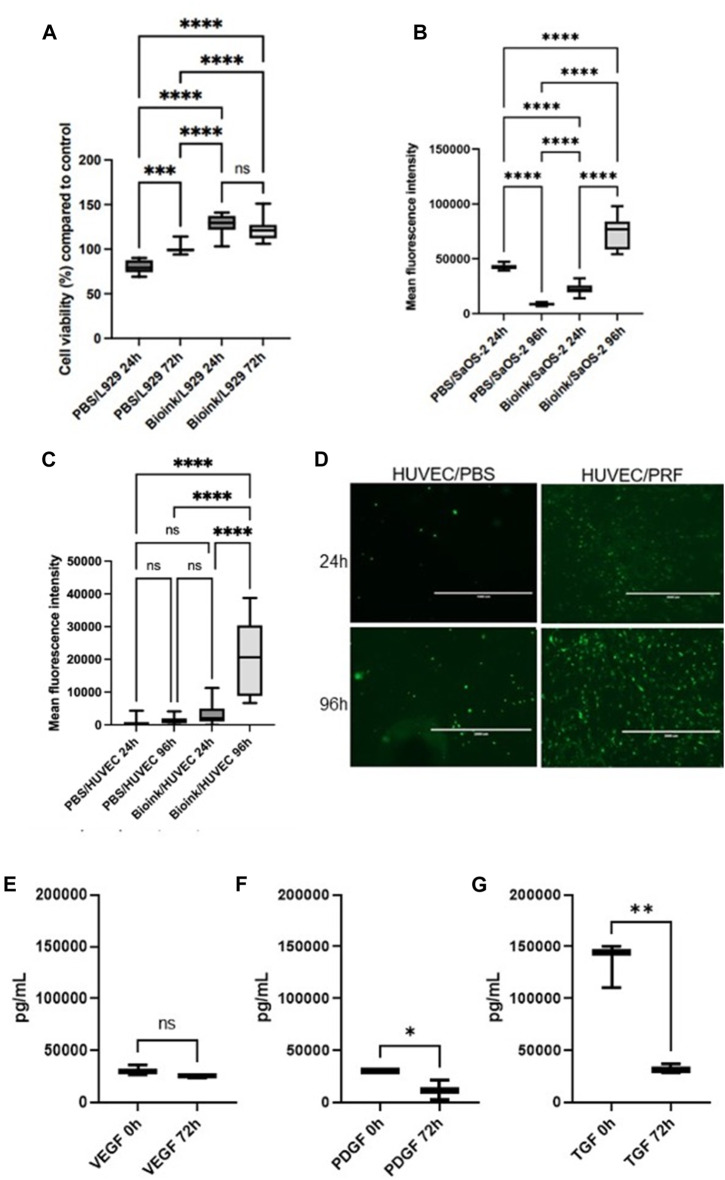
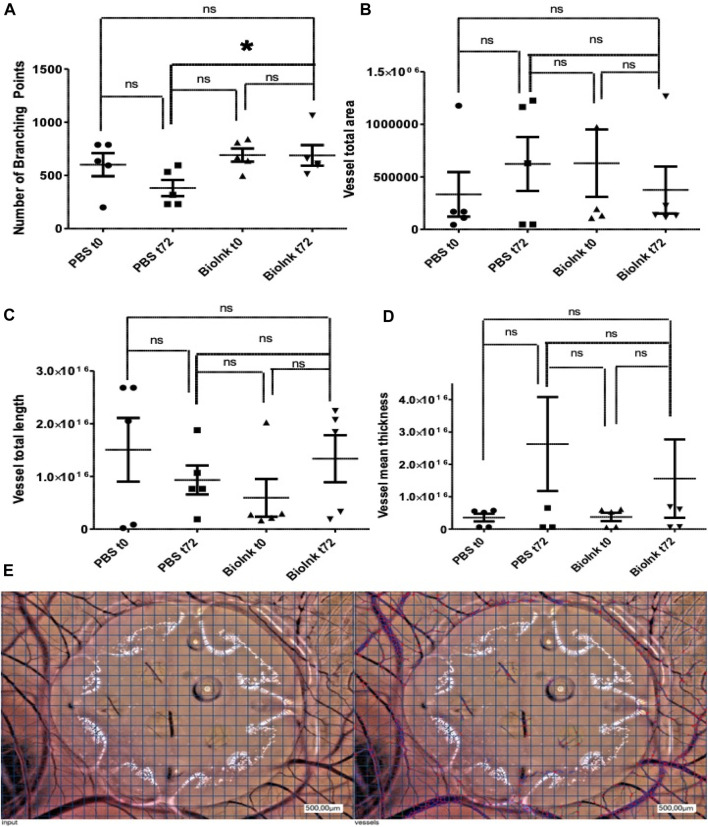
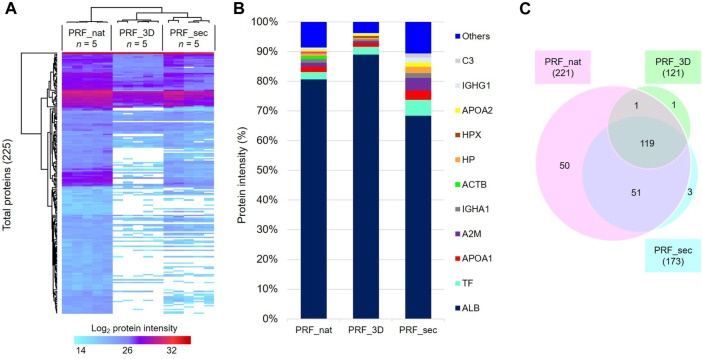
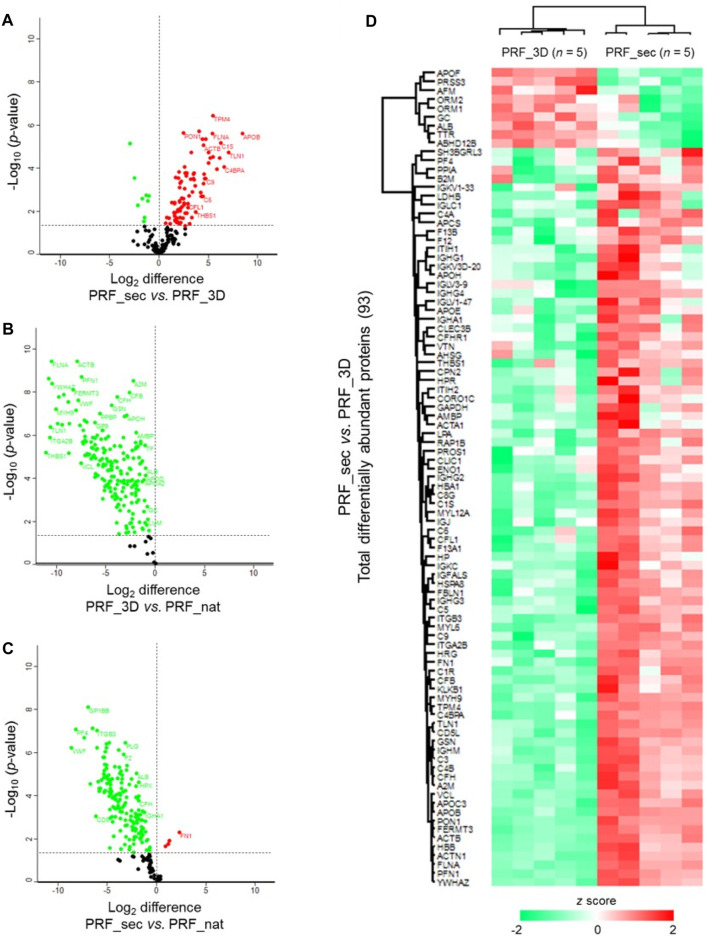
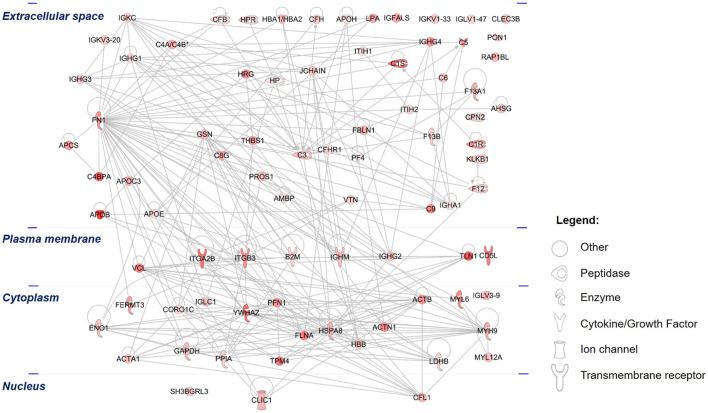
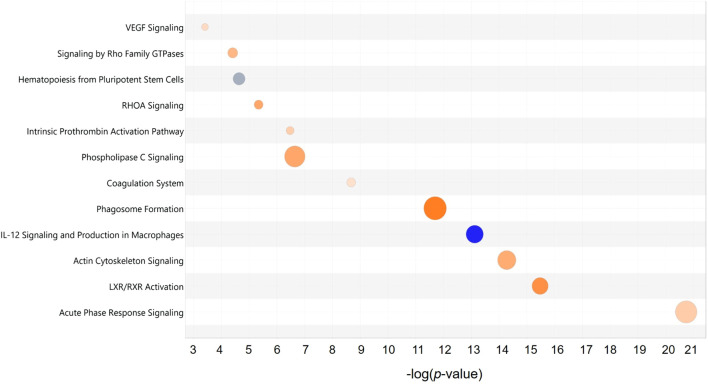
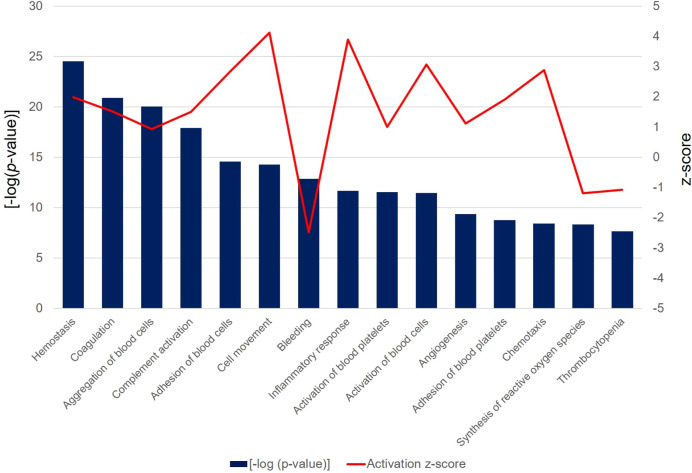
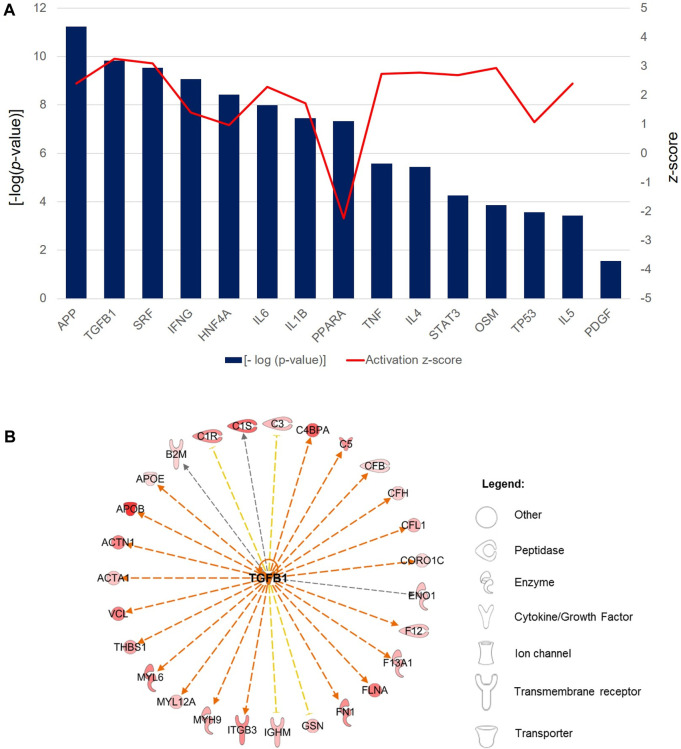
Methods: This study used extrusion-based bioprinting to create a novel bioink of alginate/cellulose hydrogel loaded with thrombocyte concentrate. Chemico-physical testing exhibited an amorphous structure characterized by high shape fidelity. Cytotoxicity assay and incubation of human osteogenic sarcoma cells (SaOs2) exposed excellent biocompatibility. enzyme-linked immunosorbent assay analysis confirmed pro-angiogenic growth factor release of the printed constructs, and co-incubation with HUVECS displayed proper cell viability and proliferation. Chorioallantoic membrane (CAM) assay explored the pro-angiogenic potential of the prints in vivo. Detailed proteome and secretome analysis revealed a substantial amount and homologous presence of pro-angiogenic proteins in the 3D construct.
Results: This study demonstrated a 3D bioprinting approach to fabricate a novel bioink of alginate/cellulose hydrogel loaded with thrombocyte concentrate with high shape fidelity, biocompatibility, and substantial pro-angiogenic properties.
Conclusion: This approach may be suitable for challenging physiological and anatomical defect situations when translated into clinical use.
Keywords: additive manufacturing; bioprinting; hydrogel; platelet rich fibrin; reconstruction.
Copyright © 2024 Grandjean, Perumal, Manicam, Matthey, Wu, Thiem, Stein, Henrich, Kämmerer, Al-Nawas, Ritz and Blatt.
Conflict of interest statement
The authors declare that the research was conducted in the absence of any commercial or financial relationships that could be construed as a potential conflict of interest.
Figures
Similar articles
-
Biofabrication of skin tissue constructs using alginate, gelatin and diethylaminoethyl cellulose bioink.Int J Biol Macromol. 2021 Oct 31;189:398-409. doi: 10.1016/j.ijbiomac.2021.08.114. Epub 2021 Aug 20. Int J Biol Macromol. 2021. PMID: 34419550
-
Osteogenic and angiogenic tissue formation in high fidelity nanocomposite Laponite-gelatin bioinks.Biofabrication. 2019 Jun 12;11(3):035027. doi: 10.1088/1758-5090/ab19fd. Biofabrication. 2019. PMID: 30991370
-
Cell-Laden Nanocellulose/Chitosan-Based Bioinks for 3D Bioprinting and Enhanced Osteogenic Cell Differentiation.ACS Appl Bio Mater. 2021 Mar 15;4(3):2342-2353. doi: 10.1021/acsabm.0c01108. Epub 2021 Feb 17. ACS Appl Bio Mater. 2021. PMID: 35014355
-
ECM Based Bioink for Tissue Mimetic 3D Bioprinting.Adv Exp Med Biol. 2018;1064:335-353. doi: 10.1007/978-981-13-0445-3_20. Adv Exp Med Biol. 2018. PMID: 30471042 Review.
-
Advanced Strategies for 3D Bioprinting of Tissue and Organ Analogs Using Alginate Hydrogel Bioinks.Mar Drugs. 2021 Dec 15;19(12):708. doi: 10.3390/md19120708. Mar Drugs. 2021. PMID: 34940707 Free PMC article. Review.
Cited by
-
Navigating the combinations of platelet-rich fibrin with biomaterials used in maxillofacial surgery.Front Bioeng Biotechnol. 2024 Oct 7;12:1465019. doi: 10.3389/fbioe.2024.1465019. eCollection 2024. Front Bioeng Biotechnol. 2024. PMID: 39434715 Free PMC article. Review.
-
A review of synergistic strategies in cancer therapy: resveratrol-loaded hydrogels for targeted and multimodal treatment.Discov Oncol. 2025 Jul 21;16(1):1382. doi: 10.1007/s12672-025-03079-w. Discov Oncol. 2025. PMID: 40690143 Free PMC article. Review.
-
Cellulose-Based Hybrid Hydrogels for Tissue Engineering Applications: A Sustainable Approach.Gels. 2025 Jun 6;11(6):438. doi: 10.3390/gels11060438. Gels. 2025. PMID: 40558737 Free PMC article. Review.
-
Combination Therapy with Trehalose and Hyaluronic Acid Restores Tear Lipid Layer Functionality by Ameliorating Inflammatory Response Protein Markers on the Ocular Surface of Dry Eye Patients.J Clin Med. 2025 Aug 5;14(15):5525. doi: 10.3390/jcm14155525. J Clin Med. 2025. PMID: 40807147 Free PMC article.
References
-
- Agarwal N., Solanki V. S., Ameta K. L., Yadav V. K., Gupta P., Wanale S. G., et al. (2023). 4-Dimensional printing: exploring current and future capabilities in biomedical and healthcare systems-a Concise review. Front. Bioeng. Biotechnol. 11, 1251425. 10.3389/fbioe.2023.1251425 - DOI - PMC - PubMed
LinkOut - more resources
Full Text Sources