

Molecular subtype construction and prognosis model for stomach adenocarcinoma characterized by metabolism-related genes
- PMID: 38596054
- PMCID: PMC11002599
- DOI: 10.1016/j.heliyon.2024.e28413
Molecular subtype construction and prognosis model for stomach adenocarcinoma characterized by metabolism-related genes
Abstract
Background: Metabolic reprogramming is implicated in cancer progression. However, the impact of metabolism-associated genes in stomach adenocarcinomas (STAD) has not been thoroughly reviewed. Herein, we characterized metabolic transcription-correlated STAD subtypes and evaluated a metabolic RiskScore for evaluation survival.
Method: Genes related to metabolism were gathered from previous study and metabolic subtypes were screened using ConsensusClusterPlus in TCGA-STAD and GSE66229 dataset. The ssGSEA, MCP-Count, ESTIMATE and CIBERSORT determined the immune infiltration. A RiskScore model was established using the WGCNA and LASSO Cox regression in the TCGA-STAD queue and verified in the GSE66229 datasets. RT-qPCR was employed to measure the mRNA expressions of genes in the model.
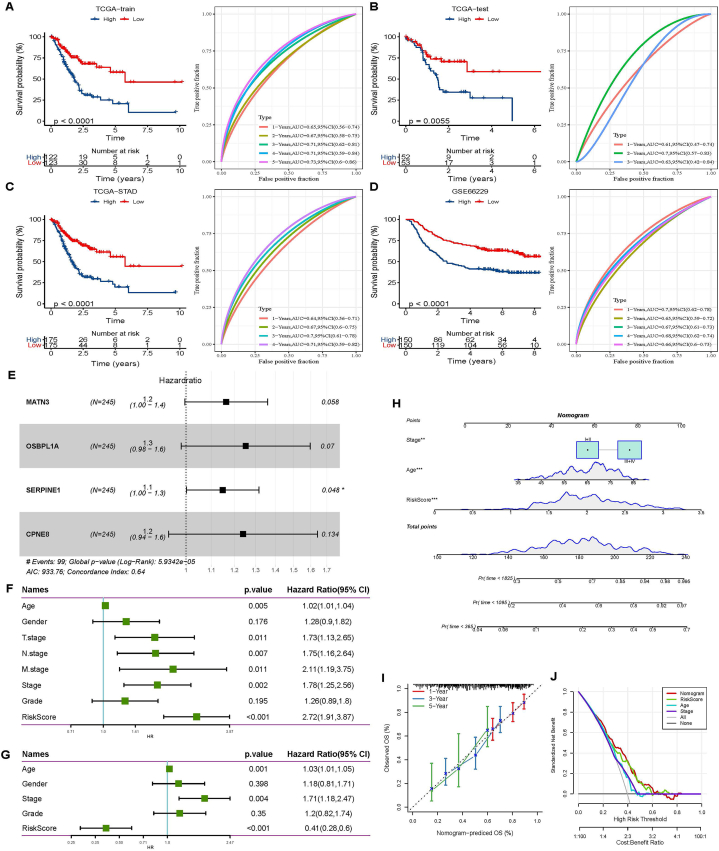
Result: Two metabolism-related subtypes (C1 and C2) of STAD were constructed on account of the expression profiles of 113 prognostic metabolism genes with different immune outcomes and apparently distinct metabolic characteristic. The overall survival (OS) of C2 subtype was shorter than that of C1 subtype. Four metabolism-associated genes in turquoise model, which closely associated with C2 subtype, were employed to build the RiskScore (MATN3, OSBPL1A, SERPINE1, CPNE8) in TCGA-train dataset. Patients developed a poorer prognosis if they had a high RiskScore than having a low RiskScore. The promising effect of RiskScore was verified in the TCGA-test, TCGA-STAD and GSE66229 datasets. The prediction reliability of the RiskScore was validated by time-dependent receiver operating characteristic curve (ROC) and nomogram. Moreover, samples with high RiskScore had an enhanced immune status and TIDE score. Moreover, MATN3, OSBPL1A, SERPINE1 and CPNE8 mRNA levels were all elevated in SGC7901 cells. Inhibition of OSBPL1A decreased SGC7901 cells invasion numbers.
Conclusion: This work provided a new perspective into heterogeneity in metabolism and its association with immune escape in STAD. RiskScore was considered to be a strong prognostic label that could help individualize the treatment of STAD patients.
Keywords: Genes; Immune landscape; Metabolism; Prognosis; Prognosis model; Stomach adenocarcinomas.
© 2024 The Authors. Published by Elsevier Ltd.
Conflict of interest statement
All the authors declared no personal relationships or competing financial interests that could influence the results reported by this paper.
Figures


Similar articles
-
Amino acid metabolism-related genes as potential biomarkers and the role of MATN3 in stomach adenocarcinoma: A bioinformatics, mendelian randomization and experimental validation study.Int Immunopharmacol. 2024 Dec 25;143(Pt 1):113253. doi: 10.1016/j.intimp.2024.113253. Epub 2024 Sep 30. Int Immunopharmacol. 2024. PMID: 39353384
-
Development and validation of a risk prognostic model based on the H. pylori infection phenotype for stomach adenocarcinoma.Heliyon. 2024 Aug 24;10(17):e36882. doi: 10.1016/j.heliyon.2024.e36882. eCollection 2024 Sep 15. Heliyon. 2024. PMID: 39281596 Free PMC article.
-
Single-cell data revealed CD14-type and FCGR3A-type macrophages and relevant prognostic factors for predicting immunotherapy and prognosis in stomach adenocarcinoma.PeerJ. 2024 Jan 22;12:e16776. doi: 10.7717/peerj.16776. eCollection 2024. PeerJ. 2024. PMID: 38274323 Free PMC article.
-
Identification of a fatty acid metabolism-related gene signature to predict prognosis in stomach adenocarcinoma.Aging (Albany NY). 2024 May 13;16(10):8552-8571. doi: 10.18632/aging.205823. Epub 2024 May 13. Aging (Albany NY). 2024. PMID: 38742949 Free PMC article.
-
Construction of a prognostic risk model for Stomach adenocarcinoma based on endoplasmic reticulum stress genes.Wien Klin Wochenschr. 2024 Jun;136(11-12):319-330. doi: 10.1007/s00508-023-02306-0. Epub 2023 Nov 22. Wien Klin Wochenschr. 2024. PMID: 37993598
Cited by
-
Applying integrated transcriptome and single-cell sequencing analysis to develop a prognostic signature based on M2-like tumor-associated macrophages for breast cancer.Discov Oncol. 2025 Mar 25;16(1):389. doi: 10.1007/s12672-025-02161-7. Discov Oncol. 2025. PMID: 40131644 Free PMC article.
-
G Protein-coupled Estrogen Receptor 1 (GPER1) Regulates Expression of SERPINE1/PAI-1 and Inhibits Tumorigenic Potential of Cervical Squamous Cell Carcinoma Cells In Vitro.Cancer Genomics Proteomics. 2025 Jan-Feb;22(1):13-23. doi: 10.21873/cgp.20482. Cancer Genomics Proteomics. 2025. PMID: 39730177 Free PMC article.
References
-
- Sung H., et al. Global cancer statistics 2020: GLOBOCAN estimates of incidence and mortality worldwide for 36 cancers in 185 countries. CA Cancer J Clin. 2021;71(3):209–249. - PubMed
-
- Qiu J., et al. Identification of the novel prognostic biomarker SERPINH1 reveals its relationship with immunology in gastric cancer. Oncologie. 2023;25(4):367–379.
-
- Xu H., et al. Hsa_circ_0079598 acts as a potential diagnostic and prognostic biomarker for gastric cancer. Oncologie. 2023;25(2):179–186.
-
- Ajani J.A., et al. Gastric adenocarcinoma. Nat Rev Dis Primers. 2017;3 - PubMed
LinkOut - more resources
Full Text Sources
Miscellaneous
