

Low-dose decitabine enhances the efficacy of viral cancer vaccines for immunotherapy
- PMID: 38596301
- PMCID: PMC10869747
- DOI: 10.1016/j.omton.2024.200766
Low-dose decitabine enhances the efficacy of viral cancer vaccines for immunotherapy
Abstract
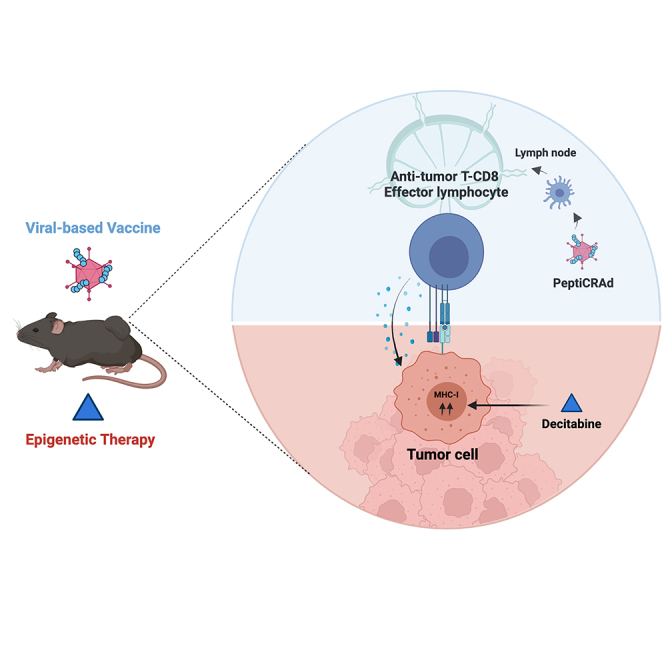
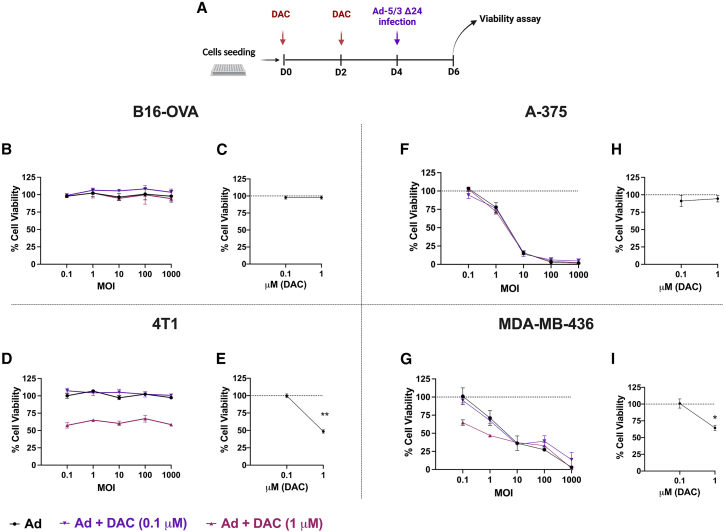
Cancer immunotherapy requires a specific antitumor CD8+ T cell-driven immune response; however, upon genetic and epigenetic alterations of the antigen processing and presenting components, cancer cells escape the CD8+ T cell recognition. As a result, poorly immunogenic tumors are refractory to conventional immunotherapy. In this context, the use of viral cancer vaccines in combination with hypomethylating agents represents a promising strategy to prevent cancer from escaping immune system recognition. In this study, we evaluated the sensitivity of melanoma (B16-expressing ovalbumin) and metastatic triple-negative breast cancer (4T1) cell lines to FDA-approved low-dose decitabine in combination with PeptiCRAd, an adenoviral anticancer vaccine. The two models showed different sensitivity to decitabine in vitro and in vivo when combined with PeptiCRAd. In particular, mice bearing syngeneic 4T1 cancer showed higher tumor growth control when receiving the combinatorial treatment compared to single controls in association with a higher expression of MHC class I on cancer cells and reduction in Tregs within the tumor microenvironment. Furthermore, remodeling of the CD8+ T cell infiltration and cytotoxic activity toward cancer cells confirmed the effect of decitabine in enhancing anticancer vaccines in immunotherapy regimens.
Keywords: MT: Regular Issue; cancer vaccines; epigenetic therapy; immunotherapy; oncolytic vaccines; oncolytic viruses.
© 2024 The Author(s).
Conflict of interest statement
V.C. is a cofounder and shareholder at VALO Therapeutics.
Figures


Similar articles
-
Oncolytic vaccines increase the response to PD-L1 blockade in immunogenic and poorly immunogenic tumors.Oncoimmunology. 2018 May 7;7(8):e1457596. doi: 10.1080/2162402X.2018.1457596. eCollection 2018. Oncoimmunology. 2018. PMID: 30221051 Free PMC article.
-
DNA methyltransferase inhibition increases efficacy of adoptive cellular immunotherapy of murine breast cancer.Cancer Immunol Immunother. 2016 Sep;65(9):1061-73. doi: 10.1007/s00262-016-1868-8. Epub 2016 Jul 14. Cancer Immunol Immunother. 2016. PMID: 27416831 Free PMC article.
-
Immunotherapy combining tumor and endothelium cell lysis with immune enforcement by recombinant MIP-3α Newcastle disease virus in a vessel-targeting liposome enhances antitumor immunity.J Immunother Cancer. 2022 Mar;10(3):e003950. doi: 10.1136/jitc-2021-003950. J Immunother Cancer. 2022. PMID: 35256516 Free PMC article.
-
Recent Advances in Lung Cancer Immunotherapy: Input of T-Cell Epitopes Associated With Impaired Peptide Processing.Front Immunol. 2019 Jul 3;10:1505. doi: 10.3389/fimmu.2019.01505. eCollection 2019. Front Immunol. 2019. PMID: 31333652 Free PMC article. Review.
-
Sharpening the Edge for Precision Cancer Immunotherapy: Targeting Tumor Antigens through Oncolytic Vaccines.Front Immunol. 2017 Jul 13;8:800. doi: 10.3389/fimmu.2017.00800. eCollection 2017. Front Immunol. 2017. PMID: 28751892 Free PMC article. Review.
Cited by
-
5-Aza-2'-deoxycytidin (Decitabine) increases cancer-testis antigen expression in head and neck squamous cell carcinoma and modifies immune checkpoint expression, especially in CD39-positive CD8 and CD4 T cells.Neoplasia. 2025 Jan;59:101086. doi: 10.1016/j.neo.2024.101086. Epub 2024 Nov 27. Neoplasia. 2025. PMID: 39608124 Free PMC article.
-
Evaluation and In Situ Library Expansion of Small Molecule MHC-I Inducers.bioRxiv [Preprint]. 2025 Feb 5:2025.01.31.635109. doi: 10.1101/2025.01.31.635109. bioRxiv. 2025. PMID: 39975032 Free PMC article. Preprint.
References
-
- Harrington K., Freeman D.J., Kelly B., Harper J., Soria J.-C. Optimizing oncolytic virotherapy in cancer treatment. Nat. Rev. Drug Discov. 2019;18:689–706. - PubMed
LinkOut - more resources
Full Text Sources
Research Materials